The Fowler lines and the and Bowen fluorescence lines in the symbiotic nova RR Tel
Abstract
Aims. A detailed study of the and Bowen lines in the spectrum of RR Tel
Methods. Absolute intensities for the , , and emission lines have been obtained from STIS, UVES, FEROS and IUE data, after re-calibration of UVES and FEROS on the STIS scale.
Results. A new measure of reddening (E(B-V)0.00) has been obtained from the comparison between the observed and the theoretical intensity decrement for 20 emission lines of the Fowler (n3) series. This value has been confirmed by the STIS and IUE continuum distribution, and by the value of nH from the damped profile of the IS H Ly- line. We have obtained very accurate measurements for about thirty Bowen lines of and a precise determination of the efficiency in the O1 and O3 excitation channels (18 and 0.7 , respectively). The relative intensities are in good agreement with the predictions by Froese Fischer (1994). A detailed study of the decays from all levels involved in the Bowen mechanism has lead to the detection of two new Bowen lines near 2190. High resolution IUE data have shown a nearly linear decline with time, from 1978 to 1995, in the efficiency of the O1 and O3 processes, with a steeper slope for the O3 channel. A detailed study of the 4640 lines and of their excitation mechanism has shown that, recombination and continuum fluorescence being ruled out, line fluorescence remains the only viable mechanism to pump the 3d and 3d levels of . We point out the important role of multiple scattering in the resonance lines of and near 374 and show that the observed line ratios and intensities can be explained in terms of line fluorescence by the three resonance lines of at 374.432, 374.162 and 374.073 under optically thick conditions.
Key Words.:
Stars: novae - Stars: binaries: symbiotic - Ultraviolet: stars - Atomic processes - Radiative transfer1 Introduction
RR Tel is one of the slowest of all novae and is still evolving in the nebular stage more than 60 years after the outburst of Oct. 1944. RR Tel has been classified also as a symbiotic nova on account of the presence of an M5 III star in the binary system. In 1949 the nova remnant started to shrink back to white dwarf dimensions: the visual brightness began a gradual decline, although the stellar temperature increased, and the nebular emission showed a slow evolution toward an increasing degree of ionization (Mayall 1949, Thackeray 1977, Murset and Nussbaumer 1993). A distinctive peculiarity of RR Tel is the richness and complexity of its emission spectrum that spans a wide range of ionization and excitation. The simultaneous presence of spectral features attributable to: 1) the hot nova remnant with Teff about 150,000 K (Hayes and Nussbaumer 1986, hereinafter HN86), 2) the M5 III companion star with semi-regular Mira-like pulsations (P 387d) (Henize and McLaughlin 1951, Feast et al. 1977), 3) a slowly expanding nebula illuminated by the hot remnant, 4) the ”shocked” region where, allegedly, the wind from the giant and the wind of the nova interact (Contini and Formiggini, 1999), 5) an IR excess whose origin is quite uncertain (free-free, dust), makes RR Tel an ideal laboratory for studies of low-density astrophysical plasmas.
The recent availability of very good quality UVES and STIS data of RR Tel has prompted us to combine them together, with the purpose of fully exploiting the best characteristics of these two instruments, i.e. the high spectral resolution of STIS in the UV and UVES in the optical, together with the wide wavelength coverage with absolutely calibrated data by STIS. This has allowed the detection of weak spectral features and accurate measurement of absolute emission line intensities (ELI) and line ratios. Data from FEROS (with resolution comparable to that of UVES) have been also used to complement the STIS data for in the two spectral regions near 4100 and 4640, not covered by UVES. High resolution IUE data in the LW region have also been used to follow the changes in the and line intensities from 1978 to 1995.
2 The spectroscopic data
2.1 HST-STIS data
We have retrieved from the HST archive the STIS spectra secured on Oct. 10, 2000 as part of program 8098 (see Keenan et al. 2002). The instrument setup included the echelle gratings E140M and E230M with FUV and NUV MAMA detectors, and the first-order gratings G430M and G750M with CCD detectors. The datasets are listed in Table 1, together with some relevant spectroscopic information. We note that the E140 M and E230 M echelle gratings together cover the spectral range from 1150 to 3110 Å, while the data obtained with the G430M and G750M first-order gratings cover the range from 3025 to 7100 Å. The absolute fluxes are accurate within 8 (MAMA) and 5 (CCD), while the wavelengths are accurate to 1.5-5.0 km s-1 (MAMA) and 3-15 km s-1 (CCD) (We refer to the www.stsci.edu/hst/stis/performance/accuracy/document.html page for more detailed information).
| Dataset | Filter-gra | Resolution | Detector | Aperture |
|---|---|---|---|---|
| O5EH01010 | E140M | 45800 | FUV-MAMA | 0.2 x 0.2 |
| O5EH01020 | G430M | 5330-10270 | CCD | 52 x 0.2 |
| O5EH01030 | E230M | 30000 | NUV-MAMA | 0.2 x 0.2 |
| O5EH01040 | G430M | 5330-10270 | CCD | 52 x 0.2 |
| O5EH01050 | G430M | 5330-10270 | CCD | 52 x 0.2 |
| O5EH01060 | G430M | 5330-10270 | CCD | 52 x 0.2 |
| O5EH01070 | G430M | 5330-10270 | CCD | 52 x 0.2 |
| O5EH01080 | G430M | 5330-10270 | CCD | 52 x 0.2 |
| O5EH01090 | E230M | 30000 | NUV-MAMA | 0.2 x 0.2 |
| O5EH010A0 | G430M | 5330-10270 | CCD | 52 x 0.2 |
| O5EH010B0 | G430M | 5330-10270 | CCD | 52 x 0.2 |
| O5EH010C0 | G430M | 5330-10270 | CCD | 52 x 0.2 |
| O5EH010D0 | G430M | 5330-10270 | CCD | 52 x 0.2 |
| O5EH010E0 | G750M | 4870-9950 | CCD | 52 x 0.2 |
| O5EH010F0 | G750M | 4870-9950 | CCD | 52 x 0.2 |
| O5EH010G0 | G750M | 4870-9950 | CCD | 52 x 0.2 |
The STIS data have been recently (Dec. 2003) re-calibrated to allow for the effects of increasing CCD charge transfer inefficiency (due to the accumulated effects of radiation exposure) and for the effects of time-dependent optical sensitivity. The work in the present paper is based on these recent data.
2.2 UVES data
For a description of the UVES spectra (obtained on Oct. 16th, 1999) and their reduction we refer to Selvelli and Bonifacio (2000). We note that the spectral resolution on UVES is close to 55000, for the red arm spectra, taken with a 08 slit and slightly higher ( 65000) for the blue arm spectra, where the slit was 06. The seeing conditions during UVES observations (mid Oct. 1999) were around 0.72-0.75 arcsec. The angular size of the RR Tel nebula is less than 0.1 arcsec, since its radius is near to 1.01015 cm (HN86) and the distance is about 3500 pc (see section 3.5).
No spectrophotometric standard star was observed that night, so the data presented in Selvelli and Bonifacio (2000) were simply normalized to the continuum. The instrument response function may be, nevertheless, estimated by using observations of a spectrophotometric standard star taken on a different night. For this we used the observations of the white dwarf EGGR 21 (Stone & Baldwin 1983, Bessel 1999) taken on September 26th 1999, observed with the same spectrograph setting as RR Tel but with a slit width of . The UVES spectrum thus calibrated is not suitable for flux measurements due to: a) the unknown slit losses, when observing with a narrow slit (smaller than the seeing FWHM); b) possible differences in atmospheric extinctions between the night in which RR Tel was observed and the night in which EGGR 21 was observed. We therefore decided to make use of the flux calibrated STIS spectrum to re-calibrate the UVES spectrum, in the ranges 3040-3820 and 5500-5700. We did so by forcing the continuum of the UVES spectrum to coincide with that of the STIS absolute distribution after proper fλ correction in selected line-free windows.
This has allowed us to obtain reliable emission line intensities (ELI) and reliable line ratios also for some (weak) emission lines that are clearly observed in UVES spectra but are not detected or are confused with noise in the STIS grating spectra in the optical range.
This procedure could be criticized since the STIS data have been secured about 1 year after the UVES ones, and the star flux is not constant with time. However, it is justified by the fact that the variations in the continuum and ELI of RR Tel are supposed to be quite slow with a time-scale of years (Murset and Nussbaumer 1993, Zuccolo et al. 1997). It is also justified, ”a posteriori”, by the fact that the ELI measured in STIS and UVES spectra (after this recalibration) give a nearly constant ( 0.03) ratio for those lines that are common to the two groups of spectra. See also Section 4.5 for a descripion of the absolute ELI changes in the last twenty years for and .
From the STIS/UVES ELI ratios nothing can be said about any absolute ELI changes between Oct. 1999 (UVES) and Oct. 2000 (STIS). One can only guess that most ELI have followed the general trend of a slow decline, following the continuum, with the possible exception of the high excitation and/or high ionization lines whose ELI could have increased.
2.3 IUE data
The IUE spectra have been retrieved from the INES (IUE Newly Extracted Spectra) final archive. For a detailed description of the IUE-INES system see Rodriguez-Pascual et al. (1999) and Gonzalez-Riestra et al. (2001).
For a new determination of the UV continuum (see section 3.2) we have used all available low resolution IUE spectra taken with the large aperture, with the exception of the very few spectra (e.g. SWP05836, SWP05885, SWP13730, SWP4603) that have shown saturation in the continuum or other problems in the exposure.
High resolution IUE-INES data have been used in section 4.5 for measuring the intensity in 1978-1995 of some Fowler lines ( 2733 and 3203) and some Bowen lines ( 2836, 3047, 3122, and 3133). The LWP and LWR spectra are those reported in Table 6, and have been individually checked for their quality. They are not or only mildly affected by saturation effects or by camera artifacts. A few IUE spectra that were over/under exposed or affected by factors such as bad guiding, high background noise, microphonic noise, etc. have been disregarded. The quality flags for the 3133 line generally indicate the presence of a fiducial mark near the spectrum, but this reseau is located outside of it. The quality flags indicates also the marginal presence of a few saturated pixels in the spectra with longer exposure time.
2.4 FEROS data
We made use of the FEROS commissioning data (Kaufer et al. 1999) which are available through the FEROS Spectroscopic Database at the LSW Heidelberg (http://www.lsw.uni-heidelberg.de/projects/instrumentation/Feros/ferosDB) to measure the lines near 4640 and 4100 (see section 6.2), which are not covered by the spectra of the other instruments. These 4 spectra were acquired on October 7th 1998, one has an exposure time of 300s, the other three of 600s. The standard extracted, flat-fielded, wavelength calibrated, and merged spectrum of both object and sky fibres have been downloaded from the database. The spectra cover the range 3520–9210 Å with a resolution . Also for FEROS, in a similar way as that for UVES, we have made use of the flux calibrated STIS spectra to re-calibrate the FEROS spectrum, in the range 4100-4700. We did so by forcing the continuum of FEROS to coincide with that of STIS in selected line-free windows. This has allowed us to measure reliable ELI and reliable line ratios for a few emission lines that are clearly observed in FEROS spectra but are not detected or are confused with noise in the STIS grating spectra. The same warnings and considerations given in section 2.2 are valid here. However, also in this case, the procedure is justified by the fact that the ELI measured in STIS and (re-calibrated) FEROS spectra give a nearly constant ( 0.02) ratio for the lines that are in common to the two spectra.
3 The reddening and the distance
3.1 The recombination lines
We have adopted and updated the method of Penston et al (1983) of comparing the observed intensities of the He II (n3) recombination lines with the corresponding theoretical ratios in order to obtain an estimate of the color excess EB-V. Incidentally we point out, that these (n3) transitions are often named as ”Paschen” lines in the astronomical literature, irrespective of their belonging to HI or , while the (n3) lines should be correctly named as ”Fowler” lines (as in Table 4.3 of Osterbrock and Ferland 2006) and hereinafter they will be named so.
The STIS data provide an optimum coverage for the whole set of the Fowler lines, from 4685.71 down to the region of the head of the series near 2063 (Fig.1).
| ELI | FWHM | Iobs/I4686 | Ith/I4686 | ratio | |
|---|---|---|---|---|---|
| 4685.71 | 147.50 | 56.2 | 100.0 | 100.0 | 1.00 |
| 3203.10 | 63.52 | 54.2 | 43.0 | 43.7 | 0.99 |
| 2733.30 | 32.33 | 56.1 | 21.9 | 23.1 | 0.95 |
| 2511.20 | 18.98 | 56.4 | 12.9 | 13.9 | 0.93 |
| 2385.40 | 12.60 | 57.3 | 8.54 | 9.03 | 0.95 |
| 2306.19 | 9.23 | 56.2 | 6.26 | 6.25 | 1.00 |
| 2252.69 | 6.25 | 56.1 | 4.24 | 4.52 | 0.94 |
| 2186.60 | 3.96 | 63.5 | 2.68 | 2.60 | 1.03 |
| 2165.25 | 2.81 | 51.4 | 1.91 | 2.01 | 0.95 |
| 2148.60 | 2.60 | 55.1 | 1.76 | 1.68 | 1.05 |
| 2133.35 | 1.98 | 55.1 | 1.34 | 1.40 | 0.96 |
| 2124.63 | 1.80 | 50.8 | 1.22 | 1.18 | 1.03 |
| 2115.82 | 1.51 | 48.2 | 1.02 | 1.02 | 1.00 |
| 2108.50 | 1.34 | 56.2 | 0.91 | 0.90 | 1.01 |
| 2102.35 | 1.17 | 52.8 | 0.79 | 0.79 | 1.00 |
| 2097.12 | 1.00 | 54.8 | 0.68 | 0.71 | 0.96 |
| 2092.64 | .94 | 55.9 | 0.64 | 0.64 | 1.00 |
| 2088.72 | .85 | 50.3 | 0.58 | 0.59 | 0.98 |
| 2085.41 | .80 | 52.5 | 0.54 | 0.55 | 0.98 |
| 2079.88 | .70 | 53.6 | 0.475 | 0.47 | 1.01 |
| 1640.42 | 831.10 | 63.2 | 563.4 | 702.1 | 0.81 |
The spectral region between 2025 and 2300 is quite interesting because it has remained ”unexplored” until recent times: all of the IUE spectra suffered from severe underexposure in this range because of the extremely low response of the LW cameras below 2300, and the HST-GHRS data cover only a short range in some selected spectral regions. In the STIS spectra, the very good spectral resolution allows one to resolve the lines up to the (373) transition at 2063.49, very near to the series limit (Fig. 1). We recall that in the UVES spectra the hydrogen Balmer lines were instead resolved up to the (382) transition (Selvelli and Bonifacio, 2000).

In a study of RR Tel from IUE data, HN86 from various diagnostic methods based on ratios of collisionally excited lines, have derived log Ne 6.0 and Te 12500 K. Adopting these values (we note, however, that the relative lines strengths in the recombination spectrum of have little dependence on electron temperature and density) we have compared our observed relative strengths of the various Fowler lines (normalized to I4686=100) with the theoretically derived ratios for ”case B” by Storey and Hummer (1995). The ”case B” assumption is justified by the presence itself of strong Bowen lines (that require large optical depth in the Ly- line, see in the following) and by the observed I3203/I4686 ratio 0.43, that is generally associated with ”case B” (see Schachter et al., 1991).
Table 2 gives the observed ELI (10-13erg cm-2 s-1) for all transition of the Fowler series starting from 4686 (43) up to 2079.88 (253), with the exception of the 2214.67 (113) and 2082.47 (243) lines that are blended. Table 2 gives also the gaussian FWHM in km s-1 (deconvolved from the instrumental FWHM), the observed and theoretical (for case B log Ne = 6.0 and Te = 12,500 K) intensities relative to I4686=100, and, in the last column, the ratio Iobs/I4686 over Ith/I4686. In the last line of Table 2 the corresponding values for the Ba- line at 1640 are also given. The average FWHM for 20 unblended lines of the Fowler series is = 53.5 3.5 km s-1. In Fig. 2 the Iobs/Ith ratio of Table 2 is plotted versus wavelength. The mean value of the points is 0.986, the median is 0.995, with standard deviation = 0.033. The points clearly define a straight line with slope very near 0.00, thus clearly indicating that E(B-V) 0.00.
We recall that Penston et al obtained E(B-V) = 0.10, but their measurements were based on just a few lines and in spectra that were very noisy below 2400.
In this context, it should be pointed out that under the nebular conditions as in the RR Tel nebula, the large optical depth in the Ly- line and its complex line transfer that is associated with the Bowen fluorescence (see Sect. 4) should not influence the Fowler lines, but could possibly affect the intensity of the Ba- (3-2) line at 1640. In fact, the low I1640 over I4686 observed ratio = 5.63 (instead of the theoretical one, close to 7.0, for log Ne = 6.0 and Te =12500) is an indication that the line has developed some optical depth as a consequence of the ”trapping” of the Ly- line 304 that causes level 2 to be overpopulated. Also the larger width of the 1640 line (63 km s-1 as compared to the 55 km s-1 as the average value for the remaining lines) is indicative of its larger optical depth.
We note that the low I1640 over I4686 observed ratio comes from the low intensity of the 1640 line and not by an excessive intensity of the 4686 line since the decrements of all of the Fowler lines relative to I4686 are very close to the expected values (e.g. the I3203/I4686 observed ratio is 0.43, to be compared to the theoretical ratio 0.44). It should be also mentioned that Netzer et al. (1985) in a study of Bowen fluorescence and lines in active galaxies and gaseous nebulae have considered the possibility of an increase in the population of n=4 of through hydrogen Ly- pumping from n=2 to n=4 of . This would result in an enhanced I4686 (43) over I1640 (32) ratio. However, this mechanism is not effective in RR Tel since, as mentioned, the intensity of the various Fowler lines relative to I4686 is very close to the expected one.
3.2 The STIS UV + optical continuua
Penston et al. (1983) confirmed the E(B-V) = 0.10 value obtained from the lines with the presence (although rather weak) of the common interstellar absorption bump near 2200 in the continuum of IUE low resolution spectra.
In order to check for the alleged presence of this absorption bump we have exploited the high spectral resolution of STIS in the UV region and plotted the STIS continuum intensity versus wavelength in line-free regions. Fig. 3 is self explanatory : the very flat near UV continuum distribution, and the intensity increase towards the far UV, is not consistent with what is generally observed in reddened objects. In Fig. 3 one can easily note the presence of the two bound-free discontinuities of and HI near 2060 and 3646 respectively with D(He II-Fowl)= log I2060+/I2060- 0.21 and D(HI-Ba) = log I3646+/I3646- 0.48.


In order to elucidate further the origin of the alleged IUE bump reported by Penston et al.(1983), we have coadded and merged all the IUE low resolution spectra available from the IUE VILSPA archive (large aperture only, not overexposed in the continuum) and created an ”average” spectrum out of 39 SW and 35 LW spectra (Fig 4). As result of the good S/N ratio also in the region below 2300, an inspection of the ”average” spectrum definitely shows that there is no evidence of the IS absorption bump centered near lambda 2175. The absorption dip reported by Penston et al (1983) comes probably from the ”lack” of strong emission features in the region near 2200 (that could have have had the effect of ”raising” the continuum in low resolution IUE spectra), and from the presence of the Fowler discontinuity. Also in the emission-line-free region near 2600 the effect is to mimic the presence of a similar (wide) absorption feature.
A comparison between the IUE continuum and the STIS continuum also confirms the near grey decline with time of the UV continuum.

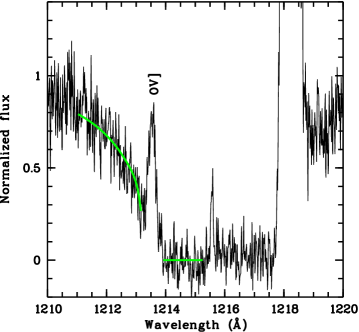
3.3 The NH column density towards RR Tel
From the profile of the damping wings of the IS Ly- absorption line (Fig. 5) one can obtain the column density of neutral hydrogen towards RR Tel. Only the blue wing can be used, since the red wing is affected by the rather strong ] emission line 1218.34. The blue wing itself is partially contaminated by the [] 1213.81 emission line. This adds further uncertainity to the derived column density. Our best-fit value, obtained by excluding the interval contaminated by ] 1213.80, is NH 6.9 1019 (atoms cm-2) with a probable relative error of 10%. Strictly speaking this NH value should be considered as an upper limit since a circumstellar contribution to NH cannot be ruled out. Jordan et al. (1994) have instead obtained a value for NH in the range 1.7-3.1 1020 from ROSAT PSPC observations. The mean relations between neutral hydrogen column density and dust by Diplas and Savage (1994) (NH=4.93 1021 E(B-V)) gives E(B-V)=0.014, in good agreement with our estimates.
The HEASARC NH tool (heasarc.gsfc.nasa.gov/cgi-bin/Tools/w3nh/w3nh.pl) in which NH is derived from the HI map by Dickey and Lockman (1990) indicates a total galactic column density NH in the direction of RR Tel very close to 4.5 1020 (atoms cm-2). It should be pointed out, however, that the NH tool gives the average value for 1 degree x 1 degree bins.
The valuable Web site ”Galactic Dust Extinction Service” (http://irsa.ipac.caltech.edu/applications/DUST/) employs the 100-micron intensity map of the sky by Schlegel et al (1998) to provide the foreground (Milky Way) extinction for a line of sight and/or region of the sky. This tool gives E(B-V)=0.05 as the total extinction in the line of sight of RR Tel. The spatial resolution of the map is higher than for NH (about 5 arcmin) but, as clearly stated in the cautionary notes, the various assumptions made in the conversion from the 100-micron dust column density to the color excess E(B-V) may affect the resulting E(B-V) value.
3.4 Comments on the reddening
The observations described in the previous sections have convincingly shown that E(B-V) 0.
We recall that previous E(B-V) values in the literature range from values as high as 0.7, estimated by Walker (1977) from the Balmer decrement, to values close to 0.08-0.10, (Penston et al., 1983, Feast et al (1983), Jordan et al., 1994 , Espey et al., 1996), down to values close to zero (Glass and Webster, 1973). The generally accepted E(B-V) values in the literature are in the range 0.08-0.10. Recently, Pereira et al. (1999), using ESO data with spectral resolution of Å (FWHM) have obtained E(B-V) = 0.04 from the relative ratios of Hγ/Hβ, Hδ/Hβ and 3203/4686. Very recently, Young et al. (2005) have derived E(B-V) 0.28 from a study of the lines, based on the same STIS and UVES spectra of RR Tel as this work. The authors have pointed out, however, that the extinction is not well constrained by the lines and have derived E(B-V) 0.11 from the comparison of the observed and the theoretical (Galavis et al., 1997) NeV I2974/I1574 line ratio.
We therefore emphasize that the E(B-V) value obtained in the present study with the method of the Fowler lines is based on data from 20 lines and is extremely well constrained, because of the wide wavelength coverage of the lines and because of the fact that most of them fall close to the region near 2200 , where the maximum of the extinction occurs. Moreover, if, as an exercise, the observed STIS continuum plotted in Fig. 3 were ”dereddened” assuming E(B-V)=0.10, the resulting continuum would show an artificial emission bump near 2000.
3.5 The distance to RR Tel
The photometric and spectral development of RR Tel during the OB phases was that of an extremely slow nova that was near maximum between the end of 1944, when the outburst occurred, until June 1949 (Friedjung, 1974, Heck and Manfroid 1985). It seems therefore reasonable to assume that the nova luminosity was near-Eddington during these decay phases. For a WD mass near 0.6 M⊙, as expected in an extremely slow nova (Livio, 1992), this assumption gives M -6.1, and assuming a bolometric correction BC -0.1 for an object with T 10000 K, we obtain M = -6.0, in good agreement with the estimates from the various relations (Della Valle and Livio 1995, Downes and Duerbeck 2000) between the absolute magnitude at maximum and the rate of decline (MMRD).
From the observed m=6.7 and our new value for the extinction (Av=0.0) a distance of 3.47 kpc is obtained.
This value is in good agreement with that of 3.6 kpc obtained by Feast et al (1983) on the assumption that a Mira is present in RR Tel. Whitelock (1988) has instead derived d 2.6 kpc by applying a period-brightness relation to the IR magnitudes and the pulsation period of the Mira in the system.
From our estimated distance (d = 3.47 kpc) and the total IS hydrogen column density derived from the Ly- damped profile (NH=6.9 atoms cm-2 ) one obtains that the average hydrogen number density N(H) (atoms cm-3) is 6.7 10-3. We recall that Diplas and Savage (1994) found limits of 0.017-8.62 for the hydrogen number density in the galactic ISM. Therefore, the intervening ISM towards RR Tel seems extremely poor in the content of dust and neutral hydrogen.
4 The Bowen lines
4.1 The Bowen fluorescence mechanism
In high-excitation planetary nebulae and symbiotic stars a significant fraction of the EUV - soft X-ray flux (at wavelengths shortward of the Lyman limit, h 54.4 eV) is absorbed by the nebula and converted into the Ly- 303.782 emission line that may then attain a high intensity. These 303.782 photons can ionize both H and He and therefore they have a strong influence on the ionization and temperature structure of the nebula.
Scattering of these Ly- resonance photons may result in one of the following processes (See Aller 1984, Osterbrock and Ferland 2006): 1) escape from the nebula by diffusion in the wings, 2) photoionization of Heo and H, 3) absorption by : in a near coincidence in wavelength with the 303.800 resonance transition of the Ly- 303.782 photons may excite its 2p3d level at 40.85 eV (O1 process).
The most likely radiative process from the excited 2p3d level of (total probability about 0.98=0.74+0.24) is that of resonant scattering, by emission of one of the two resonance lines at lambda 303.800 (2p3d - 2p2 ) (O1 line) and lambda 303.622 (2p3d - 2p2 ) (O2 line).
A less probable decay process from the aforesaid 2p3d level (total probability about 1.85 ) is the cascade through the high lying 2p3p (E 37.23 eV), 2p3p (E 36.89 eV) and 2p3p (E 36.45 eV) terms, by emission of one of six subordinate lines (the primary cascade-decays) in the near-UV optical region of the spectrum (from 2807.90 to 3444.06). However, despite the low probability of the decay channel through the subordinate lines, if the optical depth in the Ly- line is very high the trapped Ly- photons are repeatedly scattered and a significant fraction of them can be converted into the fluorescent cascade of optical and ultraviolet lines. Unlike the resonance and near resonance lines that are scattered many times, the photons produced by these subordinate transitions can easily escape from the nebula, and, together with the subsequent cascades (the ”secondary” decays), that produce additional emission lines, (most of them in the optical U spectral range), comprise the Bowen fluorescence lines (Bowen, 1934).
Fig. 6 represents a partial Grotrian diagram of that includes the most common Bowen O1 transitions. Fig. 6 is complemented by Table 3 that includes the configuration and the energy (eV and cm-1) of the relevant levels.

| Level | E(eV) | E(cm |
|---|---|---|
| 2p3d | 40.87 | 329645.14 |
| 2p3d | 40.86 | 329583.89 |
| 2p3d | 40.85 | 329469.80 |
| 2p3p | 37.25 | 300442.55 |
| 2p3p | 37.23 | 300311.96 |
| 2p3p | 37.22 | 300239.93 |
| 2p3p | 36.89 | 297558.66 |
| 2p3p | 36.48 | 294223.07 |
| 2p3p | 36.45 | 294002.86 |
| 2p3p | 36.43 | 293866.49 |
| 2 | 35.21 | 283977.4 |
| 2 | 35.18 | 283759.7 |
| 2p3s | 33.18 | 267634.00 |
| 2p3s | 33.15 | 267377.11 |
| 2p3s | 33.14 | 267258.71 |
| 2s2p3 | 24.44 | 197087.7 |
| 2s2p3 | 17.65 | 142393.5 |
| 2s2p3 | 14.88 | 120058.2 |
| 2s2p3 | 14.88 | 120053.4 |
| 2s2p3 | 14.88 | 120025.2 |
| 2p2 | 0.04 | 306.17 |
| 2p2 | 0.01 | 113.18 |
| 2p2 | 0.00 | 0.00 |
In most planetary nebulae and symbiotic stars, the ”efficiency” of the Bowen mechanism, that is the fraction of Ly- photons that is converted into Bowen lines (mostly a function of the Ly- optical depth) varies from object to object and covers almost the whole range of possible values (Liu and Danziger 1993, Pereira et al., 1999). Therefore, the Bowen mechanism can have a major influence on the fate of the Ly- photons and consequently also on the photoionization equilibrium in the nebula. Thus, a clear understanding of the Bowen mechanism is required for a correct interpretation of the emergent UV and optical spectrum.
If the width of the Ly- line is large enough, an additional fluorescence process might also be present i.e. the excitation of the (2p3d) level (v= -82 km/s from 303.782) due to the partial overlap of the exciting Ly- with the 303.695 resonance line of (O3 process). In addition, if Ly- is even wider, then excitation of the level by pumping in the resonance line at 303.461 could also take place. This is a quite uncommon process, since this line is at -250 km/s with respect to Ly-. Thus, these two secondary Bowen fluorescence processes provide a convenient probe which measures the intensity of radiation in the far wings of the unobserved Ly- line and gives valuable information on its width. It is worth recalling that Bhatia et al. (1982) in a study of the solar spectrum have pointed out the fact that the Ly- line is considerably broader than the lines.
It is important to note that while the lines in the primary cascade from each level are individual, (e.g. 3132.79 from (O1), 3121.64 from (O3), 3115.68 from ) most of the lines in the subsequent cascades are common to the three processes, although the dominant contribution comes from the O1 process.
We recall that a competitive charge-exchange mechanism (CE) functions for some of the lines produced in the decay from the term (Dalgarno and Sternberg, 1982) , while the 5592.25 line (3s -3p , mult. 5) comes from charge-exchange only (see Liu and Danziger 1993 and Kastner and Bhatia 1996, hereinafter KB96 for details).
An accurate determination of the intensities of the pure Bowen lines is fundamental for determining the relative contribution by the various channels previously mentioned. KB96 have pointed out that a complete Bowen system has not yet been observed because of inadequate coverage in wavelength, lack of adequate spectral resolution, lack of accurate ELI, and lack of overlap between the data of various observers. Also, the lack of sufficiently accurate intensities for the weak CE line at 5592.25, and for the primary cascade line of the O3 process at 3121.64 is particularly relevant, according to KB96.
4.2 The Bowen lines intensities in RR Tel
In our UVES data (spectral resolution 0.05 Å FWHM) we have detected and measured all of the fluorescent lines (O1 and O3 processes) that are present in the range 3047-3811, with the sole exception of the two lines at 3759.87 and at 3810.96 that are blended with stronger lines of [] 3758.92 and (1) 3811.35, respectively. The remaining lines are unblended except for the 3405.71 line which is partially affected by the presence of the 3405.78 (3) line.
Figures 7 and 8 are self-explanatory and illustrate the exceptional quality of the STIS-NUV-MAMA and UVES spectral data that have allowed the detection and measurement of the pure lines produced in the various Bowen excitation processes, including the very weak 3115.68 line that is associated with the excitation of the level by the 303.461 line.


The STIS data are complementary to the UVES data shortward of 3047 (see also Fig. 9) and include all of the Bowen lines present in this range, although the two lines at 2807.90 and 2798.90 are very weak. In the spectral range that is common with UVES (longward of 3046) the STIS data include most of the Bowen lines detected by UVES except the weakest ones that have not been detected because of lower spectral resolution and S/N in the STIS optical data compared with that of UVES.
The merging of the STIS and UVES data (as mentioned in Sect. 2) has thus provided a high quality coverage of ELI for almost all of the Bowen lines in the range 2798-3810.
Table 4 gives the observed STIS and UVES ELI (10-13 erg cm-2 s-1) and their ratios with respect to the reference line 3444.06. The wavelengths and the radiative rates Aij are from KB96, that adopted the IC rates of Froese Fisher (1994). It should be noted that these values differ by about 10 , with nearly constant ratio, from those listed in the NIST Web site, whose accuracy is in the range C ( 25 ) - C+ ( 18 ). Therefore, the level branching ratios are nearly the same, and the detailed discussion of the decays (see also Section 4.6) is not affected. We note, incidentally, that the 2808.77 line in KB96 should be correctly reported as 2807.90. In this list we have also included for comparison the CE process line at 5592.25, the hydrogen Hβ line 4861, and the Ba- 1640, Pa- 3203 and Pa- 4685.71 lines. The FWHM values (deconvolved from the instrumental FWHM) are from STIS in the UV region (shortward of 3044 ) and from UVES in the optical region, with the only exception of the FWHM of 4686 that is from STIS. The last column of Table 4 gives the number of photons in the line, obtained from the observed ELI after proper conversion.
| Transition | Aij | FWHM | STIS | UVES | STISr | UVESr | Nν | |
|---|---|---|---|---|---|---|---|---|
| 2187.02 | 3d -2 | 7.19+5 | (41.3) | 0.40 | - | 1.24 | - | 4.41 |
| 2197.48 | 3d -2 | 2.36+5 | (40.5) | 0.21 | - | 0.65 | - | 2.32 |
| 2798.90 | 3d -3p | 3.14+6 | - | (0.05) | - | (0.15) | - | (0.70) |
| 2807.90 | 3d -3p | 1.79+5 | - | (0.03) | - | (0.1) | - | (0.42) |
| 2809.66 | 3d -3p | 1.41+7 | (39.3) | 0.65 | - | 2.02 | - | 9.21 |
| 2818.66 | 3d -3p | 1.57+6 | 33.0 | 1.12 | - | 3.48 | - | 14.47 |
| 2836.28 | 3d -3p | 1.64+7 | 35.7 | 12.20 | - | 37.89 | - | 174.19 |
| 3023.45 | 3p -3s | 5.17+7 | 37.1 | 2.37 | - | 7.36 | - | 36.07 |
| 3024.57 | 3p -3s | 6.73+7 | (43.5) | 1.71 | - | 5.31 | - | 26.04 |
| 3035.43 | 23p -3s | 5.06+7 | 34.1 | 0.87 | - | 2.70 | - | 13.29 |
| 3043.02 | 3p -3s | 2.14+8 | 28.6 | 0.37 | - | 1.15 | - | 5.66 |
| 3047.13 | 3p -3s | 1.63+8 | 34.8 | 15.30 | 13.91 | 47.52 | 49.86 | 234.70 |
| 3059.30 | 3p -3s | 9.46+7 | 34.5 | 1.74 | 1.44 | 5.40 | 5.16 | 26.80 |
| 3115.68 | 3d -3p | 1.41+8 | 36.4 | - | (0.11) | - | (0.39) | (2.04) |
| 3121.64 | 3d -3p | 1.44+8 | 27.9 | 3.67 | 3.25 | 11.40 | 11.63 | 57.65 |
| 3132.79 | 3d -3p | 1.52+8 | 34.6 | 102.4 | 86.9 | 318.0 | 311.5 | 1615.1 |
| 3299.36 | 3p -3s | 1.79+7 | 34.2 | 4.32 | 3.66 | 13.42 | 13.12 | 71.76 |
| 3312.30 | 3p -3s | 4.97+7 | 34.1 | 11.40 | 9.50 | 35.40 | 34.05 | 190.01 |
| 3340.74 | 3p -3s | 6.84+7 | 34.1 | 15.10 | 12.85 | 46.89 | 46.09 | 253.90 |
| 3405.71 | 3d -3p | 1.78+7 | 28.9 | - | 0.40 | - | 1.43 | 8.23 |
| 3408.12 | 3d -3p | 7.27+7 | 25.3 | - | (0.04) | - | (0.14) | (0.85) |
| 3415.26 | 3d -3p | 2.31+7 | 27.8 | - | 0.49 | - | 1.76 | 10.31 |
| 3428.62 | 3d -3p | 7.98+6 | 38.2 | 4.74 | 3.78 | 14.72 | 13.55 | 81.79 |
| 3430.57 | 3d -3p | 2.78+7 | 26.7 | (0.60) | 0.55 | (1.86) | 1.97 | 10.38 |
| 3444.06 | 3d -3p | 5.21+7 | 34.9 | 32.20 | 27.90 | 100.0 | 100.0 | 558.25 |
| 3754.67 | 3p -3s | 8.67+7 | 31.8 | (0.77) | 1.05 | (2.39) | 3.76 | 14.55 |
| 3757.21 | 3p -3s | 6.42+7 | 33.5 | (0.25) | 0.24 | (0.78) | 0.86 | 4.73 |
| 3759.87 | 3p -3s | 1.13+8 | - | bl | bl | bl | bl | - |
| 3774.00 | 3p -3s | 4.55+7 | 30.7 | (0.28) | 0.22 | (0.87) | 0.79 | 5.23 |
| 3791.26 | 3p -3s | 2.61+7 | 35.4 | - | 0.30 | - | 1.08 | 6.87 |
| 3810.96 | 3p -3s | 2.79+6 | - | - | - | - | - | - |
| 5592.25 | 3s -3p | - | 37.3 | - | 0.12 | - | 0.44 | 4.05 |
| -3203 | 3-5 | - | 54.2 | 63.5 | 54.65 | 197.2 | 195.9 | 1023.9 |
| -4686 | 3-4 | - | 56.2 | 147.5 | - | 458.0 | - | 3477.9 |
| -1640 | 2-3 | - | 63.2 | 831.0 | - | 2580.7 | - | 6860.4 |
| HI-4861 | 2-4 | - | 60.0 | 162.0 | - | 503.1 | - | 3964.7 |
As mentioned in section 2.2, the intensity ratios for the lines that are common to the two sets of measurements are in good agreement with mean value = 1.16 and variation coefficient = 2.9 . The consistency between the two sets of data lend support to the re-calibration method adopted for UVES and to the overall correctness of the method.
It should be pointed out that in an earlier short study based only on UVES data (Selvelli & Bonifacio 2001) the values for the relative emission intensities were slightly different since the UVES calibration was based on standard ground-based reduction method, and the correction for the color excess was assumed to be (E(B-V)=0.10. However, only for the 5592.25 line is the difference with the previous measurements significant.
The I3133/I3444 ratio in STIS data is = 3.18, and, consistently = 3.11 in UVES data. The same ratio was reported as = 3.39 by Pereira et al (1999), in a study of Bowen fluorescence lines for a group of symbiotic stars, including RR Tel using ESO data with spectral resolution of Å (FWHM). As mentioned in section 3.4 they have adopted E(B-V)=0.04.
In conclusion, we have obtained high quality data for about thirty lines of the Bowen fluorescence process, including six pure O1 lines ( 2807.90, 2818.66, 2836.28, 3132.79, 3428.62 and 3759.87), seven pure O3 lines ( 2798.90, 2809.66, 3043.02, 3121.64, 3405.71, 3415.26, and 3430.57) and the two pure very weak lines at 3115.68 and 3408.12 that come from the pumping of level 2p3d (40.87 eV) which requires a very wide Ly- line (this process is called ”other” in KB96). It is worth recalling (see also KB96) that these two lines were reported (but not measured) in the comprehensive paper on RR Tel by Thackeray (1977). The 3115.68 line was correctly identified as , while the 3408.12 line was tentatively identified as a CrII line.

4.3 The Bowen lines width and profile
The data for the FWHM for the Bowen lines reported in Table 4 (obtained from the high resolution spectra of STIS and UVES) give an average FWHM value of 34.30 1.90 km s-1 for the O1 + mixed (O1+O3) lines, while the average FWHM for the five best observed pure O3 lines is = 27.98 0.85 km s-1. The difference is significant with a ratio FWHM(O1)/FWHM(O3) 1.22.
It is also remarkable that in UVES spectra all the best observed Bowen lines (i.e. 3133, 3121, 3299, 3312, 3340, 3444, etc.) show a definite asymmetry (excess) in the red wing (see Fig. 10). The red ”excess” (after subtraction of the main gaussian component of about 34.3 km s-1 FWHM) can be modeled by a gaussian profile centered at about +38 km s-1 from the main component and with FWHM of about 22 km s-1. There is however still an ”excess” left and the velocity profile in the ”red” wing can reach a maximum velocity of 100 km s-1. Alternatively, the entire profile can be also (and better) fitted with a gaussian main component with FWHM 31 km s-1m, while the red ”excess” is represented by a Voigt profile with FWHM 25 km s-1 in the Gaussian core and 17 km s-1 in the Lorentzian wing.

A similar but less enhanced behavior is shown by the lines at 5875, and 6678, while the two [] lines at 6300 and 6363 show two almost resolved components with separation of 27 km s-1 and FWHM of 13 km s-1 and 28 km s-1 respectively.
Surprisingly, the nebular [] lines at 4958 and 5007 show instead an excess in the blue wing with a maximum velocity of about -150 km s-1, while other strong emission lines observed with UVES e.g.: 3203, [] 3426, [] 3586 , H- 4861, [] 4893, [] 4939, [] 5176, 5411, [] 5618, [] 5721, [] 6086, [] 6434, and [] 6455 show an almost pure Gaussian profile.
We recall that Crawford (1999) reported the presence of a two component structure in the [] 4363 line and of a multi-component structure in the [] 4959 and 5007 lines. Schild and Schmid (1996) also observed this behavior and attributed it to the presence of two nebular components of different densities.
In the far UV and near UV echelle spectra of STIS (taken 1 year after the UVES spectra) whose resolution is comparable to that of UVES, a red wing excess similar to that present in 3132.79 is present in all of the common intercombination lines , e.g. ] 1218, ] 1404, ] 1486, ] 1660 and 1666, ] 1750, ] 1892 and ] 1906. It is instead absent in the lines of permitted transitions, i.e. in the three resonance doublets of ( 1238, 1242), SiIV (1293, 1403), and ( 1548, 1550) and in the Ba- recombination line 1640, all of which display a nearly pure Gaussian profile
The asymmetry is not evident in the STIS optical [] lines possibly because of the lower spectral resolution of STIS in the optical range. In FEROS spectra, in the range outside that covered by UVES, there is evidence of excess in the [] 4363 nebular line (as mentioned by Crawford, 1999), and in the 8446 line produced by the Ly- fluorescence. No excess is evident in Hγ 4340, and in 4686.
4.4 The relative Bowen line intensities and the efficiency of the O1 and O3 processes
The high quality of the data has allowed a detailed comparison of the observed ratios for pairs of lines from a common upper level to the corresponding branching ratios obtained from the transition rates given by Bhatia and Kastner (1993) (BK), Froese Fischer (1984) (FF), and Saraph and Seaton (1980) (SS).
Following Pereira et al (1999) we present in Table 5 a comparison between the observed and the predicted ratios for some selected lines. It is clear from Table 5 that the best agreement in the overall ratios is with the Froese Fisher (1994) model. This strongly supports the intermediate coupling radiative rates calculated by FF.
| line ratios | STIS | UVES | BK | FF | SS |
|---|---|---|---|---|---|
| 2819/3444 | 0.035 | - | 0.033 | 0.037 | - |
| 2836/3444 | 0.38 | - | 0.43 | 0.38 | - |
| 3133/3444 | 3.18 | 3.12 | 4.06 | 3.21 | 3.61 |
| 3429/3444 | 0.15 | 0.14 | 0.18 | 0.15 | 0.34 |
| 3406/3415 | - | 0.81 | 0.75 | 0.78 | - |
| 3415/3122 | - | 0.15 | 0.09 | 0.15 | - |
| 3299/3341 | 0.29 | 0.28 | 0.23 | 0.26 | 0.20 |
| 3299/3312 | 0.38 | 0.38 | 0.35 | 0.36 | 0.34 |
| 3791/3755 | - | 0.29 | 0.31 | 0.30 | 0.33 |
The efficiency of the Bowen fluorescence mechanism is quantified by the fraction of the created Ly- photons ( 303.782) that are converted into Bowen line photons. If the atomic transition probabilities are known, the intensity of any line can be related to the intensity of the Ly- line (and to the number of Ly alpha photons) and the intensity of any Bowen line can be related to the total intensity of the Bowen lines (and total number of Bowen photons). In this case, the efficiency can be easily calculated if the (relative) intensities of a single Bowen line (usually 3133 or 3444) and a single line (usually 4686, or 3203) are available. The efficiency factor R can be defined as:
where and are the effective recombination coefficients for recaptures that result in the production of 304 and 4686 respectively, P is the cascade probability = 0.0187, and Pλ is the probability for the emission of a particular Bowen line following the excitation of 2p3d (O1) (Aller, 1984). The ratio of the two is 0.328 for Te=10,000 K.
The application to specific lines provides simple relations that can be directly used, i.e. R1.0 I3444/I4686 (Kaler 1967, Harrington 1972), R=0.12 I3133/I3203 (Schachter et al. 1990), R=0.32 I3133/I4686 (Saraph and Seaton 1980) R=0.43 I3444/I3203 (Wallerstein, 1991). In the specific case of RR Tel these relations give R = 0.22, 0.21, 0.22, and 0.22, respectively, in encouraging agreement.
Similar relations can be obtained for the efficiency of the O3 channel. Shachter et al. (1991) give
and for the specific case of RR Tel one obtains that the relative RO3/RO1 efficiency is 0.038 (a value that is much lower than that, 0.3, found by Shachter et al., 1991 for AM Her). Therefore, the efficiency of the O3 channel in RR Tel is close to 0.7 .
In RR Tel we have obtained the intensities of all the Bowen lines belonging to the primary cascade. This fortunate situation allows a direct counting of the number of Bowen photons observed in the 6 lines of the primary O1 channel (the 2808.77 line is not detected) and therefore a more direct estimate of the efficiency. The total intensity in the 6 lines of the primary O1 decay from level 2p3d (O1) is of 152.7 10-13 erg cm-2s-1 (from STIS data). This value, after proper conversion from energy to number of photons, corresponds to a total number of photons (decays) in the O1 primary cascade of approximately 2.45 photons cm-2 s-1 (see also Table 4).
The Ly- intensity can be estimated from the observed 4686 line intensity ( 147.5 10-13 erg cm-2 s-1) assuming a ratio I304/I4686 65 (Storey and Hummer, 1995). The corresponding number of Ly- photons is about 15.36 cm-2 s-1. Thus, the efficiency for the O1 channel R(O1) is close to 16.0 , with some uncertainty associated with the actual value of the Ly- intensity.
We recall that the excitation of the 2p3d level of (the O3 channel) requires a velocity shift of -88.2 km/s from the rest wavelength of the Ly- line, while the excitation of the 2p3d level (that produces the two very weak but observed lines at 3115 and 3408) requires a corresponding velocity shift of -250 km/s. This clearly indicates that the 303.782 Ly- line must be broad enough to excite these levels of .
As reported in Sect. 3.1, the average FWHM for 20 unblended lines of the Fowler series is = 53.5 3.5 km s-1 . while the Ba- line 1640 has FWHM = 63.2 km s-1. These values are about ten times larger than the thermal velocities that are on the order of about 6.4 km s-1.
It is clear from these values that the Ly- line is much broader than the recombination lines, probably a consequence of multiple resonant scatterings.
4.5 The past efficiency of the Bowen fluorescence process
In most IUE LW high resolution spectra of RR it is possible to obtain good measurements for the Fowler lines at 2733 and 3203 and for the lines at 2836, 3047 and 3133 (O1 process) and the line at 3122 (O3 process). Since the IUE spectra cover about 17 years in the life of RR Tel one can thus follow the changes with time in the absolute and relative intensities of the and lines and estimate the corresponding changes in the Bowen efficiency. Table 6 gives the time variation from 1978 to 1995 for these lines, as obtained from measurements on more than 30 IUE spectra, together with the data for Oct. 10,2000 from STIS (last line).
| IUE image | MJD | 2733 | 2836 | 3047 | 3122 | 3133 | 3203 |
|---|---|---|---|---|---|---|---|
| LWR02021 | 43728 | 695 | 684 | 633 | 330 | 4610 | 1520 |
| LWR02995 | 43833 | 700 | 520 | 742 | 273 | 4345 | 1398 |
| LWR03888 | 43932 | 762 | 594 | 627 | 255 | 3965 | 1133 |
| LWR07536 | 44329 | 593 | 398 | 619 | 255 | 3715 | 1091 |
| LWR07663 | 44363 | 667 | 526 | 603 | 254 | 4239 | 1157 |
| LWR08234 | 44433 | 698 | 518 | 639 | 282 | 4203 | 1213 |
| LWR08272 | 44437 | 681 | 562 | 631 | 247 | 3987 | 1370 |
| LWR09238 | 44548 | 650 | 454 | 635 | 210 | 3802 | 1029 |
| LWR10364 | 44710 | 570 | 508 | 479 | 210 | 3553 | 1032 |
| LWR11293 | 44827 | 669 | 480 | 605 | 162 | 4268 | 1187 |
| LWR11296 | 44827 | 687 | 436 | 618 | 238 | 4348 | 1141 |
| LWR11744 | 44887 | 672 | 495 | 629 | 196 | 3147 | 1140 |
| LWR14466 | 45265 | 632 | 486 | 610 | 181 | 3792 | 1432 |
| LWP01664 | 45229 | 668 | 473 | 537 | 172 | 3963 | 1167 |
| LWR16181 | 45503 | 564 | 411 | 471 | 181 | 3464 | 1003 |
| LWP03001 | 45780 | 619 | 475 | 460 | 173 | 3753 | 1051 |
| LWP08178 | 46561 | 629 | 419 | 429 | 170 | 3313 | 1088 |
| LWP08180 | 46562 | 578 | 459 | 460 | 155 | 2876 | 1074 |
| LWP08728 | 46635 | 602 | 378 | 425 | 128 | 2940 | 1136 |
| LWP08729 | 46636 | 575 | 379 | 408 | 141 | 3260 | 1156 |
| LWP10919 | 46951 | 617 | 391 | 409 | 131 | 2990 | 1118 |
| LPW13770 | 47374 | 566 | 329 | 326 | 95 | 2197 | 1042 |
| LWP20538 | 48414 | 541 | 343 | 293 | 86 | 2110 | 1107 |
| LWP23569 | 48826 | 483 | 276 | 301 | 88 | 2022 | 1100 |
| LWP24278 | 48932 | 567 | 268 | 319 | 85 | 1970 | 835 |
| LWP25953 | 49188 | 606 | 284 | 354 | 81 | 2078 | 1055 |
| LWP25954 | 49188 | 598 | 288 | 335 | 106 | 2225 | 916 |
| LWP28078 | 49479 | 583 | 298 | 334 | 84 | 2238 | 1030 |
| LWP29189 | 49611 | 586 | 273 | 297 | 96 | 2030 | 939 |
| LWP30848 | 49872 | 561 | 320 | 290 | 90 | 1964 | 1030 |
| LWP30849 | 49872 | 516 | 229 | 286 | 72 | 1884 | 874 |
| LWP31348 | 49953 | 548 | 278 | 241 | 59 | 1767 | 979 |
| STIS | 51827 | 323 | 122 | 155 | 37 | 1024 | 635 |
As already mentioned in Sect. 2.3, the data in Table 6 all come from a choice of good quality spectra. The data clearly show that starting from the first spectra secured in August 1978 until the last spectra of August 1995 there has been a steady decrease with time in all ELI.
The data have been fitted with both linear and power-law regression. The behavior with time of the two lines, that of the three O1 lines and that of the O3 line is described by different power-law indices ( -0.33, -0.97, and -1.48, respectively) but within each line group the indices are similar. Figure 11 is a log-log plot of the data with their power-law fittings (straight lines) for the 6 spectral lines listed in Table 6.

On average, with the power-law fit, the intensity of the lines ( 2733 and 3203) has decreased by a factor about 1.5 from 1978 to 2000. Instead, the intensity of the O1 lines ( 2836, 3047 and 3132) has decreased on the average by a factor larger than 3, and the O3 line ( 3122) has decreased by a factor larger than 5.
Therefore, the efficiency in the O1 channel (as determined by the I3133/I3203 ratio) from the power-law fitting was about 2.1 times higher in the early IUE years (1978-1980) and has decreased from a value near 0.5 in 1978-1980 to a value close to 0.2 in year 2000 ( STIS ). Similarly, the data indicate that the O3 efficiency has decreased more rapidly with time than the O1 efficiency and that in 1978-1980 the relative O3 over O1 efficiency was about two times higher than in 2000.
The O3 line is at -88.2 km/s from the Ly- line. The higher relative efficiency O3/O1 in the past can be explained by a larger width in the Ly- line, resulting from either a larger turbulence or larger optical depth effects in epochs closer to the outburst time. We attribute the decrease with time in the ELI to the general decrease in the luminosity of the central source (Murset and Nussbaumer, 1993). The corresponding stronger decline in the Bowen lines indicates a gradual decrease in the Bowen efficiency (in particular for the O3 lines). This might be caused by a decrease in the width of the Ly- profile together with a decrease in the optical depth of the resonance lines.
4.6 A detailed examination of the Bowen decays
In this section all of the transitions that enter and exit each energy level involved in the Bowen O1 fluorescence process are examined in detail in order to verify the balance in the number of photons (see Fig.6, Table 3, and Table 4). The lists of lines that enter or exit the relevant levels and their Aij values have been obtained with the help of the extensive compilation of levels and transitions by van Hoof in the ”The Atomic Line List 2.05” (http://www.pa.uky.edu/peter/newpage).
-
1.
The 2p3d level (40.85 eV, 329469.80 cm-1), is pumped directly by the Ly- 303.782 line. The list of all primary decays from this level includes, (besides the two resonance lines 303.800 and 303.622) the 6 lines at 2807.90, 2818.66, 2836.28, 3132.79, 3428.62, and 3444.06, and two additional lines (with rather low Aij values) at (air) 2187.02 (I=0.40 10-13 erg cm-2 s-1 ) and at (air) 2197.48 (I=0.21 10-13 erg cm-2 s-1) that correspond to decays from 2p3d down to 2 and 2 at 35.18 and 35.21 eV, respectively. These two lines, albeit weak, have been detected in STIS spectra. The 2187.70 line falls in the wing of the Fowler line 2187.28 but is clearly present, while the other line at 2198.17 is weak but unblended (Fig 12). To the best of our knowledge they have never been reported so far in any astronomical source.
For lines that come from the same upper level k, the relative photon numbers are proportional to the respective Ajk. From the data in Table 4 we note that the observed photon number for the six lines of the primary decay (see also Fig. 6) are in good agreement with the the Ajk transition rates .

Figure 12: Two ”new” Bowen lines from the primary decay (40.85 eV). The 2187.02 line falls on the wings of the Fowler line 2186.60, while the 2197.48 line is weak but unblended. All wavelengths are in air. -
2.
The 2p3p (300442.55 cm-1, 37.25 eV) and the 2p3p (300311.96 cm-1, 37.23 eV) levels are populated by the 3444.06 and the 3428.62 decays, respectively (from 2p3d ).
Decays from these two levels include the five observed lines at 3023.45, 3047.13, 3024.57, 3035.43, and 3059.30 (total Aij = 3.99 108) and five EUV lines with lower term 2s 2p3 3D near 554.5 (total Aij = 2.36 108), plus other weaker decays.
From the relative Aij values one would expect that the contribution by the EUV lines should be about 0.67 of that of the observed near-UV lines (in the number of decays). The total number of decays in the two parent lines ( 3428.62 and 3444.06) is = 640.0 10-3 s-1 (Table 4). The same quantity for the five subsequent lines at 3047.13, 3023.45, 3059.30, 3035.43, 3024.57 amounts to 337.1 10-3 cm-2 s-1. Therefore there is an apparent (moderate - about 12 ) deficiency of decays in these five observed transitions, if the Aij values are accurate.
Inspection of the other possible transitions listed in the ”Atomic Line list 2.05” shows that, besides some forbidden transitions, there are two additional decays from 2p3p and 2p3p down to 2s2p3 (197087.70 cm-1, 24.44 eV), via 968.76 , and 967.54 respectively (mult. UV 17.05 ), whose Aij values are close to 1.24e+06, that is, about 1 of those of the five lines above. These lines are also reported in Table 7 of Saraph and Seaton (1980). However, inspection of BEFS spectra taken in Nov. 1996 has not led to their detection.
-
3.
The 2p3p level (297558.66 cm-1, 36.89 eV).
This level is important because it is fed by 3132.79, the strongest primary line in the decay from 2p3d (the O1 process). It is fed also by 3121.64, the strongest primary line in the decay from 2p3d (O3 process) and by 3115.68, the strongest decay from 2p3d, but the contribution from this latter line is almost negligible.
From the data of Table 4 we note that there is a severe unbalance between the total number of photons in the 3132.79 and 3121.64 lines (= 1674.0 10-3 cm-2 s-1) and the corresponding quantity (= 515.7 10-3 cm-2 s-1) for the three observed subsequent decay transitions at 3340.74, 3312.30, and 3299.36.
Inspection of ”The Atomic Lines List 2.05” and of the relevant radiative rates (Aij) shows that additional decays from 2p3p that could contain the missing photons pass through 2s2p3 (J=0,1,2) (142381.0, 142381.8, and 142393.5 cm-1, 17.65 eV) with three lines that fall close to 644.44 (mult. UV 16.20). The sum of the Aij values of these 644.44 lines is larger by a factor 2.5 relative to that of the three optical lines. In other words, about 71 of the decay photons go into the three lines near 644, thus reconciling the inbalance in the number of decays. The expected intensity of the 644 lines with respect to that ( 31.0 10-13 erg cm-2 s-1) of the three lines near 3320 ( 3340.74, 3312.30, and 3299.36) should be larger by a factor 12.9 (the relative Aij ratio 2.5 multplied by the factor 3320/644). Therefore, the 644 lines should have a total intensity of 400 10-13 erg cm-2 s-1 and constitute an important EUV contributor to the Bowen decays. The 644 lines were reported in the spectrum of the Sun obtained by Behring (1976) in the study by Bhatia et al. (1982) and in the Skylab spectrum of the Sun obtained by Vernazza and Reeves (1978). Their observed intensities were found by Bhatia et al. (1982) to be in excellent agreement with those obtained in a detailed calculation of the EUV spectrum of the quiet Sun, when the process of photoexcitation by Ly- was included.
Moore’s tables (1993) report also a transition (mult. UV 17.04) from 2p3p (297558.66 cm-1, 36.89 eV) to 2s 2p3 (197087.7 cm-1, 24.44 eV) that corresponds to the 995.31 line. This transition between two S levels violates the pure LS coupling selection rules and the line intensity should be very weak. However, it is worth reporting the presence on BEFS spectra of a medium-weak line at 995.3 (I 1.9 10-13 erg cm-2 s-1) that lacks any other reliable identification. It is worth noting that the Froese Fisher atomic model for supports intermediate coupling versus pure LS coupling. We thank the referee for pointing out the possibility that the 2p3p level be mixed with level 2p3p. This interaction between states of different L is an indication of departure from pure LS coupling.
-
4.
The three 2p3p levels (294223.07 cm-1, 36.48 eV, 294002.86 cm-1 36.45 eV, and 293866.49 cm-1 36.43 eV) are fed by three decays from 2p3d (329469.80 cm-1, 40.85 eV) at 2836.28, 2818.66 and 2807.90 respectively, and produce six rather weak lines that fall between 3754 and 3810.
The decay from 2p3p (294223.07 cm-1) produces the 3759.87 line, the only secondary line that is a ”pure” O1 line. Unfortunately the line falls in a blend with the strong and wide [] line 3759. This prevents a detailed analysis. Additional decays (with slightly weaker Aij) from this level are possible through the EUV lines at 658.58 and 574.06.
The observed decays from the 2p3p level (294002.86 cm-1) produce the two weak lines at 3754.67 and 3791.26. The sum of the number of photons in these two lines (= 21.4 10-3 cm-2 s-1 ) is close to that (= 18.5 10-3 cm-2 s-1) in the parent line 2818.66.
However, from ”The Atomic Line List 2.05” one can see that there are competitive decays from 2p3p with similar Aij in the EUV region at 574.8, and 659.5. Therefore, either the 3754.67 and 3791.26 lines are slightly blended or the 2p3p level is partially populated by the charge-exchange (CE) mechanism, as reported in the following lines.
The decays from level 2p3p (36.43 eV, 293866.49 cm-1) produce the three lines at 3757.21, 3774.00, and 3810.96. This level is the lower level of the 2807.90 line. It is worth noting that the 2807.90 line is barely detectable (Nν = 0.4 10-3 cm-2 s-1 ) in the STIS near UV spectrum that has high resolution (see Fig. 7); instead, two of the subsequent decay lines, i.e. 3757.21 and 3774.40, are present both in STIS and UVES spectra (N = 9.96 10-3 cm-2 s-1 ) while the third one at 3810.96 falls in a blend. This suggests that the 2p3p level is mainly populated by charge-exchange, as reported in Aller (1984) and Dalgarno and Sternberg (1982).
-
5.
The three 2p3s levels (267634.00, 267377.11, and 267258.71 cm-1, 33.18, 33.15, and 33.14 eV) are populated by 14 near UV/optical lines of the secondary decays from levels 2p3p , 2p3p , and 2p3p . The number of decays to these levels (with a negligible contribution from the CE process) is 516.3, 259.1 and 102.5 10-3 cm-2 s-1 respectively. The total number of decays is 878 10-3 cm-2 s-1 to be compared with the 2444.1 10-3 cm-2 s-1 primary decays from level 2p3d (O1). We note that the sole permitted decays from these three 2p3s levels are through the six EUV resonance lines of mult. UV 6 near 374 (see also Fig. 6) that are important in the context of the Bowen secondary fluorescence (see Sect. 6.1).
We point out that unlike the primary lines that are ”pure” O1 or O3 lines, most secondary lines are ”mixed” O1 + O3 lines (see also sections 4.1 and 4.4). However, most O3 lines are very weak, and their contribution to the secondary decays is generally negligible. The sole exception is that of the 3122 line which, however, represents a contribution of about 2 to the total population of the 2p3p level. This justifies the neglect of the O3 contribution to the secondary lines in most of the previous considerations.
5 The other lines
In principle, recombinations and charge-exchange (CE) could be effective in populating some high levels of and provide some contribution to the intensity of the Bowen lines.
To check for the effectiveness and the relative importance of these processes we have looked for the presence in STIS and UVES spectra of such lines coming from high-lying levels, whose excitation is comparable to that of the Bowen lines.
The inspection has revealed the presence of a small number of weak lines in the near-UV optical range, the strongest one being the 2983.81 line (mult. UV 18, u.l. = 38.01 eV, I = 9.2 10-14 erg cm-2 s-1). The only other possible detection in the near-UV is the (weak) line at 2959.72 (UV 19.12, 40.26 eV) with I= 1.44 10-14 erg cm-2 s-1). This line would feed the 5592.25 line (mult 5, u.l. = 36.07 eV), that is important in the context of the charge-exchange process (see below).
In the optical range, in UVES spectra, we have detected the three weak lines of mult. 8 (u.l. = 40.27 eV) at 3265.32 (I=2.54 10-14 erg cm-2 s-1), 3260.84 (I=1.76 10-14 erg cm-2 s-1) and 3267.20 (I=2.10 10-14 erg cm-2 s-1), and the 3455.06 line of mult. 25 (u.l. = 48.95 eV) with I = 0.96 10-14 erg cm-2 s-1). The important 5592.25 line of mult. 5, (u.l.=36.07 eV) whose presence is associated with the CE process is detected only in UVES, with intensity of 1.2 10-14 erg cm-2 s-1.
Therefore, the contribution by recombinations and/or CE to the observed intensity of the Bowen lines is generally negligible, with the exception of the six weak lines in the decay from the 2p3p term, whose individual intensities are in the range of 0.2 - 0.8 erg cm-2 s-1.
6 The 4640 lines
6.1 The excitation mechanism
Bowen (1934, 1935) pointed out that, by another remarkable coincidence in nature, the resonance line 374.432 (one of the six decays from 2p3s to the ground term 2 in the final decays of the Bowen lines) has nearly the same wavelength 111 Wavelengths for the and lines in this Section and in the following are from ”The Atomic Lines List 2.05” (http://www.pa.uky.edu/peter/newpage), rounded to the third decimal digit. We note that these wavelengths are the same as those reported in Wiese et al. (1996), and in the NIST Web site (http://physics.nist.gov/PhysRefData/ASD/index.html) as Ritz wavelengths. These wavelengths come from the analysis by Pettersson, 1982 and they are supposed to be correct to about 0.0005 Å at 250 Å and to 0.002 Å at 500 Å. Interpolation suggests a wavelength uncertainty of 0.00125 Å (1.0 km s-1) near 374). as the two resonance lines of 374.434 and 374.442. Therefore, photoexcitation by 374.432 can populate both the 3d level (267244 cm-1) and the 3d level (267238.40 cm-1) of from the 2p level (174 cm-1) of the ground term. In the decay from these two high levels, the three lines at 4640.64, 4641.85 and 4634.13 are emitted, and in the subsequent decay two additional lines at 4097.36 and 4103.39 are produced. The relevant levels and transitions are reported in Fig. 13 and Table 7. Each level has also been identified by a number index from 1 to 7 in order to facilitate reading the text. See also Kastner and Bhatia (1991) (hereinafter KB91) and Kallman and McCray (1980) for further theoretical considerations and quantitative evaluations.
These optical lines are observed as quite strong emission lines in planetary nebulae, x-ray binaries, symbiotic stars and novae in the early nebular stages.
KB91, however, from a direct comparison of the observed line ratios with the theoretically predicted ratios expected from the postulated Bowen process of selective photoexcitation, have challenged the common interpretation that these emission lines originate from a secondary Bowen fluorescence. Their main argument against Bowen fluorescence is that the observed I4634/I4640 ratio indicates a relative population ratio N6/N7 close to the ”statistical” value 0.667 (where level 6 is 3d and level 7 is 3d , see also Fig. 13). Instead, in the case of Bowen fluorescence, a much lower value (about 1/9) is expected as a consequence of the fact that A2,19/A2,20 0.167 and g19/g20=4/6. KB91 did not indicate which physical process could be responsible for the thermal population ratio that apparently existed. After tentatively suggesting recombination and charge-exchange, they ruled out both processes after specific considerations.
In a subsequent paper, Ferland (1992) suggested that the optical lines could be excited by direct continuum fluorescence (CF). While the Bowen mechanism would pump both the 3d and 3d levels from the excited level 2p of the ground term (with the Aij and g factors favoring level 3d over level 3d ) continuum fluorescence would pump the level 3d from the excited level of the ground term and the 3d level predominantly from the ground level 2p of the ground term, (via the 374.198 transition) with a minor contribution (about 20 ) from the excited level. As a result, (the Aij of the transition from the level of the ground term being comparable to that of the transition from the level) the relative population of the 3d and 3d levels would become comparable, with the same result for the intensities of the three decay lines near 4640, thus reconciling the predicted intensities with the observations.

In a very recent paper, Eriksson et al. (2005) have presented a set of semi-empirical equations for the prediction of the relative intensities for the lines that are generated by the Bowen mechanism. They have also suggested an additional pumping channel associated with the 374.162 line (one of the six resonance lines in the final decay of the primary Bowen mechanism) that could pump the 374.198 line.
Eriksson et al. have obtained the intensities of the Bowen excited lines (2800-3900 Å) from IUE data of 1993 and ground-based data of the same year (Mc Kenna et al. 1997). The line intensities have been obtained also from Mc Kenna et al.(1997). Instead, the line widths for the and lines and the relative velocity shifts have been obtained from IUE data (SWP29535) of 1986 (see section 6.4 for further comments).
In the case of RR Tel, Eriksson et al. have predicted a line ratio (relative strength) I4634 /I4640 = 0.245, which is too low relative to their observed values (= 0.47), and have ruled out this additional line fluorescence channel as the main one responsible for populating level 6. They have concluded that the two 3d levels are predominantly populated by processes other than the Bowen mechanism and have suggested that radiative recombination could be the main population process of these levels, although, as they pointed out, this process cannot explain some discrepancies between the predicted and observed relative intensities of the 4641.85 and 4640.64 lines.
| Aij | STIS | FEROS | FWHM | Rel. Int. | Nν | |
|---|---|---|---|---|---|---|
| 4097.36 | 8.66e+07 | 2.05 | 1.75 | 35.3 | 0.59 | 0.042 |
| 4103.39 | 8.62e+07 | - | (0.90) | (31.0) | (0.31) | (0.022) |
| 4634.13 | 6.00e+07 | 1.69 | 1.41 | 32.0 | 0.49 | 0.039 |
| 4640.64 | 7.17e+07 | 3.46 | 2.89 | 31.8 | 1.00 | 0.081 |
| 4641.85 | 1.19e+07 | (0.60) | 0.40 | 33.7 | 0.14 | (0.014) |
| 374.198 | 1.05e+10 | - | - | - | - | - |
| 374.434 | 1.26e+10 | - | - | - | - | - |
| 374.442 | 0.21e+10 | - | - | - | - | - |
6.2 The lines intensities in RR Tel
ELI and FWHMs for all subordinate lines specifically involved in the Bowen fluorescence process have been measured in STIS and FEROS spectra.
We note (see also section 2.1) that the STIS data are absolutely calibrated but suffer from a limited spectral resolution in the optical range (about 8000). Instead, the FEROS data are not absolutely calibrated but have higher spectral resolution (about 60,000). Thus, STIS data provide a quite good estimate of the absolute line flux, while the FEROS data provide very accurate line ratios and good FWHMs measurements.
The re-calibration of FEROS (see section 2.4) has also allowed us to obtain reliable ELI and reliable line ratios for a few emission lines that are clearly observed on FEROS but are not detected or are confused with noise in the STIS grating spectra in the optical range.
Table 7 gives the measurements for the individual lines and their average (STIS and FEROS) intensities relative to the reference line 4640.64. The intensity of the 4103.39 line is rather uncertain because it falls on the red wing of the strong Hγ line. The data also indicate that I4640.64/(I4641.85+I4634.13) = 1.59 and I4634.13/I4640.64 = 0.49, close to the value (0.47) found by Eriksson et al. (2005).
The lines have FWHM values near 33.2 km s-1, a value that is close to that (35.3 km s-1) found for the Bowen lines. The average relative displacement ( - ) is -1.45 km s-1 (Eriksson et al. instead found 4-5 km/s).

6.3 The exclusion of continuum fluorescence and radiative recombination as the excitation mechanism of the 4640 lines.
As already mentioned in section 6.1, in order to explain the fact that the the 4640 lines have relative intensities that are indicative of a ”statistical” population of the 3d levels, Ferland (1992) argued that these lines are the result of continuum fluorescence.
However, if this mechanism were effective for the three lines near 374 (mult. UV 5) one would expect a similar excitation mechanism also for the other EUV resonance lines of . Inspection of ”The Atomic Line List 2.05” and of the Moore’s (1993) tables of spectra in the range 250-500 shows the presence of several resonance lines (multiplets) with Aij values (intensities) similar to those of the 374 lines, i.e. 451.87 + 452.23. (UV 4), 332.33 + 332.14 (UV 5.01), 323.49 + 323.61 + 323.67 (UV 6), 314.71 + 314.86 + 314.89 (UV 7) , 311.64 + 311.55 + 311.72 (UV 7.01), 292.44 + 292.59 (UV 7.04), 282.21 + 282.07 (UV 7.06) and other multiplets of weaker intensity. For each level of the upper term of these multiplets we have selected the strongest decays (about a dozen lines between 1385 and 4205, i.e. 1387.30, 1387.38, 1387.99, 1804.49, 1885.06, 1885.22, 2248.36, 2249.63, 2334.26, 2335.61, 3304.98, 3307.58, 3307.70, 4201.26, 4855.19, 4874.46, 4882.03) and checked for their presence in the STIS + UVES + FEROS spectrum of RR Tel.
The search has given a definite negative result. The absence of decays from the upper level of strong resonance lines that are likely to be pumped by continuum fluorescence is hardly compatible with the process of CF since it is hard to explain how this mechanism might work only for a selected group of lines viz. the 4640s.
Moreover, if CF were effective, it should work also in the case of the resonance lines (and other resonance lines in that range) and one would expect, for example, CF to pump the three upper levels of the six resonance lines near 303. In this case, from the Aij and g values (the Iij values being the same for all transitions) one would expect to see a ”statistical” relative population ratio 5:3:1 within these three upper levels and therefore a corresponding relative intensity ratio for the three ”pure” primary lines ( 3132.79, 3121.64 and 3115.68) that emanate from these levels (since they all have similar Aij values = 1.50 108), unlike what is observed. If, instead, one assumes that the observed intensity is a combination of contributions from Bowen fluorescence and continuum fluorescence this would imply that CF, if present, is, at best, very marginal since observations show that the level (upper level of 3115.68 ) is very weakly populated.
Concerning other physical processes such as radiative recombination as the main population process of the 3d levels (see also the considerations by KB91 and Eriksson et al. 2005 in section 6.1), we have checked in detail the possible presence of recombination lines of in the RR Tel spectrum. In particular we have searched in ”The Atomic Lines List 2.05” all possible decays into the two upper levels 3d ( 267244 cm-1) and 3d (267238.40 cm-1) of the 4640 lines, that is for possible parents of these lines. The strongest lines, besides a sextet near 1324, are those of mult. UV 23 with three lines near 2248 and those of mult. UV 24 with two lines near 1885. None of these lines has been detected. Therefore the 4640 lines are not fed by decays from higher levels. We have also checked for the presence of high-lying subordinate lines with high Aij and excitation level similar to that of the 4640 lines, e.g. the lines of mult. UV 22, 22.01, and 22.02., but this search has also given negative results.
An inspection of the RR Tel spectrum for the possible presence of the strongest transitions into the two lower levels 3p (17 and 18) of the three 4640 lines, e.g. 1387.30, 1387.38, and 1804.49 (whose sum of the Aij is about ten times larger than the Aij of the 4634.13 and 4641.85 lines) has also given a negative result.
Therefore, recombination is ruled out by the absence of possible decays from higher levels into the three 4640 lines, and the absence of other subordinate lines with similar Aij and excitation as the 4640 lines. In conclusion: neither continuum fluorescence nor radiative recombination seem effective in producing the observed emission lines in RR Tel. It is hard to explain how these processes may excite levels 6 and 7 of only, which indicates, instead, that some kind of selective process is present.
6.4 The role of multiple scatterings in the resonance lines of and
Continuum fluorescence and radiative recombination being ruled out, we must consider if and how a selective process like line fluorescence, could be responsible for the observed relative lines ratio in the 4640 lines.
We are supported in this investigation by the circumstantial evidence that the presence of the Bowen lines is generally associated with that of the 4640 lines in all well studied objects, a clear indication that the excitation mechanism is similar.
We recall that Eriksson et al. (2005) have taken into account the possibility of an extra pumping of level 6 (3d ) from level 1 (which is required for approaching the observed I4634/I4640 line ratio) by the near coincidence between the 374.198 and the 374.162 lines. They have obtained a population ratio N6/N7 = 0.29 and a line ratio I4634/I4640 = 0.245 which is too low relative to their observed values (= 0.47) and concluded that this mechanism is not effective.
Eriksson et al. (2005), using the study of Pettersson (1982) have also pointed out that the combined effects of the uncertainties in the wavelengths of the ground term transitions of and near 374 and of the relative velocity shifts could introduce larger uncertainties for the overlap of the profiles of the pumping and of the pumped lines and therefore for the relative line strengths. However, the Pettersson paper (1982) suggests uncertainties of 0.0005 Å at 250 Å and 0.002 Å at 500 Å , which means an uncertainty of 1.0 km s-1.
The velocity separation between 374.162 and 374.198 is close to 30 kms-1 and the effectiveness of pumping of level 6 from level 1 by 374.162 crucially depends on the overlap between the two lines (instead, the pumping of levels 6 and 7 of from level 2 are easily explained by the almost full overlap (coincidence) between the 374.432 and the 374.434 (N1) and 374.442 (N2) lines). The negative conclusion by Eriksson et al. (2005) derives from the (allegedly) small overlap between the profiles of the 374.162 and 374.198 lines, that could not guarantee the required pumping of level 6 from level 1.
In this context, it should be noted that Eriksson et al have based their calculations of line overlap on the measurements of the gaussian widths (=0.6*FWHM) of the intercombination lines of ] 1750 and ] 1660 in IUE spectra of 1986. The same width has been assumed in the calculation of the overlap between the profiles of the resonance lines of 374.162 and 374.198. Instead, in STIS and FEROS spectra, the subordinate lines of and are wider than the intercombination lines by about 5 km s-1, with the effect of increasing the line overlap.
However, what is of much higher relevance is the fact that both the six 374 resonance lines that connect the ground term 2p2 3P with the term 2p3s 3P and the three resonance lines 374 that connect levels 1 and 2 with levels 6 and 7 are all optically thick, with optical depths on the order of 1000 (see appendix for an approximate estimate ), while Eriksson et al. (2005) in their semi-empirical calculations have assumed that all transitions are optically thin.
We suggest here that multiple scattering in the 374.162 resonance line has the effect of increasing the pumping of level 6 from level 1 of , as compared to the optically thin case. Under optically thick conditions the resonance-line photons will suffer many scatterings (N o) within the nebula. The probability per single scattering that a 374.162 photon of will excite level 6 of (instead of level 2p3s of ) depends mainly on the overlap between the 374.162 and the 374.198 lines and on the relative / ground term population (abundances- ionization fraction) ratio.
We have no direct information on the widths of the resonance lines. In our spectra the observed subordinate lines (most of them being the fluorescence lines) have FWHM close to 35.3 km s-1 (while the intercombination lines of near 1666 and those of lines near 1750 have smaller FWHMs values, close to 29.7 and 25.7 km s-1 respectively). Assuming gaussian widths, the line overlap fraction is close to 0.30. However, this is almost certainly a lower limit since it is likely that the resonance lines are wider than the recombination and the intercombination lines because of line broadening by Doppler shifts. Opacity broadening ( ) will significantly affect their shape and line center optical depths close to 1000 will result in line widths 2.6 times larger than that of the optically thin case (Oegerle et al. 1983). Also, the shape of the resonance lines is better represented by a Lorentzian profile, with wider wings than the Gaussian one. Moreover as mentioned in sect. 4.3, the profile of the Bowen line is aymmetric toward the red with a maximum velocity in the red wing of about 100 kms-1.
In any case, with the assumptions that : 1) the overlap between the 374.162 and the 374.198 resonance lines is about 0.30 (a lower limit, as derived from the subordinate lines of the same ions), 2) the abundance ratio / is about 1/15 (the abundance ratio N/O is about 3 and the ionization fraction ratio (/N)/(/O) is about 5 in the region where the two ions co-exist, HN86), 3) all is in the ground term (with relative population of the 2p level given by its statistical weight = 1/3), one obtains a rough estimate of 0.30 0.0667 0.333= 6.67 10-3 as the direct probability per single scattering that a 374.162 photon of will directly excite level 6 of from its ground level (Hydrogen photoionization is neglected: He+2 region: no neutral H). However, since the optical depth (or the number of scatterings before the line escapes the nebula) for the resonance 374.162 line is about 1000, (see appendix) the probability that the level 6 of is not excited after this number of scatterings is (1-0.0066)1000 0.001. See Ferland (1992) for similar considerations in the case of resonance fluorescence.
Once the 3d level (level 6) of is pumped, it can decay either via resonant scattering with emission of the (191) 374.198 line (or the less likely (192) 374.442 line) or via emission of one of the two subordinate lines at 4634.13 and 4641.85. The Aij branching ratio from the upper level (6) (see Table 7) favours resonant scattering with respect to the cascade routes via the 4641.85 and 4634.13 lines by a factor about 175 = (1.26 1010)/(7.19 107). Therefore, the probability of conversion into the cascade route in a single act (decay) is = 0.0057. However, if the number of scatterings of the 374.198 resonance line is about 1000 (see Appendix), the probability that the line will not be converted into the optical 4634 + 4641 lines after this number of scatterings is on the order (1 - (A19,18 + A19,17)/(A19,1+A19,2))1000 0.01.
Therefore, multiple scattering of the 374 resonance lines of and have the net effect of converting a significant fraction of these photons into photons of the subordinate lines at 4634 and 4641 that can easily escape from the nebula. We point out that while the 374 lines are pure resonance lines, without alternative decay routes from their upper levels, the 374 photons have an escape route through conversion to the 4640 and 4100 lines (and other decays). It is obvious that in the optically thin case the pumping efficiency is critically dependent on the degree of line overlap, while in the optically thick case line broadening and multiple scattering will strongly increase the pumping efficiency.
It should also be noted that high oxygen and nitrogen abundances (about 4 solar), such as those generally found in the ejecta of novae would produce more intense Bowen lines as well as more intense 4640 lines because of the larger optical depths in the and resonance lines (see also Netzer et al. 1985).
Clearly, the extra contribution to the population of level 6 is added to that produced by the excitation via the 374.432 line. Note that the 374.162 and the 374.432 lines emanate from the same upper level (see Fig. 6) and that the intensity ratio of the two lines is 0.600 because of the relative Aij ratio (Table 8). As already mentioned in section 6.1, if level 6 is excited by 374.442 only, the population ratio N6/N7 is = 0.111 (because of the relative Aij ratio = 0.167 and statistical weights ratios = 0.666) and the expected I4634/I4640 ratio becomes 0.09, while the observed ratio is 0.49. Therefore, in order to achieve this line ratio the relative population ratio N6/N7 must be close to about 0.57.
Simple calculations of the photoexcitation rate of levels 6 and 7 of from the ground term ( ni gj/gi Ai,j Ii,j), assuming LTE population for the ground levels, show that if all 374.162 photons are effective in the population of level 6 of , the N6/N7 ratio becomes 0.444 and, correspondingly, the I4634/I4640 ratio becomes 0.37. This ratio is slightly lower than the observed one ( 0.49).
6.5 An additional pumping channel ?
Without invoking deviations from LTE in the population of the two levels of the ground term of in order to obtain the required ratio (a physical condition that would not be too surprising, on account of the low electron density and of the fact that the radiative processes seem to dominate over the collisional ones), we suggest here that the missing contribution could arise also from the 374.073 line, one of the two decays from level 2p3s . Although the line center separation is 101 km s-1, even a small overlap between the line wings would ensure some degree of pumping if the line optical depth is high.
Using the same considerations adopted in the previous section for the 374.162 line (but assuming, in a conservative approach, only 5 as the overlap fraction between the 374.198 and the 374.073 line profiles) one obtains a rough estimate of 0.05 0.0667 0.333= 1.1 10-3 as the direct probability per single scattering that a 374.073 photon will directly excite level 6 of from its ground level . However, since the optical depth of the 374.073 resonance line is about 6000 (larger than that of the 374.162 line), the probability that level 6 of is not excited after this number of scatterings is again very low (1-0.0011)6000 0.0005.
One should also note that the smaller overlap is compensated by the much larger line intensity of 374.073 relative to 374.162. In fact, as a result of the combined effect of the larger number of decays to the 3p3s level at 267634 cm-1 relative to the 3p3s level at 267377 cm-1 (516.3 and 259.1 10-3 cm-2 s-1 respectively, see section 4.6) and of the line branching ratios within each of these levels, the 374.073 line is about six times stronger than the 374.162 line and about 3.6 times stronger than the 374.432 line. As an illustration, the relative intensities of the five resonance lines of that fall between lambda 374.004 and lambda 374.432 are reported in Fig. 15 together with their resulting profile for FWHM = 100 km-1. From this figure one can see that, as a result of the strong contribution of the 374.073 line, the combined intensity near the 374.198 line is higher by about 30 than that corresponding to the 374.162 line alone.
In this case, simple calculations of the radiative rates show that the relative flux ratio I374.198/I374.434 would be just about 20 lower than that required (in the optically thin case) to populate the levels 6 and 7 with the ratio required by the observations. Moreover, a red-wing excess/asymmetry in the strong 374.073 line, as observed in all lines, would increase the flux near 374.198 and produce a ratio close to that required. However, we want to explicitly point out again that it is the process of multiple scatterings (optically thick conditions) which is more effective in increasing the pumping efficiency.

| Aij | Aij | ||
|---|---|---|---|
| 303.413 | 3.86E+09 | 373.803 | 9.92E+08 |
| 303.461 | 1.16E+10 | 374.004 | 1.32E+09 |
| 303.517 | 2.89E+09 | 374.073 | 2.97E+09 |
| 303.622 | 2.89E+09 | 374.162 | 9.90E+08 |
| 303.695 | 4.81E+09 | 374.328 | 3.95E+09 |
| 303.800 | 8.65E+09 | 374.432 | 1.65E+09 |
As a circumstantial support of this ”new” pumping channel of level 6 of by 374.073, despite the separation of about 100 km s-1 between the line centers, one notes that in the case of the well observed O3 fluorescence channel the line separation between Ly- 303.782 and 303.893 is not much smaller (about -88.2 km-1), while in the process that excites the 2p3p level of and produces the two weak lines observed at 3115.68 and 3408.12, the velocity separation between the Ly- line and the 303.461 line is -250 km-1. This latter excitation process, that is called ”other” in KB96, necessarily requires wide wings in the resonance line of 303.782, while the observed FWHM of the recombination lines is much lower, close to 60 km-1. This clearly indicates that the resonance lines are much wider than the subordinate lines.
In conclusion, the 374.073 resonance line of may also contribute to the population of level 6 of and thus increase the population ratio N6/N7 to a value close to the observed one. Obviously, similar considerations could be applied to the 374.328 resonance line, whose wavelength falls midway between 374.442 and 374.198 line and therefore would provide a similar contribution to the population of levels 6 and 7 of .
6.6 The absolute intensities of the lines and the requirement of large optical depths
In sect. 6.4 large optical depths in the resonance lines of O III and have been proposed as a mechanism to explain the observed intensity ratio in the three 4640 lines. This assumption was justified by the estimates reported in the Appendix. An additional and convincing argument in favour of this mechanism comes from the fact that the observed absolute intensities of the 4640 lines necessarily require large optical depths in the exciting lines.
We recall that from STIS and UVES observations one can directly derive the number of photons that populate the three levels of the 2p3s term from which the six lines near 374 have origin. Therefore, starting from the observed number of photons (0.26 photons cm-2 s-1) into level 2p3s of (the upper level of the 374.434 line, that can populate level 7 of ) one can provide an upper limit for the expected number of photons in the 4640.64 line.
The branching ratio from level 2p3s of toward the 374.432 line (there are two competing decays from the same level at 374.162 and 374.004) is close to 0.42 (see Fig.6 and Table 8) and therefore about 0.11 photons cm-2 s-1 are expected in the 374.432 line. Assuming full conversion of this line into the two lines at 374.434 and 374.442, from the Aij ratio (close to 6.0) of these two transitions one obtains that the number of photons cm-2 s-1 that populate level 7 (3d ) of through the 374.434 line is about 0.093. Assuming that level 7 (3d ) of will decay only through the 4640.64 line (instead of the more competitive resonant decay) one obtains the same value (0.093) for the number of photons in the 4640.64 line. This corresponds to a line intensity of 3.96 10-13 erg cm-2 s-1.
The observed intensity (STIS) of the 4640.64 line is 3.46 10-13 erg cm-2 s-1 (corresponding to 0.081 photons cm-2 s-1). Therefore the observed intensity of 4640.64 is only slightly less (87) than that expected in the limiting case of full conversion of 374.432 into 374.434 and of 374.434 into 4640.64 (and additional decays).
As already mentioned, in the optically thin case the conversion of 374.432 into 374.434 by line overlap would be much smaller than 1, but above all, the Aij branching ratio from level 7 of would favour re-emission of 374.434 instead of 4640.64, by a factor (1.26 1010)/(7.17 107) = 175 and therefore the expected emission intensity in the 4640.64 line would be lower by a factor close to 103. Similar considerations can be used for level 6 and the 4641.85 and 4634.13 lines.
In conclusion, very low intensities are expected in the optically thin regime because the Aij factors strongly favour re-emission of the resonance lines relative to the decays into the subordinate lines. In fact, the whole Bowen process starting from Ly- and the transitions near 303.80 up to the the 4640 lines (via the and 374 lines) requires high optical depths in the resonance lines. In the optically thin case the intensity of the Bowen lines would be also negligible, and ”a fortiori” that of the 4640 lines.
These considerations strongly support our previous arguments about the large optical depths in the resonance lines. Thus, the requirement of large optical depths is not an ”ad-hoc” assumption but emerges in a self-consistent picture.
We recall that the efficiency of the Bowen fluorescence can be defined (Eastman and MacAlpine, 1985) as the fraction of the 374 resonance photons arising from level 2p3s which undergoes fluorescence with and is converted to the Bowen lines near 4640. In the case of RR Tel, a direct counting of the photons gives a fraction 0.134/0.259 0.52. We note, however, that unlike the case of fluorescence in which the pumping line is unambiguously Ly- 303.782, in the case of the candidate pumping lines can be as high as six (depending on the line width). Therefore the efficiency can vary from 15.3 , if one considers all the photons of the six lines near 374, to 87.0 , if one considers only the photons from the 374.432 line. Eastman and MacAlpine (1985) have provided a direct expression for the Bowen efficiency, based on the observed intensities of the and lines.
In the case of RR Tel we obtain y 48 , in good agreement with the estimate from the photon fractions.
As a final remark to this section, we point out the analogy in the - fluorescence and in the - fluorescence: in the former case the pumping line is the optically thick Ly- line while the pumped lines are the optically thick resonance lines of at 303.800 (O1) and 303.695 (O3), that are converted into longer wavelength subordinate lines, i.e. the primary and secondary Bowen decays that easily escape from the nebula (the tertiary decay is into the six resonance lines near 374). In the - fluorescence the pumping lines are the optically thick lines near 374 while the pumped lines are the three optically thick lines of near 374 that are converted into the subordinate 4640 primary lines and the 4100 secondary lines, that also easily escape from the nebula.
6.7 A detailed examination of the energy balance in the levels
-
1.
Levels 7 (3d , 267244.0 cm-1) and 6 (3d , 267238.40 cm-1):
these are the upper levels of the 4640.64 and 4634.13 + 4641.85 lines respectively. We have searched in ”The Atomic Line List v.2.05” for all the strongest decays into these levels from all higher levels and checked for the possible presence of these lines in the spectrum of RR Tel. This search has given a definite negative result, primarily for the absence of the two very strong lines of mult. UV 24 1885.06 and 1885.22 and of other strong lines. Therefore, there are no contributions to these levels other than that of the 374 lines. This result is in agreement with the negative result described in sect. 6.3 concerning the absence of recombination lines. We note that the observed I4634.13/I4641.85 ratio is 3.50, while it should be close to 5.0 irrespective of any process, because the lines share the same upper level and have relative Aij values = 5.0. A possible explanation is that the 4641.85 line is partially blended. Its slightly larger FWHM (Table 7) supports this suggestion.
-
2.
level 5 (3p , 245701.30 cm-1):
An examination in ”The Atomic Line List 2.05” of all possible decays into level 5 (3p (245701.30 cm-1), shows that besides the 4640.64 and 4641.85 lines also other transitions are listed (e.g., 1387.38 and 1805.66) with much stronger Aij values. However, these lines are not present in the RR Tel spectrum confirming that level 5 (3p ) is populated by the 4640.64 and 4641.85 lines only, thus supporting the fluorescence mechanism.
The 4640.64 line and the 4641.85 line are parents of the 4097.36 line. From the observed intensities one can see that the sum of the number of photons in these two lines is larger by a factor about 2.2 than the number of photons in the 4097.36 line. Inspection of ”The Atomic Line List 2.05” shows that competing decays from the 3p level are two EUV transitions at (vac.) 691.19 and 871.86. The sum of the Aij in these two lines is about 1.4 times larger than the Aij of the 4097.36 line. Therefore, the difference in the number of decays is almost reconciled.
-
3.
level 4 (3p , 245665.40 cm-1):
This level is fed by the 4634.13 line and is the upper level of the 4103.39 line. The emission intensity of this line is not accurately determined because it falls in the red wing of the strong Hδ line.
From an examination in ”The Atomic Line List 2.05” of all possible decays into level 4 (3p (245665.40 cm-1), one notes that also other transitions are present (e.g., 1387.30 and 1804.49) with much stronger Aij values than those of the 4640.64 and 4641.85 lines. However, these lines are not present in the RR Tel spectrum confirming that level 4 is populated by 4634.13 only.
From level 4 there are two competing decays at 691.40 and 872.13 and the sum of the Aij of these two lines ( 1.37 108) is about 1.6 times larger than the Aij ( 8.62 107) of the 4103 line. The ratio of the number of photons in the 4634.13 and 4103.39 lines (as obtained from Table 7) is about 1.8 in fair agreement with the expectations, if one takes into account the uncertainty in the emission intensity of the 4634.13 line.
6.8 The large optical depths in the resonance lines


An additional argument in support of large optical thickness in the resonance lines comes from the intensities of the three resonance lines of mult. UV 2 near 1304 ( 2p3 3s 2p4 ) relative to the intercombination line at 1641.30 line (3s 2p4 , mult. UV 146) with whom they share the same upper level 3s (76794.98 cm-1). We note that there is also the 2325.45 intercombination line (3s 2p4 ) that decays from the same level but its wavelength is nearly coincident with that of the CII line 2325.40.
The emission intensity of 1302.17 (l.l. = 0.00 eV) is affected by partial absorption by its IS counterpart, while the 1304.86 line (l.l. = 158.26 cm-1) is fully absorbed by the Si II(3) 1304.37 line (l.l. = 0.00 eV). Instead, the 1306.03 line (l.l. 226.98 cm-1) is free from IS absorption (see Fig. 16). The Aij ratio 1306.03/1641.30 would favour the 1306.03 resonance line with respect to 1641.30 by a factor 0.65 108/1.83 103 3.5 104. Instead, the observed intensites on STIS are similar (1.25 10-13 erg cm-2 s-1 and 2.24 10-13 erg cm-2 s-1 respectively). Evidently, whatever is the mechanism for population of the 3s level (likely a decay from 3d , after Ly- 1025 fluorescence, through 11287 and 8446, since this latter line is present in FEROS spectra) the resonant photons will scatter many times and there is a very small but finite chance that at each resonant scattering decay from the upper level 3s will occur through the intercombination lines at 1641.30 and 2325.45.
Thus, if the scattering number is very high, processes with a small probability per scattering of destroying resonance lines can become important (Osterbrock, 1962). Unlike the 1304 photons that are trapped resonant radiation, the 1641.30 photons, will leave the nebula undisturbed because of their very low Aij value. Thus, the large optical depth of the 1304 lines has the effect of converting these resonantly trapped photons into photons of the 1641.30 line.
The importance of this kind of process involving the 1641.30 line for the determination of the opacity in the resonance lines has been pointed out by Jordan (1967) and by Jordan and Judge (1984) for the chromospheres of cool stars. Bhatia and Kastner (1995) have further developed this method and derived an explicit graph of the I1641/I1302 ratio as function of log . In the specific case of RR Tel they have used the measurements in IUE spectra by Penston et al. (1983) and derived log 6.0. This estimate should actually be considered as an upper limit because the IS absorption of the 1302 line was not taken into account. However, using our reliable I1641/I1306 ratio from the STIS data, and ”mutatis mutandis” (the Aij ratio of 1302.16 relative to 1306.03 line is near 5.0) we have obtained again that 6.0.
We also note that the resonance line 1306.03 is much wider (FWHM 43 km ) than the intercombination ] line 1641.30 (FWHM 12 km ) although both lines arise from the same upper level (see also Fig. 16 and Fig. 17). This supports our previous considerations about the much larger width of the resonance lines as compared to the subordinate and intercombination ones.
7 Conclusions.
By combining STIS and UVES data we have obtained very accurate measurements of the absolute intensities for about 25 Fowler lines and for almost all lines produced by the Bowen mechanism.
A new measure of reddening (E(B-V) 0.00) has been obtained from the decrement of the Fowler series down to the region of the series limit near 2060. This new E(B-V) value, which is in contrast with the commonly assumed value E(B-V) 0.10, has been confirmed by the observed STIS UV + optical continuum distribution, by a re-analysis of the IUE low resolution data, and by the value of the neutral H column density, obtained from the damped profile of the IS Ly- line.
The high quality of the spectral data has allowed us to obtain the most complete set of measurements of the Bowen fluorescence lines so far reported for any astronomical source, and includes six ”pure” O1 lines, seven ”pure” O3 lines and the two very weak lines at 3115.68 and 3408.12 both associated with pumping in the 303.46 channel. This is also the first measurements of absolute intensity, for the two lines at 3115.68 and 3408.12, both associated with pumping in the 303.46 channel, and the first detection of two weak lines belonging to the primary decay of the O1 process, that have been found near 2180.
The data have also allowed a detailed study of the decays from all levels involved in the Bowen mechanism and a detailed comparison with the predictions of the theoretical models of Froese Fischer (1994) and Kastner and Bhatia (1996). In general, the observed emission intensities, are in very good agreement with the predictions of the Froese Fischer (1994) model. The STIS and UVES data indicate an efficiency in the O1 and O3 channels of about 20 and 0.7 , respectively. In the past (1978 - 1995) the O1 and O3 efficiency (obtained from a study of IUE high resolution spectra) was about 2.1 times and 4.0 times higher, respectively
A detailed study of the 4640 emission lines and of their possible excitation mechanism has shown that, recombination and continuum fluorescence being ruled out, line fluorescence remains the only viable excitation mechanism. We have pointed out the important role of multiple scattering in the resonance lines and shown that the observed relative ratios and absolute intensities of the lines can be explained in terms of line fluorescence by the three resonance lines of at 374.432, 374.162 and 374.073 under optically thick conditions.
References
- Aller (1984) Aller, L. H. 1984, Physics of Thermal Gaseous Nebulae, edited by L.H. Aller ISBN 90-277-1814-8; 1984, Astrophysics & Space Science Library vol. 112,
- Behring et al. (1976) Behring, W. E., Cohen, L., Doschek, G. A., & Feldman, U. 1976, ApJ, 203, 521
- Bhatia & Kastner (1993) Bhatia, A. K. & Kastner, S. O. 1993, Atomic Data and Nuclear Data Tables, 54, 133 (BK)
- Bhatia & Kastner (1995) Bhatia, A. K., & Kastner, S. O. 1995, ApJS, 96, 325
- Bhatia et al. (1982) Bhatia, A. K., Kastner, S. O., & Behring, W. E. 1982, ApJ, 257, 887
- Bessell (1999) Bessell, M. S. 1999, PASP, 111, 1426
- Bowen (1934) Bowen, I. S. 1934, PASP, 46, 14
- Bowen (1935) Bowen, I. S. 1935, ApJ, 81, 1
- Contini & Formiggini (1999) Contini, M., & Formiggini, L. 1999, ApJ, 517, 925
- Crawford et al. (1999) Crawford, F. L., McKenna, F. C., Keenan, F. P., Aller, L. H., Feibelman, W. A., & Ryan, S. G. 1999, A&AS, 139, 135
- della Valle & Livio (1995) della Valle, M., & Livio, M. 1995, ApJ, 452, 704
- Dickey & Lockman (1990) Dickey, J. M., & Lockman, F. J. 1990, ARA&A, 28, 215
- Diplas & Savage (1994) Diplas, A., & Savage, B. D. 1994, ApJ, 427, 274
- Downes & Duerbeck (2000) Downes, R. A., & Duerbeck, H. W. 2000, AJ, 120, 2007
- Eastman & MacAlpine (1985) Eastman, R. G., & MacAlpine, G. M. 1985, ApJ, 299, 785
- Eriksson et al. (2005) Eriksson, M., Johansson, S., Wahlgren, G. M., Veenhuizen, H., Munari, U., & Siviero, A. 2005, A&A, 434, 397
- Espey et al. (1996) Espey, B., Keenan, F. P., McKenna, F. C., Feibelman, W. A., & Aggarwal, K. M. 1996, ApJ, 465, 965
- Evans (1967) Evans, D. S. 1967, IAU Symp. 30: Determination of Radial Velocities and their Applications, 30, 57
- Feast et al. (1977) Feast, M. W., Robertson, B. S. C., & Catchpole, R. M. 1977, MNRAS, 179, 499
- Feast et al. (1983) Feast, M. W., Whitelock, P. A., Catchpole, R. M., Roberts, G., & Carter, B. S. 1983, MNRAS, 202, 951
- Dalgarno & Sternberg (1982) Dalgarno, A., & Sternberg, A. 1982, MNRAS, 200, 77P
- Ferland (1992) Ferland, G. J. 1992, ApJ, 389, L63
- Friedjung (1974) Friedjung, M. 1974, Ap&SS, 29, L5
- Froese Fischer (1994) Froese Fischer, C. 1994, Phys. Scr, 49, 323 (FF)
- Galavis et al. (1997) Galavis, M. E., Mendoza, C., & Zeippen, C. J. 1997, A&AS, 123, 159
- Glass & Webster (1973) Glass, I. S., & Webster, B. L. 1973, MNRAS, 165, 77
- González-Riestra et al. (2001) González-Riestra, R., Cassatella, A, & Wamsteker, W. 2001, A&A, 373, 730
- Harrington (1972) Harrington, J. P. 1972, ApJ, 176, 127
- Hayes & Nussbaumer (1986) Hayes, M. A., & Nussbaumer, H. 1986, A&A, 161, 287 (HN86)
- Heck & Manfroid (1985) Heck, A., & Manfroid, J. 1985, A&A, 142, 341
- Henize & McLaughlin (1951) Henize, K. G., & McLaughlin, D. B. 1951, ApJ, 114, 163
- Høg et al. (1997) Høg, E., et al. 1997, A&A, 323, L57
- Høg et al. (2000a) Høg, E., et al. 2000, A&A, 355, L27
- Høg et al. (2000b) Høg, E., et al. 2000, A&A, 363, 385
- Johnson & Soderblom (1987) Johnson, D. R. H., & Soderblom, D. R. 1987, AJ, 93, 864
- Jordan (1967) Jordan, C. 1967, Sol. Phys., 2, 441
- Jordan & Judge (1984) Jordan, C., & Judge, P. 1984, Physica Scripta Volume T, 8, 43
- Jordan et al. (1994) Jordan, S., Murset, U., & Werner, K. 1994, A&A, 283, 475
- Kaler (1967) Kaler, J. B. 1967, ApJ, 149, 383
- Kallman & McCray (1980) Kallman, T., & McCray, R. 1980, ApJ, 242, 615
- Kastner & Bhatia (1991) Kastner, S. O., & Bhatia, A. K. 1991, ApJ, 381, L59
- Kastner & Bhatia (1996) Kastner, S. O. & Bhatia, A. K. 1996, MNRAS, 279, 1137 (KB96)
- Kaufer et al. (1999) Kaufer, A., Stahl, O., Tubbesing, S., Norregaard, P., Avila, G., François, P., Pasquini, L., & Pizzella, A. 1999, The Messenger, 95, 8
- Keenan et al. (2002) Keenan, F. P., et al 2002, MNRAS, 337, 901
- Likkel & Aller (1986) Likkel, L., & Aller, L. H. 1986, ApJ, 301, 825
- Livio (1992) Livio, M. 1992, ApJ, 393, 516
- Liu & Danziger (1993) Liu, X.-W., & Danziger, J. 1993, MNRAS, 261, 465
- McKenna et al. (1997) McKenna, F. C., Keenan, F. P., Hambly, N. C., Allende Prieto, C., Rolleston, W. R. J., Aller, L. H., & Feibelman, W. A. 1997, ApJS, 109, 225
- Mayall (1949) Mayall, M. W. 1949, Harvard College Observatory Bulletin, 919, 15
- Moore (1993) Moore C. E., 1993, Tables of Spectra of Hydrogen, etc. ed. by J. W. Gallagher, CRC Press, Inc., Boca Raton, Florida.
- Murset & Nussbaumer (1994) Murset, U., & Nussbaumer, H. 1994, A&A, 282, 586
- Netzer et al. (1985) Netzer, H., Elitzur, M., & Ferland, G. J. 1985, ApJ, 299, 752
- Nussbaumer et al. (1988) Nussbaumer, H., Schmid, H. M., Vogel, M., & Schild, H. 1988, A&A, 198, 179
- Oegerle et al. (1983) Oegerle, W.R. & Peters, G.J., & Polidan R.S., 1983 PASP, 95, 147
- Osterbrock (1962) Osterbrock, D. E. 1962, ApJ, 135, 195 ‘
- Osterbrock & Ferland (2006) Osterbrock, D. E., & Ferland, G. J. 2006, Astrophysics of gaseous nebulae and active galactic nuclei, 2nd. ed. by D.E. Osterbrock and G.J. Ferland. Sausalito, CA: University Science Books, 2006
- Penston et al. (1983) Penston, M. V., et al. 1983, MNRAS, 202, 833
- Pereira et al. (1999) Pereira C.B., & de Araujo F.X., & Landaberry S.J.C., 1999, MNRAS 309,1074
- Pettersson (1982) Petterson S.G., 1982, Phys. Scr., 26, 296
- Rodríguez-Pascual et al. (1999) Rodríguez-Pascual, P. M., González-Riestra, R., Schartel, N., & Wamsteker, W. 1999, A&AS, 139, 183
- Saraph & Seaton (1980) Saraph, H. E. & Seaton, M. J. 1980, MNRAS, 193, 617 (SS)
- Schachter et al. (1990) Schachter, J., Filippenko, A. V., & Kahn, S. M. 1990, ApJ, 362, 74
- Schachter et al. (1991) Schachter, J., Filippenko, A. V., Kahn, S. M., & Paerels, F. B. S. 1991, ApJ, 373, 633
- Schild & Schmid (1997) Schild, H., & Schmid, H. M. 1997, Physical Processes in Symbiotic Binaries and Related Systems, 169
- Schlegel et al. (1998) Schlegel, D. J., Finkbeiner, D. P., & Davis, M. 1998, ApJ, 500, 525
- Selvelli & Bonifacio (2000) Selvelli, P. L. & Bonifacio, P. 2000, A&A, 364, L1
- Selvelli & Bonifacio (2001) Selvelli, P., & Bonifacio, P. 2001, ASP Conf. Ser. 242: Eta Carinae and Other Mysterious Stars: The Hidden Opportunities of Emission Spectroscopy, 242, 367
- Stone & Baldwin (1983) Stone, R. P. S., & Baldwin, J. A. 1983, MNRAS, 204, 347
- Storey & Hummer (1995) Storey, P. J. & Hummer, D. G. 1995, MNRAS, 272, 41
- Thackeray (1977) Thackeray, A. D. 1977, MmRAS, 83, 1
- Vernazza & Reeves (1978) Vernazza, J. E., & Reeves, E. M. 1978, ApJS, 37, 485
- Walker (1977) Walker, A. R. 1977, MNRAS, 178, 245
- Wallerstein et al. (1991) Wallerstein, G., Garnavich, P. M., Schachter, J., & Oke, J. B. 1991, PASP, 103, 185
- Whitelock (1988) Whitelock, P. A. 1988, ASSL Vol. 145: IAU Colloq. 103: The Symbiotic Phenomenon, 47
- Wiese et al. (1996) Wiese, W. L., Fuhr, J. R., & Deters, T. M. 1996, Atomic transition probabilities of carbon, nitrogen, and oxygen. Edited by W.L. Wiese, J.R. Fuhr, and T.M. Deters. Washington, DC : American Chemical Society … for the National Institute of Standards and Technology (NIST) c1996. QC 453 .W53 1996.,
- Young et al. (2005) Young, P. R., Berrington, K. A., & Lobel, A. 2005, A&A, 432, 665
- Zuccolo et al. (1997) Zuccolo, R., Selvelli, P., & Hack, M. 1997, A&AS, 124, 425
Appendix A The optical depths in the and resonance lines
The line absorption cross section per atom at the line center is
= 8.30 10-13 f12 ()-1, where is the line FWHM. The optical depth at the line center is = Rneb Nx, where Nx is the number density of absorbers.
The radius of the emitting region (O+2) nearly coincides with that of He+ since O+2 has an ionization potential 54.9 eV, nearly the same (54.4 eV) as He+ (Osterbrock and Ferland, 2006). Ionization models (ibidem) also show that for an effective temperature of the exciting star greater than 40,000 K (HN86 give 200,000 K for RR Tel) the He+ zone coincides with the H+ zone. Therefore, the relevant radius can be obtained from the observed emission intensity in the Hβ 4861 line, if Ne and the distance are known:
L4861=h Ne N 4/3 =4d2 F4861
After substitution of the numeric values (h =1.03 10-25, N=0.8Ne, 4d2=1.445 1045, F4861=162.0 10-13) one obtains that R3=5.40 1058/N.
As an average of various Ne diagnostics for and we have obtained Ne6106, in agreement with previous estimates by HN86, and in fair agreement with the value (Ne=1.9 107) very recently obtained by Young et al. (2005) from a diagnostic based on the ratio of lines. Therefore, in the case of a spherically symmetric, homogeneous nebula (filling factor=1) the radius of the H+ region is R1.2 1015 cm. HN86 instead obtained a value of 1.0 1015 cm for the whole nebula.
For the 374.432 line one has f12= 2.08 10-2, and for its we assume 0.045 10-8 cm (a rather conservative value that corresponds to a FWHM of 36 km s-1, the average value from the subordinate Bowen lines). Assuming that: 1) Ne=6106, 2) Ne1.2NH, O/H9 10-4 (nearly solar, see Nussbaumer et al. 1988), 3) the dominant ionization stage of oxygen in a large fraction of the nebular volume is O+2 (OO+2) (HN86), and 4) the 2p2 3P2 level of the ground term of is thermally populated, one obtains that the optical depth in the line center of the 374.432 line is (374.432)1790. Similar calculations for 374.162 (f12= 2.08 10-2) and 374.073 (f12=6.32 10-2) give (374.162)1075 and (374.073)5370, respectively.
The average number of scatterings N in the nebula is closely related to the line optical depth. For a rough estimate, we adopt the common relation (No) that for the lines gives N374.4324900, N374.1622840, and N374.07315700.
For the 374 lines, ”mutatis mutandis”, i.e. 1) N/H 3 10-4, 2) 0.2 N since most nitrogen is in the N+3 ionization stage (HN86), and 3) adopting the specific f12 values and populations of the ground term, one obtains (374.442)550, (374.434)1130, ( 374.198)622, and correspondingly that N374.4421380, N374.4343000, and N374.1981580.