![[Uncaptioned image]](/html/astro-ph/0611889/assets/x1.png)
Origin of Superluminal radio jets in GRS 1915+105 and
the role of the Plateau state
J S Yadav
Tata Institute of Fundamental Research, Homi Bhabha Road,
Mumbai-400005, India
Abstract
We have studied the accretion disk during the radio plateau state and the following superluminal relativistic radio jets and have provided a tight correlation between accretion disk and superluminal jet parameters. We find that accretion rate during the plateaux is very high and suggest that the accretion disk during the radio plateaux is always associated with radiation-driven wind. The internal shock forms in the previously generated slowly moving wind (during plateau) with 0.01 as the fast moving discrete jet (usually at the end of plateau) with 1 catches up and interacts with it. The power of superluminal jet is determined by the strength and speed of these two components; the slow moving wind and the fast moving jet which are related to the accretion disk during the plateau state. Finally, we discuss the implication of this work.
VI Microquasar Workshop: Microquasars and Beyond
September 18-22, 2006
Como, Italy
1 Introduction
In active galactic nuclei (AGN) & quasars, large superluminal outflows/jets are known to exist for almost half century yet remain poorly understood. This is probably due to the lower characteristic accretion disk temperature as well as the fact that the central part of these systems is usually obscured by a large amount of dust. The long time scales associated with these massive systems pause an additional observational problem. Discovery of the first microquasar GRS 1915+105 in 1994 in our Galaxy revived great hope to study the disk-jet connection in general and the origin of superluminal jets in particular [1]. Microquasars are closer, smaller and show faster variability that is easily observable. GRS 1915+105 has shown exceptionally high variability in X-rays as well as in radio. Since 1996, rich X-ray variability of this source is observed by RXTE [2, 3] and by the Indian X-ray Astronomy Experiment, IXAE [4]. Belloni et al. (2000) have classified the complex X-ray variability of GRS 1915+105 in 12 separate classes on the basis of their light curves and color-color diagrams and suggested three basic states of this source, namely hard state and two softer states with different temperatures of the accretion disk.
The radio emission from GRS 1915+105 can be broadly put into two classes; (1) radio emission close to the compact object (¡200 AU), and (2) radio emission at large distances ( 240 AU). The former class includes (a) steady radio jets (radio plateau state), (b) preplateau flares, and (c) oscillations/baby jets (discrete jets) of 20-40 min duration in infrared (IR) & radio while the latter class includes large superluminal radio jets. The steady radio jets of 20 – 160 mJy flux density are associated with the canonical low hard X-ray state and observed for extended durations [6, 7]. These are optically thick compact jets with velocity of 0.1–0.4 [8, 9]. The radio emission is correlated with the X-ray emission as Lradio L for several different sources [10]. Pooley & Fender (1997) observed radio oscillations with delayed emission at lower frequency. Simultaneous X-ray, IR and radio multi-wavelength observations provided first major step in our understanding of disk-jet interaction and suggested that the spike in X-ray coincides with the beginning of IR flare and it has self absorbed synchrotron emission associated with adiabatic expansion [12, 13]. These are also compact jets with velocity 1 [8]. The relativistic superluminal jets with up to 1 Jy flux density have steep radio spectrum and are observed at large distances few hundred AU to 5000 AU from the core [1, 14, 8]. These radio jets are very energetic with luminosity close to the Eddington luminosity, LEdd and have been observed in several sources [14, 15, 16, 17]. Progress in our understanding of these jets, especially of their connection to the accretion disk has been slow. The physical connection between X-ray emission and the superluminal flares has been the hardest to understand.
In this paper, we investigate the association of large superluminal jets with the radio plateaux. We have analysed the available RXTE PCA/HEXTE X-ray data during radio plateaux and the radio flare data from the Green Bank Interferometer (GBI). Yadav (2006) has described the analysis procedure and the selection criteria in detail.
| Superluminal Radio Flare Properties | Associated Preceding Plateau Properties | |||||||
| MJD/ | Peak | Rise | Decay Time | GBI | Date of | QPO | Total | NH |
| Date | Flux | Time | constant | Flux | RXTE | Freq. | X-ray | (1022 cm-2) |
| (mJy) | (day) | (days) | (mJy) | Obser. | (Hz) | Fluxa | ||
| 50750/1997 Oct 30 | 550 | 0.6 | 3.16 | 47.3 | 1997 Oct. 25 | 1.88 | 2.04 | 13.27 |
| 50916/1998 Apr 13 | 920 | 0.8 | 4.02 | 91.0 | 1998 Apr. 11 | 1.60 | 2.42 | 14.95 |
| 50933/1998 Apr 30 | 580 | 0.9 | 3.98 | 91.0 | 1998 Apr. 28 | 1.41 | 2.34 | 13.55 |
| 50967/1998 Jun 03 | 710 | 0.3 | 2.82 | 56.2 | 1998 May 31 | 1.76 | 2.14 | 12.99 |
| 51204/1999 Jan 30 | 340 | 0.25 | 1.12 | 27.8 | 1999 Jan. 24 | 2.55 | 1.84 | 11.19 |
| 51337/1999 Jun 08 | 490 | 0.7 | 2.67 | 45.5 | 1999 Jun. 03 | 1.77 | 1.98 | 12.43 |
| 51535/1999 Dec 23 | 510 | 0.8 | 2.67 | 51.3 | 1999 Dec. 21 | 2.12 | 2.23 | 13.61 |
| 52105/2001 Jul 16b | 210 | 0.7 | 1.77 | 20.0 | 2001 Jul. 11 | 2.40 | 1.75 | 10.60 |
| a: Integrated 3–150 keV X-ray flux in 10-8 ergs cm-2 s-1 | ||||||||
| b: VLBA radio data (see text for details) | ||||||||
2 Observations and analysis
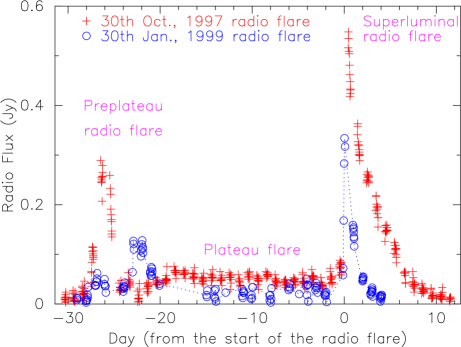
The typical sequence of events for a superluminal radio flare is shown in Figure 1 for the 550 mJy radio flare on 1997 October 30 (gap in GBI data at peak) and for the 340 mJy radio flare on 1999 January 30. The start of the radio flares is offset to zero. A superluminal event starts with small preplateau flares followed by a steady long plateau, followed by superluminal radio flares. The preplateau flares are discrete ejections of adiabatically expanding synchrotron clouds with flat radio emission and are similar to the oscillations/discrete jets. The exponential decay is an important characteristic of superluminal radio flares which differentiates them from the other class of radio flares which occur close to the compact object [20]. It is also found that the radio plateau is always associated with a superluminal radio flare [14, 21, 22]. We searched 2.25 GHz GBI radio monitoring data during the period from 1996 December to 2000 April and selected radio plateaux and the following radio flares which decay exponentially. All the selected superluminal flares are given in Table 1 along with associated X-ray properties. One more radio flare on 2001 July 16 which was observed by the Very Large Baseline Array (VLBA) and Ratan radio telescope is also added in Table 1. VLBA observations clearly showed an ejecta well separated from the core [23].
We study X-ray properties during radio plateaux within the preceding week from the start of superluminal flares to avoid changes in accretion disk over the long durations of plateaux (from -7 to -2 in Figure 1). We also avoid the last day of plateaux as radio data suggest rapid changes in the accretion disk. For the timing analysis, we used single-bit-mode RXTE/PCA data in the energy ranges 3.6 – 5.7 and 5.7 – 14.8 keV. Normalised power density spectra of 256 bin are generated and co-added for every 16 s. During the plateaux, it is in a very high luminosity state (VHS) with power law index 2 . The spectrum is dominated by the Compton scattered emission ( 85%) rather than the disk. A model consisting of disk + power law + a comptonised component (CompTT) with a gaussian line at 6.4 keV is used for the X-ray analysis. The integrated radio flux is calculated by integrating the fitted exponential function over a duration three times the decay time constant. Further details of X-ray and radio data analysis are given in Yadav (2006) [20].
3 Results and discussion
It is increasingly believed that the coronal material (and not the disk material) is ejected prior to radio flares [24, 22, 18, 25]. It is consistent with the observation that radio flares are observed during the transition from the low hard state to the high soft state but never observed during the opposite transition [21]. It also agrees with the suggestion that the spike in X-ray during the - class is associated with the change of the X-ray state due to a major ejection episode [26]. Once this coronal material is ejected, it invariably decouples from the disk. However, this decoupling may not produce any observable effect during the plateaux as inflow and outflow in the accretion disk are in equilibrium. Both the accretion disk and the radio flare are in steady state. On the other hand, decoupling is supposed to produce maximum effect during the superluminal radio flares which are observed at large distances of a few hundred to few thousand AU from the core [6, 14, 8]. This has made disk-jet connection the hardest to understand for superluminal radio jets [18, 19].
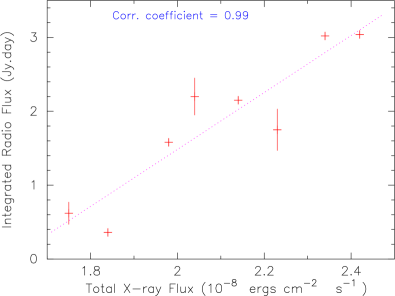
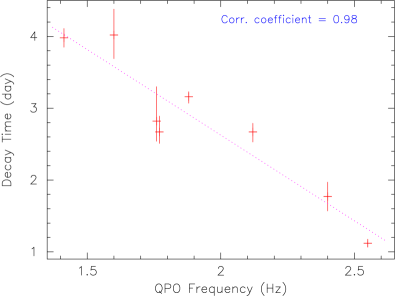
In Figure 2, we plot the total 3–150 keV X-ray flux during the preceding plateau vs the integrated radio flux of the superluminal flare. We derive a correlation coefficient of 0.99 suggesting a strong connection between the total X-ray flux during the preceding plateau state and the integrated radio flux of the superluminal flare. The total X-ray flux is dominated by the Compton scattered emission or coronal emission ( 85%). Using the total Compton scattered emission flux instead of the total X-ray flux improves this correlation with a correlation coefficient of 0.996. In Figure 3, we plot the QPO frequency from our timing analysis of X-ray data during the plateau state as a function of the decay time constant of the following superluminal radio flare. This also shows a tight correlation, with correlation coefficient of 0.98. The QPOs are believed to be associated with the coronal flow. The remarkable feature of our findings here is that the parameters calculated using completely independent spectral and timing analysis bring out a clear connection between the accretion disk during the plateau state and the following superluminal radio flare.
In the last column of Table 1, we give the calculated absorption column density NH. The NH ranges from 101022 to 151022 cm-2 which are higher than the commonly used NH 5 – 61022 cm-2 for spectral analysis of GRS 1915+105 . The calculated NH shows a tight correlation with the CompTT flux and not with the disk blackbody flux. This rules out the possibility that the enhanced NH may be due to overestimation of the disk normalisation. Yadav (2006) has discussed this in detail and compared these with results obtained from Chandra and ASCA data [27, 28]. Lee et al. (2002) have analysed Chandra & RXTE X-ray data during a radio plateau state and have suggested presence of disk wind. Kotani et al. (2000) also came to a similar conclusion using ASCA data. The wind terminal velocity is estimated to be of the order of 108 cm s-1 ( 0.01). The lower limit of bolometric luminosity Lbol LX = 6.41038 ergs s-1 which is 0.35 of Eddington Luminosity LEdd, for a black hole of mass 14 M⊙ [27]. The corresponding lower limit of bolometric luminosity for the X-ray flux listed in Table 1 falls in the range 0.35 – 0.48 of LEdd. When GRS 1915+105 is accreting near LEdd, the presence of a radiation-driven wind is always expected and the wind density should be a strong function of the disk luminosity. Our derived values of NH show strong dependence on observed total X-ray flux with correlation coefficient of 0.995 [30].
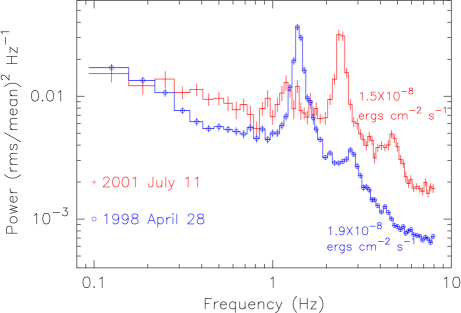
The calculated power density spectra shown in Figure 4 also independently lend support to the presence of wind during the plateau state. Figure 4 shows PDS spectra observed on 2001 July 11 and 1998 April 28. The Compton scattered flux increases from 1.510-8 ergs cm-2 s-1 on 2001 July 11 to 1.910-8 ergs cm-2 s-1 on 1998 April 28 while the observed QPO frequency decreases from 2.4 Hz on 2001 July 11 to 1.4 Hz on 1998 April 28. It is clear from Figure 4 that the power at frequency Hz is less in the PDS observed on 1998 April 28 than that observed on 2001 July 11. The fast variability is suppressed by photon scattering in the enhanced wind on 1998 April 28, hence reducing the power in the PDS at higher frequencies. Shaposhnikov & Titarchuk (2006) have discussed the decrease in the PDS power observed in Cyg X-1 at higher frequency ( 0.1 Hz) as the wind increases. In Cyg X-3, the PDS power in the low hard state drops to below 10-3 (rms/mean)2 Hz-1 at frequencies Hz as a dense wind from the companion always envelops the compact object [30].
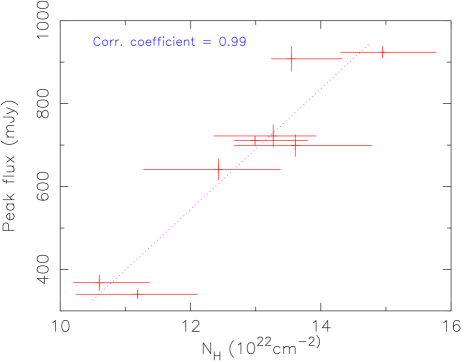
These results support the internal shock model for the origin of superluminal flares [31]. The internal shock should form in the previously generated slowly moving wind from the accretion disk with 0.01 as the fast moving discrete jet with 1 [8] catches up and interacts with it. Both the components, slow moving wind and fast moving jet, are related to the accretion disk during plateau state and the strength & speed of these two components will determine the power of the internal shock. The wind deposits a large amount of energy as approaches prior to the switch-on of superluminal flare [20]. Thus, the internal shock model can easily accommodate high jet power requirement 1038 ergs s-1 [14] and can explain the shifting from thick to thin radio emission during superluminal flares [31]. Our results in Figure 5 which shows the peak flux of superluminal radio flares as a function of NH strongly support our description of superluminal radio flares. A fit to the data (dotted line) suggests that for wind strength corresponding to N 8.31.51022 cm-2, no superluminal jet will be produced. The absence of superluminal jets during the class in GRS 1915+105 is attributed to the absence of wind [20]. The calculated NH during class is below this critical NH value [30]. This model of superluminal jets can provide simple explanations for (1) why the direction of superluminal jets may differ from the direction of the compact jets, (2) why the phase lag is complex during plateaux, and (3) why compact (discrete) jets are absent in Cyg X-3 [20].
In Figure 6, we show a sketch of the heliosphere due to disk wind and mark the locations of various types of radio emission seen in GRS 1915+105 . All the radio flares observed in GRS 1915+105 can be broadly put into two groups on the basis of their flux, radio spectrum and spatial distribution; (1) the superluminal flares (200–1000 mJy) which have steep radio spectra and are seen at large distances ( 240 AU), and (2) all other flares (5–360 mJy) which include the preplateau flares, radio oscillations & discrete flares and the steady radio emission during the plateaux. All these flares have flat radio spectra and are observed close to the compact object. All these radio flares are consistent with the ejection of an adiabatically expanding self absorbing synchrotron cloud from the accretion disk and this cloud is supposed to consist of coronal mass. During the radio plateau, it may be confined expansion due to the presence of a dense wind which agrees with the source size [8]. The IR & radio oscillations (5–150) are periodic ejections of adiabatically expanding self absorbing synchrotron clouds [13, 32]. The preplateau radio flares (50–360 mJy) are discrete ejections which are closely spaced in time and hence produce overlapped radio flares. The preplateau flares have been modeled as adiabatically expanding self absorbing clouds ejected from the accretion disk (like in the case of oscillations & discrete jets) which explain reasonably well all the available observed data of time delay for radio emission at lower frequency [32]. All these types of radio emission in GRS 1915+105 starts somewhere close to the corona.
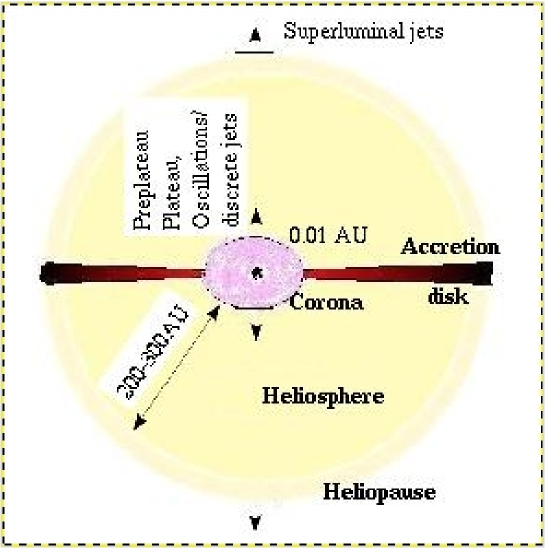
As discussed above, the , as inferred from the X-ray flux, is very high during the radio plateaux and Lbol approaches LEdd. It is suggested that such hot accretion disk during the radio plateaux always accompanies with a radiation-driven wind. The NH is tightly correlated with the COMPTT flux. This is analogous to the solar wind originating from the dense solar corona. Since the disk wind power & speed are higher than those of solar wind (the average solar wind speed 450 km/s), the size of heliosphere due to the disk wind may be around 200-300 AU (the solar heliosphere size is of 100-150 AU and it is supposed to vary with the solar activity). It is expected that the size of disk heliosphere will increase as the wind power increases with disk luminosity as discussed earlier. As shown in Figure 6, superluminal radio jets are suggested to appear at the boundary of disk heliosphere. It is expected that strong superluminal jets should appear at larger distances than the distance where weak superluminal jets appear. A superluminal jet with peak flux of 200 mJy was reported around 240 AU on 2001 July 16[23] while strong superluminal jets are suggested to appear around 500 AU (the peaks of these superluminal flares are not observed but the data are consistent with the above suggestion) [8]. This can be easily tested in future with VLBA and other high resolution radio data if we catch the start of superluminal flares in GRS 1915+105 as well as in other LMXBs.
4 Conclusions
We have provided a tight correlation between accretion disk and superluminal jet parameters. We find that during the plateaux is very high and suggest that the accretion disk during the radio plateaux is always associated with a radiation-driven wind. The internal shock forms in the previously generated slowly moving wind (during plateau) with 0.01 as the fast moving discrete jet (usually at the end of plateau) with 1 catches up and interacts with it. The strength & speed of these two components determine the power of the internal shock as well as of the superluminal jets. The peak flux of the superluminal jets is tightly correlated with the wind power. We discuss the implications of this work and some of these can be checked in future.
Acknowledgment: The author thanks the RXTE PCA/HEXTE and NSF-NRAO-NASA Green Bank Interferometer teams for making their data publicly available. The Green Bank Interferometer is a facility of the National Science Foundation operated by the NRAO in support of NASA High Energy Astrophysics programs.
References
- [1] Mirabel, I. F., & Rodriguez, L. F. 1994, Nature, 371, 46
- [2] Morgan, E. H., Remillard, R. A. & Greiner, J. 1997, ApJ, 482, 1010
- [3] Muno, M. P., Morgan, E. H. & Remillard, R. A. 1999, ApJ, 527, 321
- [4] Yadav, J. S., Rao, A. R., Agrawal, P. C, et al. 1999, ApJ, 517, 935
- [5] Belloni, T., Klein-Wolt, M., Mendez, M., et al. 2000, A&A, 355, 271
- [6] Muno, M. P., Remillard, R. A., Morgan, E. H., et al. 2001, ApJ, 556, 515
- [7] Fuchs, Y., Rodriguez, J., Mirabel, I. F. et al. 2003, A&A, 409, L35
- [8] Dhawan, V., Mirabel, I. F. & Rodriguez, L. F. 2000, ApJ, 543, 373
- [9] Ribo, M., Dhawan, V. & Mirabel, I. F. 2004, Proc. 7th European VLBI network symposium, p. 111
- [10] Gallo, E., Fender, R. P., & Pooley, G. G. 2003, MNRAS, 344, 60
- [11] Pooley, G. G. & Fender, R. P. 1997, MNRAS, 292, 925
- [12] Eikenberry, S. S., Matthews, K., Morgan, E. H., et al. 1998, ApJ, 494, L61
- [13] Mirabel, I. F., Dhawan, V., Chaty, S. et al. 1998, A&A, 330, L9
- [14] Fender, R. P., Garrington, S. T., McKay, D. J. et al. 1999, MNRAS, 304, 865
- [15] Hjellming, R. M., & Rupen, M. P. 1995, Nature, 375, 464
- [16] Wu, K., Soria, R., Campbell-Wilson, D., et al. 2002, ApJ, 565, 1161
- [17] Orosz, J. A., Kuulkers, E., van der Klis, M. 2001, ApJ, 555, 489
- [18] Fender, R. P., Belloni, T. M. & Gallo, E. 2004, MNRAS, 355, 1105
- [19] Fender, R. P. & Belloni, T. M. 2004, ARA&A, 42, 317
- [20] Yadav, J. S., 2006, ApJ, 646, 385
- [21] Klein-Wolt, M., Fender, R. P., Pooley, G. G., et al. 2002, MNRAS, 331, 745
- [22] Vadawale, S. V., Rao, A. R., Naik, S., Yadav, J. S., et al. 2003, ApJ, 597, 1023
- [23] Dhawan, V., Muno, M. P., Remillard, R., et al. 2003 preprint.
- [24] Rau, A., & Greiner, J. 2003, A&A, 397, 711
- [25] Rothstein, D. M., Eikenberry, S. S. & Matthews, K. 2005, ApJ, 626, 991
- [26] Yadav, J. S. 2001, ApJ, 548, 876
- [27] Lee, J. C., Reynolds, C. S., Remillard, R. , et al. 2002, ApJ, 567, 1102
- [28] Kotani, T., Ebisawa, K., Dotani, T., et al. 2000, ApJ, 539, 413
- [29] Shaposhnikov, N., & Titarchuk, L. 2006, ApJ, 643, 1098
- [30] Yadav, J. S., 2006, “Relativistic superluminal radio jets in microquasars in our galaxy” this conferece.
- [31] Kaiser, C. R., Sunyaev, R. & Spruit, H. C. 2000, A&A, 356, 975
- [32] Ishwara-Chandra, C. H., Yadav, J. S., & Pramesh Rao, A. 2002, A&A, 388, L33