Pulsation in the atmosphere of the roAp star HD 24712††thanks: Based on observations collected at the Canada-France-Hawaii Telescope (CFHT), at the Nordic Optical Telescope (NOT), at the European Southern Observatory, Paranal, Chile, (DDT-274.D-5011), at the Telescopio Nazionale Galileo (TNG), and from MOST, a Canadian Space Agency mission operated jointly by Dynacon, Inc., the University of Toronto Institute of Aerospace Studies, and the University of British Columbia, with assistance from the University of Vienna.
Abstract
Aims. We have investigated the structure of the pulsating atmosphere of one of the best studied rapidly oscillating Ap stars, HD 24712.
Methods. For this purpose we analyzed spectra collected during 2001 – 2004. An extensive data set was obtained in 2004 simultaneously with the photometry of the Canadian MOST mini-satellite. This allows us to connect directly atmospheric dynamics observed as radial velocity variations with light variations seen in photometry.
Results. We directly derived for the first time and for different chemical elements, respectively ions, phase shifts between photometric and radial velocity pulsation maxima indicating, as we suggest, different line formation depths in the atmosphere. This allowed us to estimate for the first time the propagation velocity of a pulsation wave in the outer stellar atmosphere of a roAp star to be slightly lower than the sound speed. We confirm large pulsation amplitudes (150 – 400 m s-1) for REE lines and the H core, while spectral lines of the other elements (Mg, Si, Ca, and Fe-peak elements) have nearly constant velocities. We did not find different pulsation amplitudes and phases for the lines of rare-earth elements before and after the Balmer jump, which supports the hypothesis of REE concentration in the upper atmosphere above the hydrogen line-forming layers. We also discuss radial velocity amplitudes and phases measured for individual spectral lines as tools for a 3D tomography of the atmosphere of HD 24712.
Key Words.:
stars: atmospheres – stars: chemically peculiar – stars: individual: HD 24712 – stars: magnetic fields – stars: oscillationsT. Ryabchikova at
1 Introduction
About 10 % to 20 % of upper main sequence stars are characterized by remarkably rich line spectra, often containing numerous unidentified features. Compared to the solar case, overabundances of up to a few dex are often inferred for some iron peak and rare earth elements, whereas some other chemical elements are found to be underabundant (Ryabchikova et al. 2004). Some of these Chemically Peculiar (CP) stars also exhibit organized magnetic fields with a typical strength of a few kG. The specific chemical peculiarities observed are believed to result from the influence of the magnetic field on the diffusing ions, possibly in combination with the influence of a weak, magnetically directed wind (e.g., Babel 1992).
More than 30 cool CP stars exhibit an additional peculiarity, which is high-overtone, low-degree, non-radial -mode pulsation with periods in the range of 6 – 21 minutes, with their observed pulsation amplitudes modulated according to the visible magnetic field structure. These so-called rapidly oscillating peculiar A to F-type (roAp) stars are key objects for asteroseismology, which presently is the most powerful tool for testing theories of stellar structure and evolution. Spectroscopic and photometric techniques provide information on the boundary zone relevant for any pulsation model, and open access to different modes and hence atmospheric layers. An observed phase lag between luminosity and radial velocity variations is an important parameter for a first step towards modeling the stellar structure. The dependency of radial velocity amplitudes as a function of optical depths lead to a 3D tomography of the stellar atmosphere.
The best studied multi-periodic roAp star presently is HD 24712, which makes this star a cornerstone for stellar seismology, even beyond the class of CP stars. It was discovered to be a pulsator by Kurtz (kurtz82 (1982)) with periods around 6 minutes, and Matthews et al. (MWWY88 (1988)) found synchronized radial velocity variations. Photometry with the Whole Earth Telescope (WET, Kurtz et al. kurtz02 (2002)) revealed a ‘missing’ mode, suggesting that -mode pulsation are strongly affected by the global stellar magnetic field, an aspect which was investigated in detail by Cunha et al. (cunha03 (2003)) and by Cunha (cunha06 (2006)).
These characteristics made HD 24712 a very strong candidate for contemporaneous spectroscopic observations with large ground based equipment suited to obtain high time resolution, high spectral resolution, and high signal-to-noise ratio spectra simultaneously with high precision photometric observations with MOST, the Canadian photometric space telescope (Walker et al. WMK2003 (2003)). The MOST instrument is a 15-cm Maksutov type optical telescope feeding twin CCD detectors through a broadband filter (350 – 700 nm). The equipment was designed to obtain rapid photometry of bright stars for up to 2 months and with a nearly 100% duty cycle. Despite its low mass of only 54 kg (and hence little inertia) it is able to perform optical photometry of point sources due to a pointing accuracy of better than ″ rms (Walker et al. WMK2003 (2003)).
| Set | Civil date | Start HJD | Spectral range | Run | No. of | Exposure | Overhead | Typical | Rot. | Instr. |
|---|---|---|---|---|---|---|---|---|---|---|
| No. | (UT) | (245 0000+) | (Å) | (hr) | spectra | time (s) | time (s) | phase | ||
| 1 | 2001.10.02 | 2185.15654 | 6106-6189 | 3.77 | 123 | 60 | 42 | 100 | 0.71 | GECKO |
| 2 | 2001.10.03 | 2186.15303 | 6106-6189 | 4.60 | 162 | 60 | 41 | 100 | 0.79 | GECKO |
| 3 | 2001.10.04 | 2187.15230 | 6620-6730 | 4.77 | 163 | 60 | 42 | 100 | 0.87 | GECKO |
| 4 | 2002.09.23 | 2541.08000 | 5822-5887 | 2.44 | 82 | 60 | 44 | 100 | 0.28 | GECKO |
| 5 | 2002.09.24 | 2541.16417 | 6543-6658 | 1.43 | 49 | 60 | 44 | 100 | 0.29 | GECKO |
| 6 | 2002.09.24 | 2542.02444 | 5822-5887 | 2.03 | 66 | 60 | 44 | 100 | 0.36 | GECKO |
| 7 | 2002.09.25 | 2542.11958 | 5284-5344 | 1.96 | 66 | 60 | 44 | 100 | 0.37 | GECKO |
| 8 | 2002.09.25 | 2543.05228 | 5822-5887 | 1.89 | 65 | 60 | 44 | 100 | 0.44 | GECKO |
| 9 | 2002.09.26 | 2543.14946 | 6105-6195 | 1.84 | 64 | 60 | 44 | 100 | 0.45 | GECKO |
| 10 | 2002.09.26 | 2544.14997 | 5822-5887 | 3.81 | 127 | 60 | 44 | 100 | 0.53 | GECKO |
| 11 | 2003.11.06 | 2949.69312 | 4540-9952 | 1.58 | 53 | 50 | 55 | 80 | 0.08 | SOFIN |
| 12 | 2004.11.11 | 3320.78693 | 3850-6730 | 2.31 | 92 | 60 | 30 | 120 | 0.87 | HARPS |
| 13 | 2004.11.12 | 3321.74421 | 3400-6720 | 2.09 | 92 | 50 | 30 | 300 | 0.94 | UVES |
| 14 | 2004.11.13 | 3322.77598 | 3400-6720 | 1.73 | 73 | 50 | 30 | 300 | 0.03 | UVES |
| 15 | 2004.11.15 | 3324.60032 | 4575-7872 | 1.07 | 35 | 60 | 52 | 120 | 0.18 | SARG |
| 16 | 2004.12.02 | 3341.66789 | 4575-7872 | 1.13 | 33 | 60 | 52 | 120 | 0.55 | SARG |
MOST observed HD 24712 continuously from Nov. 5, to Dec. 4, 2004, and a parallel ground based observing campaign was organized which yielded the spectroscopic time series listed in the last five lines of Table 1. While the main photometric results will be published elsewhere, we focus here on the spectroscopic analysis and are using MOST data primarily for a direct comparison of the data taken simultaneously in space and from ground.
2 Observations and spectra reduction
The observations of HD 24712 were collected during 13 nights: Oct. 2-4, 2001; Sept. 23-26, 2002; Nov. 6, 2003; Nov. 11-13, 15, and Dec. 2, 2004. The journal of observations is given in Table 1, which lists set numbers, civil dates, heliocentric Julian dates of the start of the observing sequence, spectral range, run duration in hours, and the number of spectra that were obtained in each night. The chosen exposure times are a compromise between the requirement to integrate the spectrum only over a small fraction of the pulsation period, and the need to have a reasonable signal-to-noise () ratio for each spectrum. The seventh column gives the rotation phases for the mean time of each data set according to the ephemeris given by Ryabchikova et al. (Period (2005)):
HJD( d.
Heliocentric Julian dates are given for the centre of exposures. The heliocentric corrections were applied to spectroscopic observations and to MOST photometry in the same way.
2.1 Time-series of single-order spectra
GECKO: The observations of 2001 and 2002 were obtained with the single-order GECKO coudé spectrograph and the EEV1-CCD at the 3.6-m Canada-France-Hawaii telescope. The spectra have a resolving power of about 115 000, determined from the widths of a number of ThAr comparison lines. The exposure time was 60 s, dead time was 44 s, and the achieved in the continuum was about 100. These observations covered 7 spectral regions centered approximately at 4860, 5300, 5855, 6160, 6600, 6675, and 7780 Å, containing the most interesting spectral lines of singly and doubly-ionized rare earth elements (REE), H, H, O i, Fe i, Ca i, and Ba ii.
The spectra were reduced using standard IRAF tasks. Each stellar, flat and calibration frame had a mean bias subtracted and was then cleaned of cosmic ray hits and collapsed to one dimension. The spectra were divided by a mean flat-field, extracted in the same way, and the continuum was fitted with a three-segment cubic spline, using the same rejection parameters for all spectra so that the continuum fit is as uniform as possible.
The wavelength scale was established using about 40 lines of a ThAr emission lamp, resulting in an rms scatter of about Å. The wavelength scale was linearly interpolated between ThAr lamp spectra taken before and after the stellar series, but the spectra were not sampled to a linear wavelength spacing.
2.2 Time-series of échelle spectra
SOFIN: The observations from Nov. 6, 2003, were carried out with the SOFIN high resolution échelle spectrograph at the 2.56 m Nordic Optical Telescope (NOT), La Palma, Spain. Each spectrum had an integration time of 50 s with a readout time of 55 s, giving a time-resolution of 105 s. The typical ratio is about 80 and the resolving power 80 000. These échelle spectra cover the region from 5000 to 6800 Å. The échelle images were reduced with the Advanced Acquisition, Archiving, and Analysis (4A) package written in C (Ilyin II00 (2000)).
The standard reduction sequence includes bias subtraction from the CCD overscan, photon noise estimation for the pixel variances, correction for the CCD fixed pattern noise using a master flat field (a sum of 100 exposures), subtraction of the scattered light determined from a 2D spline fit to the inter-order gaps. The spectral order position is found from the flat field image and subsequently adjusted for each échelle science frame. This step is followed by a weighted extraction of spectral orders with elimination of cosmic spikes based on a linear regression. The shape of the spectra and fringes in the red part of the CCD are corrected with a flat field spectrum smoothed with a spline fit. The wavelength calibration is based on about 1 300 ThAr spectral lines collected from two successive images, using a 2D fit to them, taking also the time of exposures for calibration and science frames into account. A zero point correction had to be applied which resulted in a final RV error of about 25 m s-1 at the image center.
HARPS and UVES: The 2004 spectroscopic observation were carried out with HARPS (High Accuracy Radial velocity Planet Searcher) spectrometer at the 3.6-m telescope at ESO, La Silla. 92 spectra with 60 s exposure time, S/N = 120, and 120 000 resolving power were taken during November 10/11, 2004, simultaneously with MOST. Because of the unique coincidence with the space photometry, Director’s Discretionary Time (274.D-5011) was granted for November 11/12 and 12/13 with the UVES spectrograph at the 8.2-m telescope, UT2 (Kueyen), of the VLT on Paranal, Chile, (92 & 73 spectra, 50 s exposure time, S/N = 300, with a resolving power of about 80 000).
All spectra were reduced and normalized to the continuum level with a routine specially developed by one of us (DL) for a fast reduction of time-series observations. It is a component of the spectral reduction package STAR XP, a special modification of the Vienna automatic pipeline for échelle spectra processing (Tsymbal et al. tsymbal (2003)). All bias and flat field images were median averaged before calibration. The scattered light was subtracted by using a 2D background approximation. For cleaning of cosmic rays we used a new algorithm which compares the direct and reversed spectral profiles. To determine the spectrum order boundaries, the code uses a special template for each order position in each row across the dispersion axis. The shift of the row spectra relative to the template is derived by a cross-correlation technique. Wavelength calibration was done by the usual 2D fit. The accuracy of this procedure is 20 m s-1. The final step of continuum normalization was done by transforming of the flat field blaze function to the response function in each order.
SARG: During MOST observations of HD 24712, additional spectra were obtained in Nov. 14/15, 2004, (35 spectra), and on Dec. 01/02, 2004, (33 spectra), with the high resolution spectrograph (SARG) at the 3.55-m Telescopio Nazionale Galileo (TNG) at the Observatorio del Roque de los Muchachos (La Palma, Spain). The spectra were reduced using standard ESO-MIDAS software with the same main steps as described above. The spectra cover the range of 4570 – 7900 Å, have a resolving power of about 57 000 and a S/N ratio of approximately 120. The time resolution was 129 s (60 s for exposure and 69 s for read out).
2.3 Polarimetry with SOFIN
The spectropolarimetric observations of HD 24712 were carried out between Oct. 29, and Nov. 18, 2003, with the high resolution échelle spectrograph, SOFIN, attached to the Cassegrain focus of NOT. The spectrograph is equipped with three different cameras offering three different resolving powers. To obtain observations in the polarimetric mode, the second camera with a resolving power of 80 000 was used. Between 4000 – 7000 Å seven spectral orders, each covering about 40 to 50 Å were used for the magnetic field analysis.
| HJD | Rotation | (G) | |
|---|---|---|---|
| (245 0000+) | phase | Nd ii, Nd iii | Cr i, Cr ii, Fe i |
| 2941.6516 | 0.44 | ||
| 2943.6341 | 0.60 | ||
| 2945.5758 | 0.76 | ||
| 2946.5973 | 0.84 | ||
| 2947.6067 | 0.92 | ||
| 2948.6514 | 0.00 | ||
| 2952.6267 | 0.32 | ||
| 2953.6572 | 0.40 | ||
| 2954.6316 | 0.48 | ||
| 2955.6350 | 0.56 | ||
| 2956.5954 | 0.64 | ||
| 2957.5958 | 0.72 | ||
| 2961.6160 | 0.04 | ||
The circularly polarized spectra were obtained with a Stokesmeter, consisting of a fixed achromatic quarter-wave plate, a beam splitter made of a calcite plate, and an achromatic rotating quarter-wave plate, whose position is controlled by a stepping motor. To obtain accurate circular polarization measurements, usually a sequence of four exposures is obtained. Each of the beams is exposed twice, with the quarter-wave plate rotated by after the first and before the last exposure. Such a sequence reduces instrumental effects to a minimum, because in the images taken with the quarter-wave plate rotated by , instrumental signatures change sign and cancel when averaging the two exposures.
Data reduction was performed with the aforementioned 4A software package including all standard procedures, such as bias subtraction, flat field correction, subtraction of the scattered light, weighted extraction of the orders, and bad pixel (cosmic ray) corrections. ThAr exposures obtained before and after each observing night were used to perform wavelength calibration and to test for possible spurious instrumental polarization, caused e.g. by bending of the spectrograph which is directly mounted on the telescope, different positions of the star on the slit, or temporal variations of the seeing. S/N ratios for the observed spectra are typically 200 – 300. Rotation phases of HD 24712 (see Table 2) were calculated according to the ephemeris and rotation period derived by Ryabchikova et al. (Period (2005)).
3 Radial velocities and magnetic field strength
For radial velocity (RV) measurements we carefully chose unblended or minimally blended lines in the 3300 – 6800 Å spectral region. Between 3900 and 4400 Å the cores of the strong (resonance) lines of Ca, Fe and Sr were measured. Our choice was based on synthetic spectrum calculations over the whole spectral region of 3300 – 6800 Å, made with the spectral synthesis code synth3 written by Kochukhov, and using the atmospheric parameters and abundances from Ryabchikova et al. (RL97 (1997)). Atomic parameters of spectral lines for the synthesis were extracted from the Vienna Atomic Line Database, VALD (Kupka et al. VALD2 (1999)), and from the Database for Rare Earths at Mons University, DREAM (Biémont et al. dream99 (1999)), which is also accessible via the VALD extraction procedures. For the Nd iii identification additional atomic data from Crosswhite (Crswt (1976)), Aldenius (Ald01 (2001)) and Ryabchikova et al. (Nd3 (2006)) were used.
The radial velocities were measured with a center-of-gravity technique and attention was payed to the stability of the spectrographs. HARPS time-resolved spectra provide stable results with a mean rms dispersion of 20 m s-1 per individual non-pulsating line, while a quasi-linear, long-term drift was found in both nights of the observations with UVES. These drifts were approximated with a smooth spline function based on the average measurements of a few unblended non-pulsating Fe i lines. This quasi-linear drift was then subtracted from the RV measurements of all other spectral lines. It should be emphasized that the instrumental variation of the spectrograph’s zero point occurs on a much longer time scale than the stellar p-mode variability, and therefore does not affect the pulsation analysis presented here.
Radial velocities of more than 500 unblended spectral lines were measured in the spectral region from 3900 to 6800 Å, and additional 80 lines were measured in the region blueward the Balmer jump (BJ). A complete list of measured lines (but not all individual measurements) together with their identification is given in Table LABEL:puls (Online material). The purpose of this table is to provide line identifications and to indicate pulsating and non-pulsating lines.
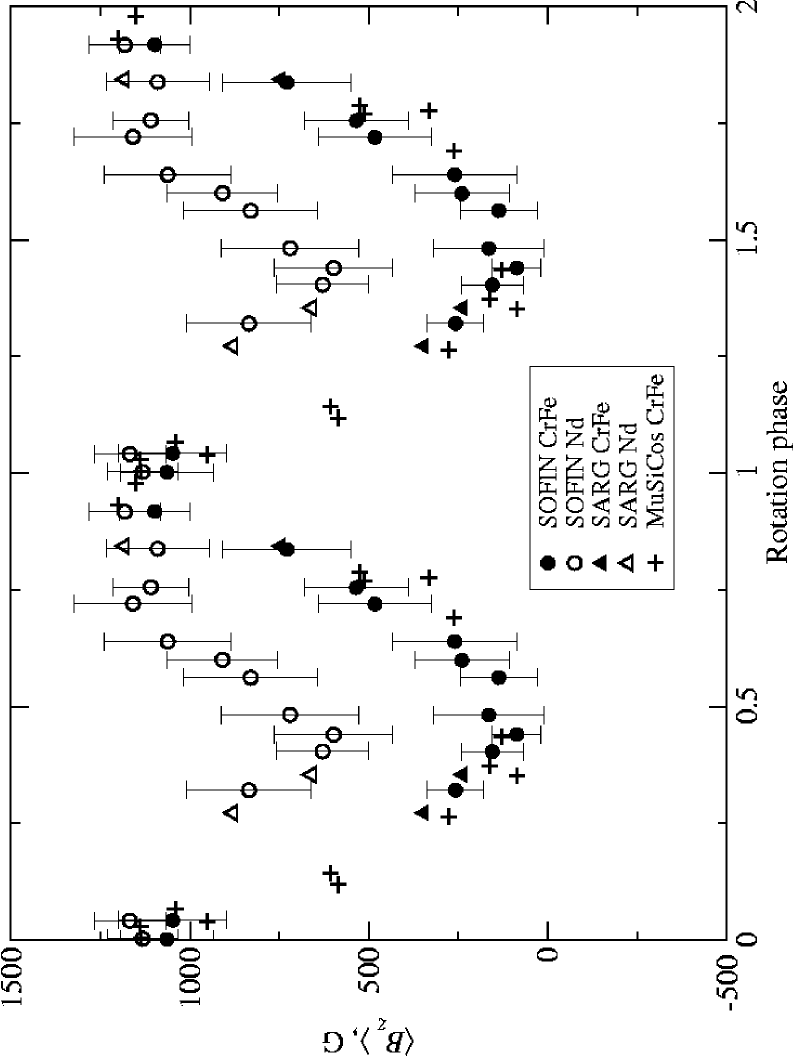
The longitudinal magnetic field was measured as the first moment of the observed Stokes V parameter for a set of chosen spectral lines. We have performed separate measurements of the iron-peak elements (Cr and Fe) and of the REEs (Nd and Tb). The results and error estimates are given in Table 2 and are illustrated in Fig. 1. For a comparison, data from Ryabchikova et al. (Period (2005) – MuSiCoS) and from Leone & Catanzaro (LC04 (2004) – SARG) are also included in this figure.
We found that some spectral lines with large Landé factors are partially split in non-polarized spectra. In particular one line, Cr i 5247.56 Å, is a pure triplet with = 2.51, and another line, Fe ii 6432.48 Å, is a pseudo-doublet with = 1.82. Using these lines we estimated the magnetic modulus at phases 0.867, 0.944 (close to the magnetic maximum) and at phase 0.42 (near the magnetic minimum). For the latter, a UVES spectrum of HD 24712 was extracted from the ESO archive. estimates were made by fitting calculated synthetic line profiles to the observed spectra. Magnetic synthetic calculations were carried out with SYNTHMAG (Kochukhov K06 (2006)), which represents an improved version of the program described by Piskunov (P99 (1999)). varies between 3100 – 3300 G at max and 2500 G at min according to our estimates.
4 Frequency analysis
Although RV variations in the REE lines due to pulsation are very distinctive and the relative accuracy of individual spectroscopic data is higher than for photometry, it proved to be difficult to study in detail the frequencies of multiperiodic roAp stars by spectroscopy, because a large telescope is needed during an extended period of time. For a reliable frequency analysis it is necessary to observe continuously during weeks with a minimum of gaps. This is possible either with dedicated satellites, as is MOST for photometry, or with multisite ground based campaigns, such as WET (Kurtz et al. kurtz05 (2005)). Although our spectroscopic monitoring does not allow for a detailed frequency analysis, we performed nevertheless such an analysis to confirm the consistency of the main frequencies in the spectroscopy obtained simultaneously with the MOST photometry.
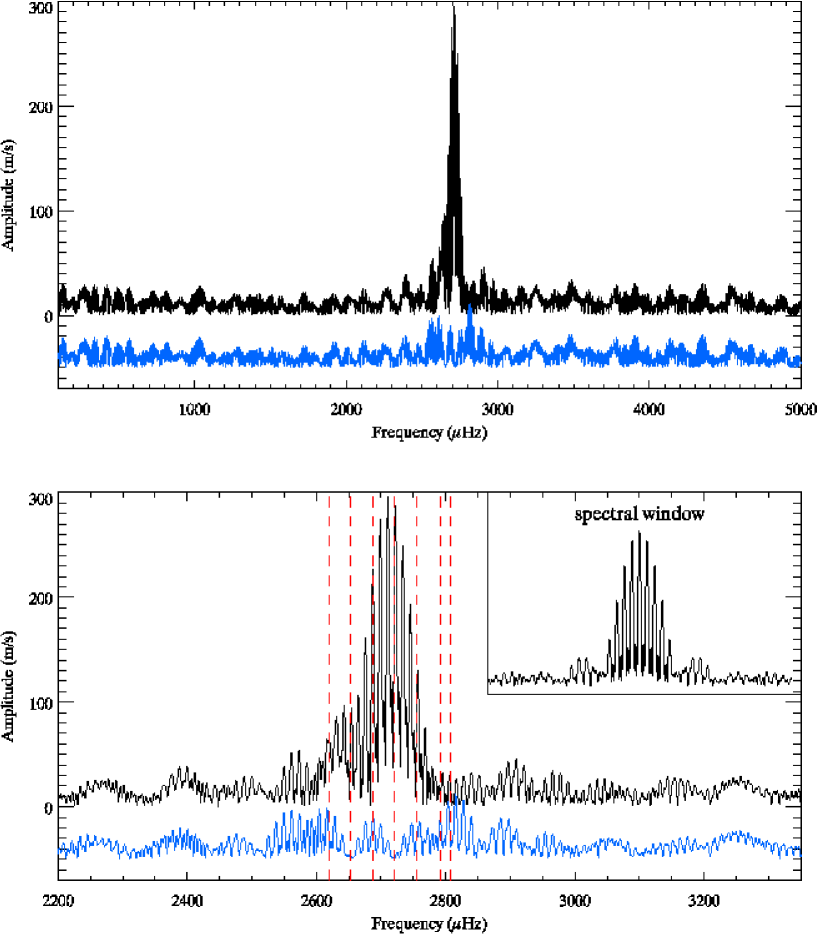
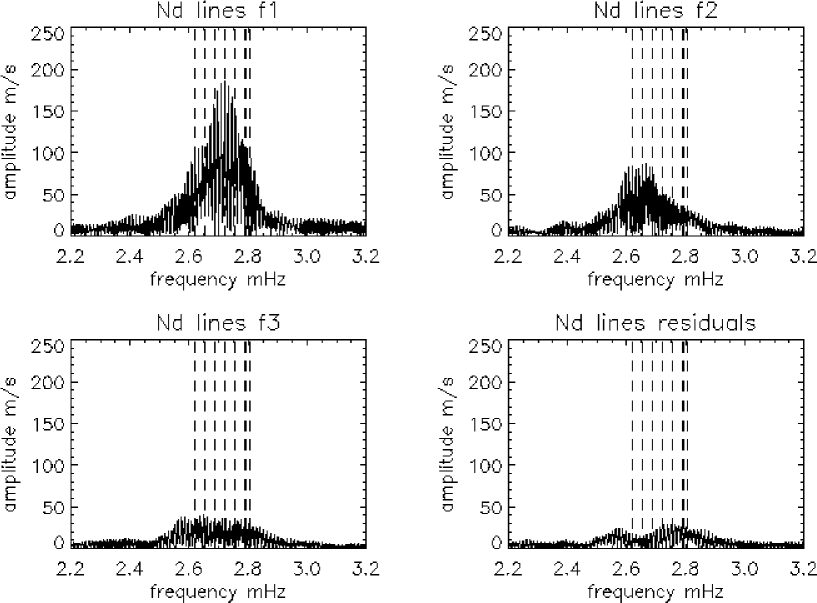
Our Fourier analysis of the RV data of selected lines – Pr iii 5284, 5300 Å, Nd iii 5203, 5294, 5845, 5851, 5987, 6145 Å and Tb iii 5505 Å – was based on a discrete Fourier transform (DFT) and stepwise prewhitening with a sine fit to the highest amplitudes (see Fig. 2). In this analysis we used all spectra obtained simultaneously with MOST during four nights around the magnetic maximum (sets 12 to 15). The duty cycle for this combined 4-night data set is poor (about 8%), but knowing from MOST photometry which alias to avoid, we found the 3 highest amplitude periods in our spectroscopy to be 6.125 min, 6.282 min, and 6.202 min. These values agree well with contemporaneous MOST photometry, as is illustrated in Figure 3 for one of the pulsating lines (Pr iii 5300 Å). These frequencies correspond to , , and in Kurtz at al. (kurtz05 (2005)). The frequency analysis performed for the 2001 Nd iii data gives two main frequencies and (identification according to Kurtz et al., op.cit.) with similar amplitudes as in 2004 (see Fig. 9 in Online Material). This figure illustrates (as does Fig. 2) the possibility to identify pulsation frequencies, amplitudes and phases even in short spectroscopic runs distributed over several nights – what results in a very poor duty cycle – provided one can avoiding aliases thanks to MOST and WET photometry.
The short observing run in 2003 does not allow us to resolve frequencies. Only one frequency close to was derived.
Different authors prefer to characterize periodic signal either with periods or with frequencies. For convenience of the reader we mention here the conversion: period in minutes transforms to a frequency in mHz via (mHz) = 16.6667/P(min).
5 Phase relations between photometry and spectroscopy
Our time-resolved observations in 2004 were carried out simultaneously with the Canadian micro–satellite MOST which monitored HD 24712 from 2004 November 6, to December 5. This provides us with the opportunity to derive directly the phase lag between photometry and spectroscopy.
This was attempted already earlier by Matthews et al. (MWWY88 (1988)) despite a rather poor S/N ratio ( 20) of their individual spectra. But the large number of spectra ( 600) allowed the authors to derive an average RV curve and to find a coincidence of RV maxima with B minima, which corresponds to a phase lag of about 0.5, where we define a phase lag as a phase difference between the maxima of both, photometric and RV variations. They found the photometric maximum to occur typically the RV maximum, which we confirm with our data.
The high S/N and spectral resolution of the present observations resulted in more precise values for phase lags, and in particular it allowed us to determine this quantity for individual spectral lines. In order to minimize the influence of the higher point-to-point scatter of the photometric data with respect to the spectroscopic observations, we computed an artificial time-series data set based on the 3 dominant frequencies and their amplitudes and phases (, and ) which were derived from the complete set of MOST observations. Next, this artificial time-series was cross-correlated with the RV observations of the individual spectral lines. The time interval for the cross correlation ranges from plus to minus 6.125 minutes, the latter corresponds to the period with the largest amplitude (). The time step was 1 second. The best correlation gives the time lag between photometry and spectroscopy expressed in seconds.
The time lags obtained with artificial time-series data generated with the 3 dominant frequencies differ only by 2 sec from those obtained with a full set of frequencies which is about an order of magnitude less than the accuracy of the used correlation technique. The remaining frequencies in the full MOST frequency solution with very low amplitudes obviously do not affect the time lag determination.
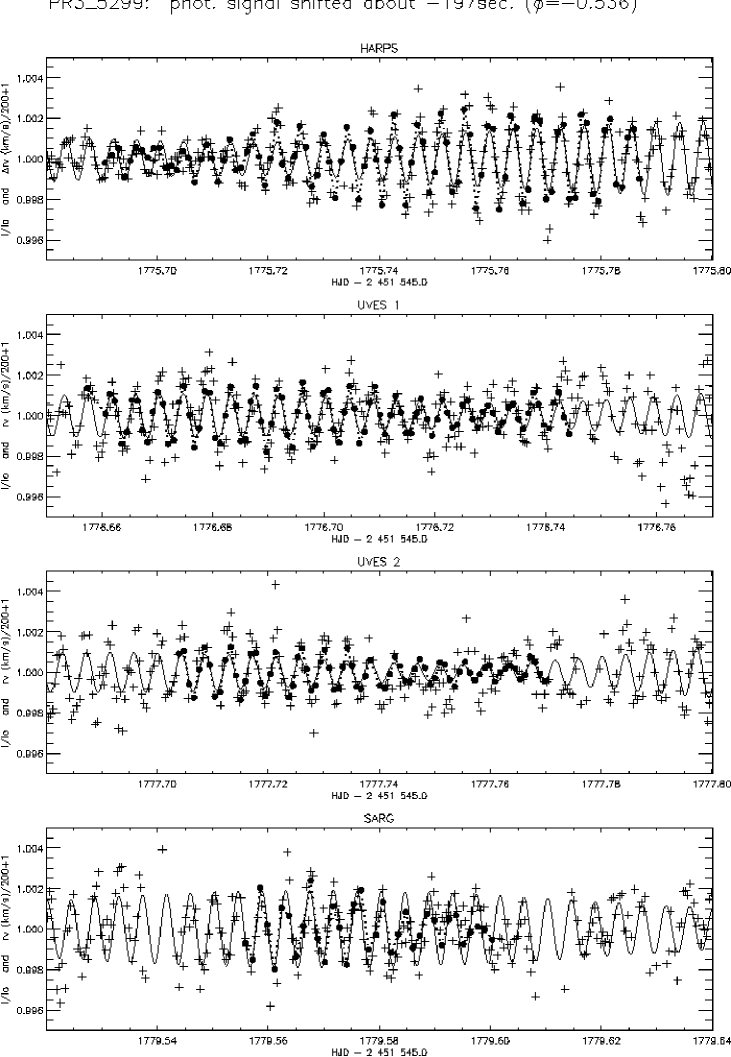
In Fig. 3 we illustrate the excellent agreement between the RV variations of the Pr iii spectral line and the photometric observations, shifted by about -197 sec, which corresponds to a phase lag of -0.54, using the main photometric pulsation frequency. Both observations are normalized and scaled for better visibility.
The result of the cross-correlation procedure is given in Table 3. The brightness maximum occurs for all lines after the RV maximum, but the phase lag itself depends strongly on the individual line. It is largest for the H line, which has a minimal RV amplitude of 91 m s-1, and gradually decreases for lines showing higher amplitudes. It will be shown in a following paper that this gradual change in phase lag is probably connected with line formation in the atmosphere.
| Line | (Å) | Phase lag | |
|---|---|---|---|
| in seconds | in periods | ||
| H | 4861 | -35625 | -0.970.08 |
| Eu ii | 6645 | -35622 | -0.970.06 |
| Nd ii | 6650 | -31322 | -0.850.06 |
| H | 6563 | -30722 | -0.840.06 |
| Nd iii | 5286 | -30121 | -0.820.06 |
| Nd ii | 5255 | -29721 | -0.810.06 |
| Nd iii | 6690 | -29422 | -0.800.06 |
| Nd iii | 5851 | -28322 | -0.770.06 |
| Dy iii | 5730 | -27822 | -0.760.06 |
| Nd iii | 5845 | -27021 | -0.730.06 |
| Nd iii | 5203 | -25521 | -0.690.06 |
| Nd iii | 5294 | -24722 | -0.670.06 |
| Pr iii | 5300 | -19721 | -0.540.06 |
| Tb iii | 5505 | -10422 | -0.280.06 |
6 Radial velocity variations of individual elements
For all measured lines we did a period search with the periodogram method. This analysis allowed us to crudely estimate the probability that a given period is true (Horne & Baliunas horne (1986)), They developed an algorithm which applies to fully resolved frequency spectra. The results – RV amplitudes with the error, period and error, and probability of the period – are given in Table LABEL:puls (Online Material). HJD = 2453320.0 was chosen as a reference time for our pulsation analysis. It is remarkable that the weighted mean from all periods with a probability higher than 0.99 determined from individual lines yields exactly the value of the most prominent photometric period observed in 2000 – 2004, which is P = 6.125 min.
The large number of measurable lines of different chemical species allows for a detailed analysis of pulsation waves in the atmosphere of HD 24712, but which will be presented in a follow up paper. Here we discuss briefly pulsation properties derived for different chemical elements.
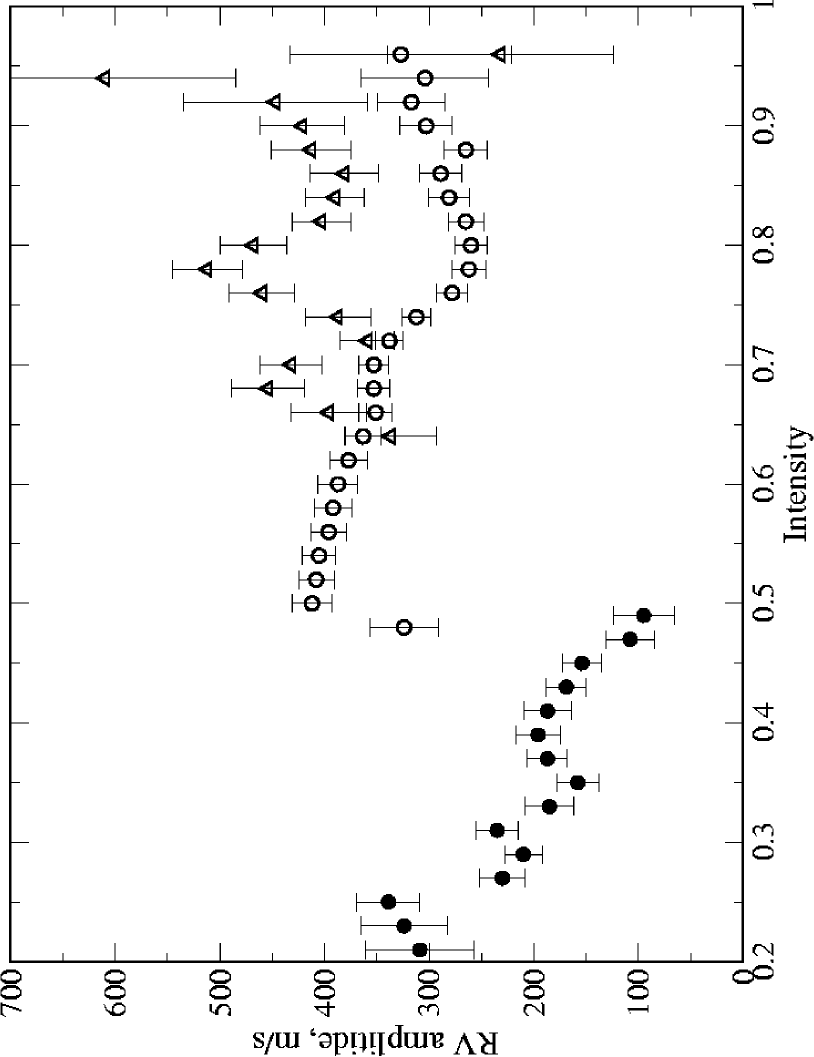
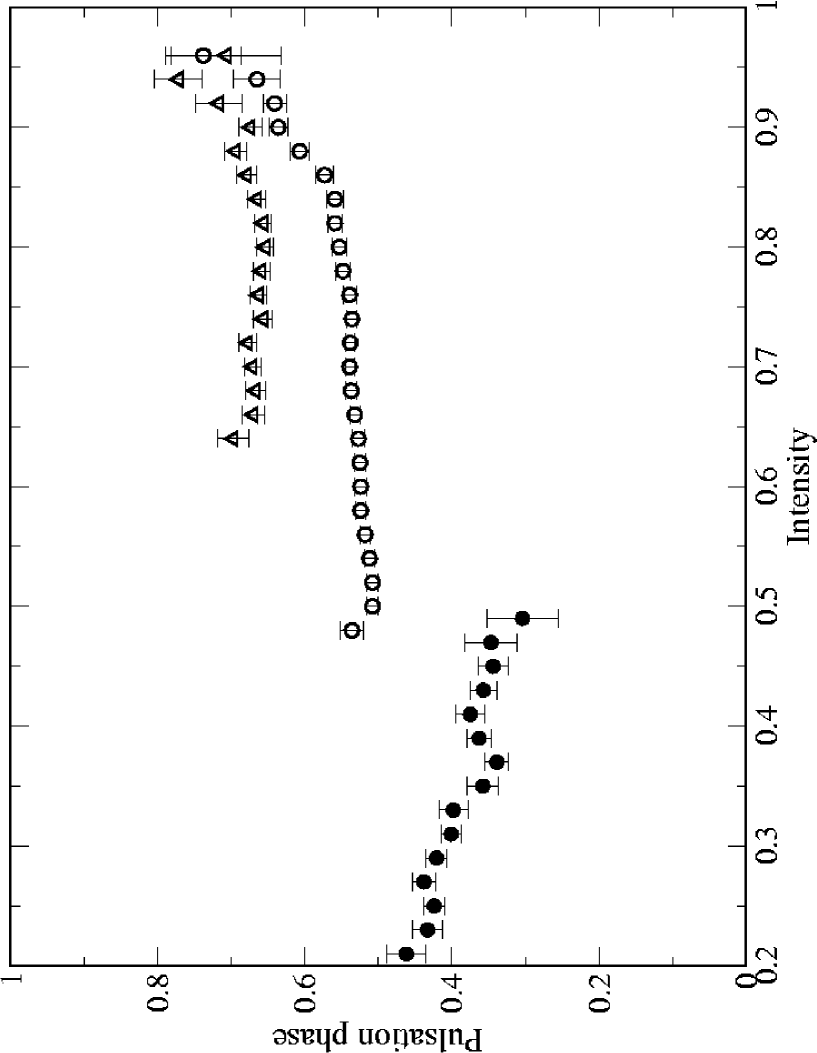
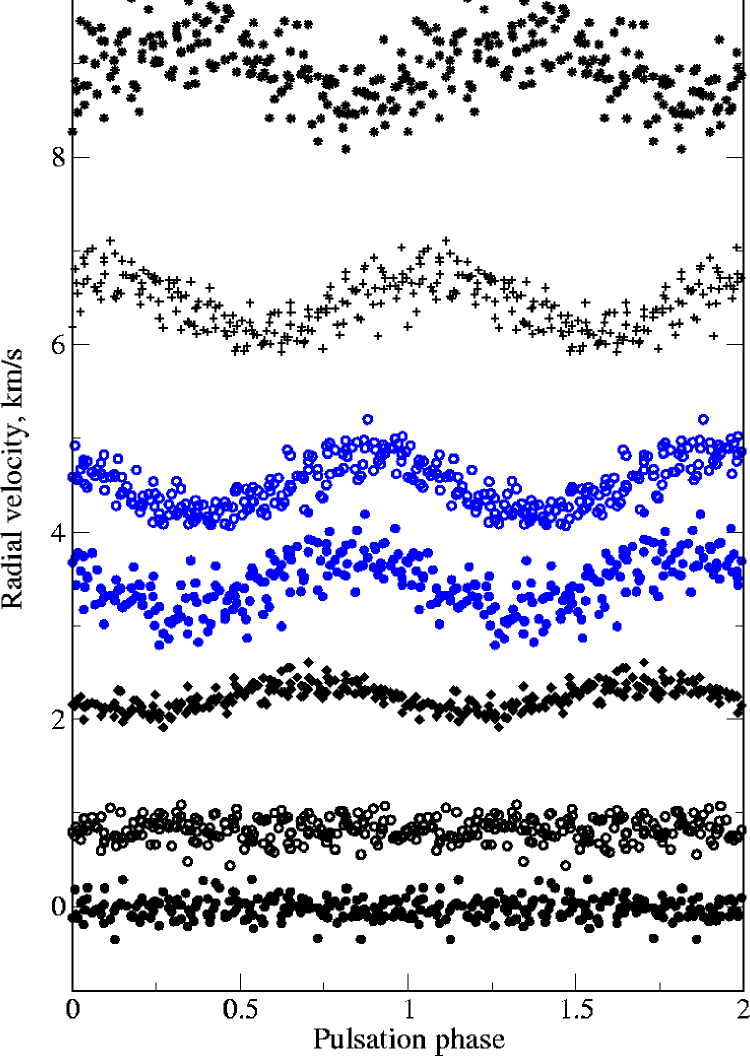
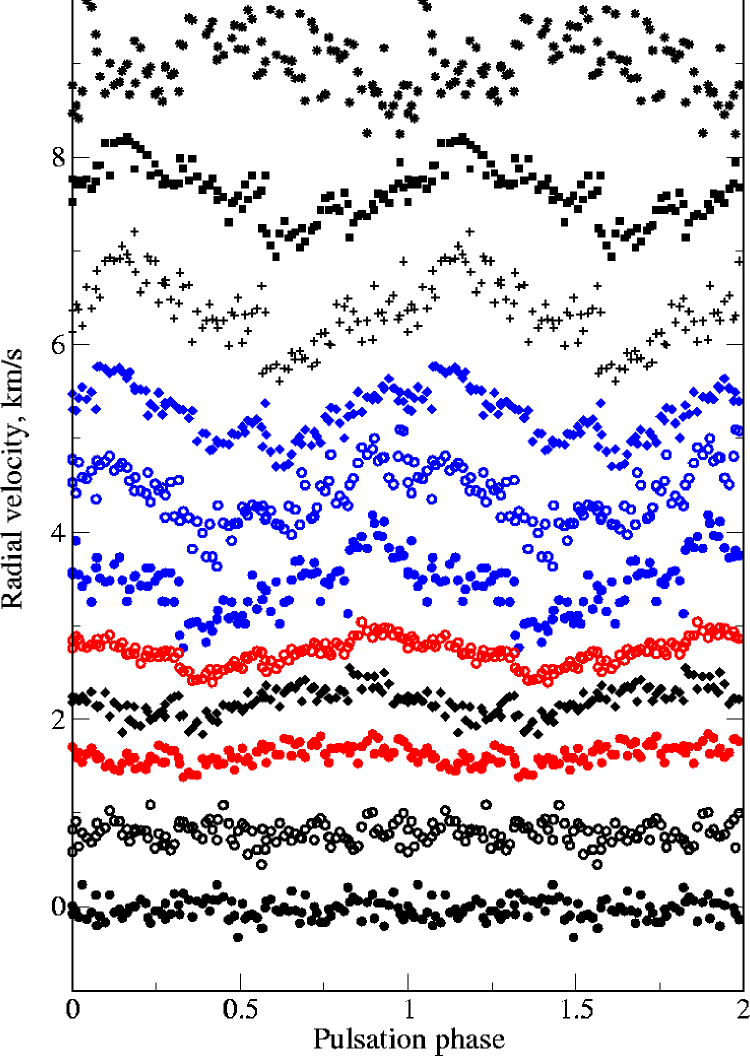
Hydrogen: H, H and H cores indicate pulsation with the amplitude increasing from H to H. Our measurements support the results obtained by Balona & Laney (alcir (2002)) for Cir and by Balona (hr3831 (2002)) for HR 3831, and all together they provide a direct evidence for the growth of pulsation amplitudes towards the upper atmospheric layers. Bisector measurements of the H line are shown in Fig. 4 (RV amplitudes – right panel, phases – left panel). Both, amplitudes and phases increase with line depth, i.e. towards the upper atmospheric layers as is observed also in other roAp stars (for example Cir, Baldry et al. acir (1999); Equ, Sachkov et al. 2004a ; or HD 99563, Elkin et al. EKM05 (2005)).
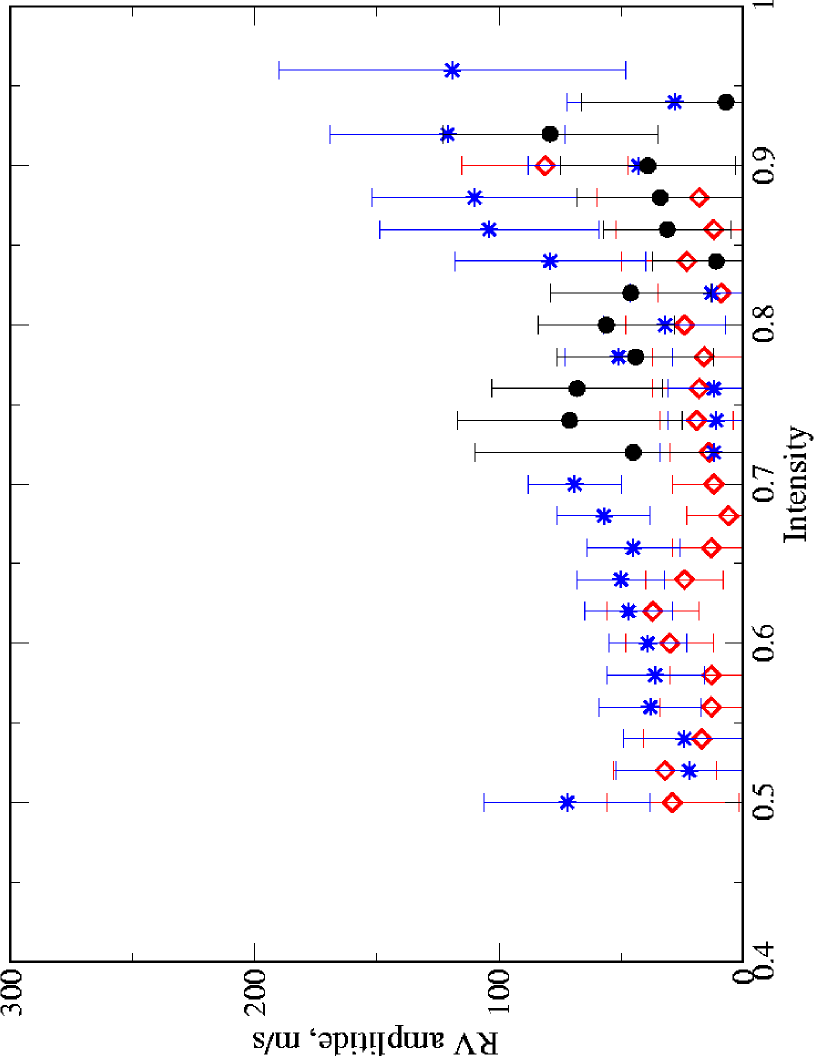
Na, Mg, S and Si: Lines of these elements do not reveal any pulsation. The upper limit for the RV amplitudes ranges from 10 to 30 m s-1, depending on the line strength and hence accuracy of measurements. Bisector measurements across the Mg i 5172 Å line (Fig. 5) also rejects variability with an amplitude above 40 m s-1. With the exception of the bisector close to the continuum (r = 0.96) we never recover the true pulsation period in a periodogram. The pulsation signal at r = 0.96 is explained by a La ii blend in the red wing of the Mg i line. A significant pulsation amplitude was also measured in the 4696.20 Å line, which coincides with a S i feature, but which may be attributed to an unclassified Nd iii line at 4696.205 Å. The latter information is from the unpublished lists of Crosswhite (Crswt (1976)) which were the main source for official NIST data on Nd iii energy levels (Martin et al. NBS-REE78 (1978)).
Fe-peak elements: About half of the measured Ca lines show oscillations compatible with the photometrically observed pulsation periods. In four cases we found a signal with 96% significance, among which is the core of the resonance Ca ii 3933 Å line, obviously formed high in the atmosphere. Bisector measurements across the Ca i 6122.22 Å line are shown in Fig. 5. Although this line indicates weak variation with a period of 6.125 min (and a probability of 0.82%), the bisector variations do not differ from those of constant Mg i and Fe ii lines. A small unknown blend of a REE would be enough to produce a spurious, very low amplitude variation in even a strong, but non-pulsating line (see below).
Three out of 5 Sc ii lines show pulsation, but they all are blended with REE lines. Similarly, nine out of 21 measurable Ti lines show small amplitude variations with the known pulsation period. The Ti ii 4501.26 Å line is blended with Nd iii 4501.23 Å which contributes to about 25% of the total line intensity, thus resulting in the pulsation signal with the typical phase of Nd lines.
Cr, Mn, Fe, and Co lines do not pulsate. Only 25% of the whole set of measured lines have pulsation periods typical for HD 24712, and part of these lines are blended with lines of REEs. Figure 6 displays RV amplitudes derived from sine-fits to lines of Fe-peak elements with a pulsation period of 6.125 min, and as a function of central residual intensities. We can conclude the absence of pulsation with amplitudes exceeding 15 m s-1 in the whole atmospheric range where Fe-peak lines are formed. An apparent increase of the RV amplitude for weaker lines simply reflects a reduced accuracy of the measurements.
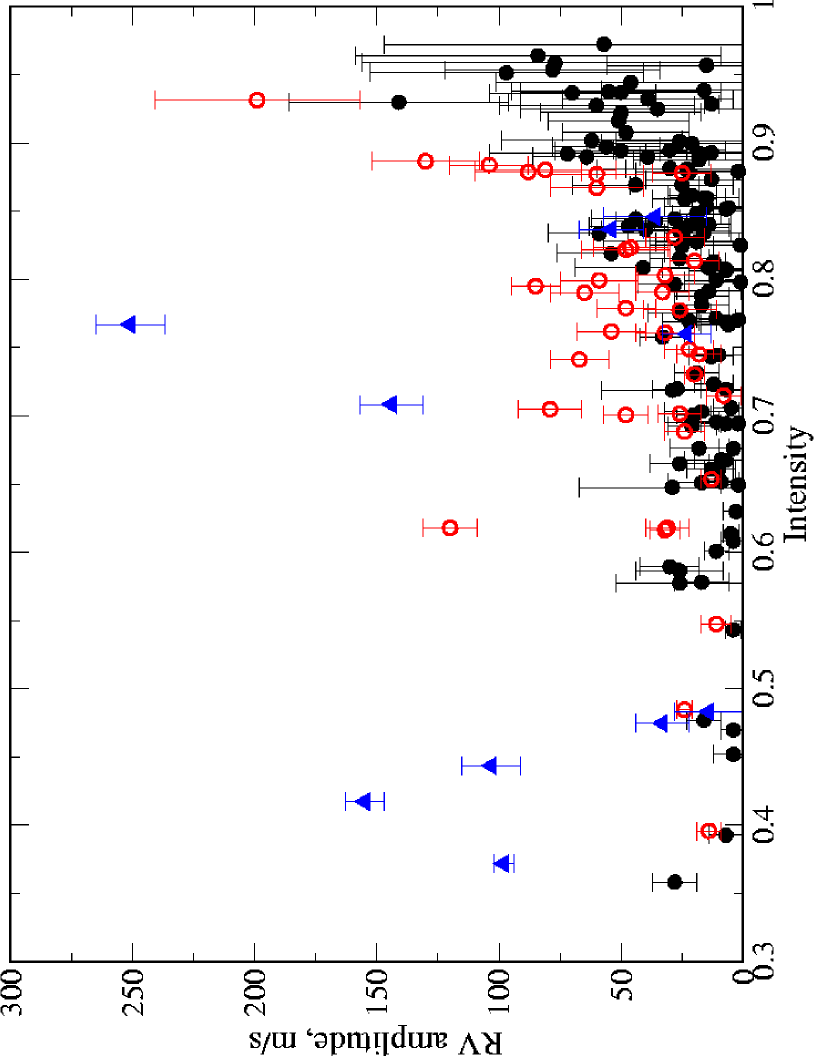
A few lines of the Fe-peak elements have rather large RV amplitudes (triangles in Fig. 6) and in most cases this is a result of blending with a REE. Two spectral lines at 5208 Å and 5429 Å are of particular interest, because they are usually identified as Cr i and Fe i lines, respectively, and their pulsation characteristics attributed to these elements (e.g., Elkin et al. EKM05 (2005)). Actually, these lines are heavily blended with Pr iii 5208 Å and Nd iii 5429 Å, respectively, and consequently show typical REE pulsation phases, but with reduced amplitudes.
Sr to Ba: Spectral lines of Sr, Y, Zr, Rh, Pd, In and Ba were measured in the spectrum of HD 24712. Five Ba ii lines are constant to within 10 m s-1, as are also lines of Rh i and Pd i. A spectral feature at 4511.26 Å, identified as In i 4511.31 Å, may be blended with an unclassified line of Ho (Crosswhite Crswt (1976)). Pulsation is seen in Sr ii lines and in five out of 11 lines of Y ii. We carefully checked for blends and can exclude this possibility as explanation for a pulsation signal. Pulsation does not appear in weaker lines of Y ii and there is a definite dependence of the RV amplitude and phase on line intensity. It seems that Y ii lines originate in the atmosphere where lines with high pulsation amplitudes just start to be formed.
Rare Earth elements: We have measured 260 lines of 13 REEs in the first and the second ionization stage. Almost all of them show pulsation with large amplitudes and different pulsation phases, depending on the species and line intensity (see also Table 3). Bisector measurements at different (continuum normalized) intensity levels of two representative lines, Nd iii 5294 Å and Pr iii 5300 Å, are shown in Fig. 4. Although RV variations are present, they are not as large as in the roAp star Equ (Sachkov et al. 2004a ). No difference in the pulsation signature is found for lines of the same element/ion located on both sides of the Balmer jump. For example, two Nd iii spectral lines, 3603 and 6145 Å, formed at approximately the same depth in the stellar atmosphere according to Mashonkina et al. (MRR05 (2005)) have RV amplitudes of 185 and 194 m s-1, and pulsation phases of 0.74 and 0.79, respectively (data set 13, UVES).
Thorium: Two lines identified as Th iii were measured, but no significant pulsation was detected. Using equivalent width measurements and the model atmosphere from Ryabchikova et al. (RL97 (1997)), we estimate a Th abundance of = . Oscillator strengths for Th iii lines were taken from Biémont et al. (Th3 (2002)). The thorium abundance in HD 24712 is comparable to that in HD 101065 (Cowley et al. HD101065 (2000)), and the thorium overabundance in the atmosphere is similar to the overabundance of most REE obtained from the first ions. Note, that Th abundance in both stars, HD 24712 and in HD 101065 has been derived using partition functions (PF) from Kurucz’ ATLAS9 code.
Unidentified lines: Along with lines of well established identification we measured all unidentified features with equivalent width 10 mÅ. The total number of these lines is 115, and about one third of them coincide with the position of Nd iii lines from Crosswhite’s unpublished list. Because they are not yet classified, we consider them as unidentified lines requiring a proper identification. Most of these potential Nd iii lines have pulsation phases in the range of 0.4 to 0.5, corresponding well to the classified Nd iii lines. Only one line at 4748.17 Å does not show pulsation variations, all other lines reveal pulsation with the typical amplitudes and phases of REEs. We conclude that plenty of still unknown REE lines are present in the spectra of roAp stars.
The ability to constrain classification of unidentified lines on the basis of their pulsation amplitudes and phases and thus provide useful information for laboratory studies is worth mentioning. This is a unique property of roAp stars, and it was already used in the classification study of the Nd iii lines (Ryabchikova et al. Nd3 (2006)).
7 Discussion
We have obtained time-resolved observations with different spectrographs in different years (2001, 2003 and 2004) and at nearly the same rotation phases close to the magnetic maximum. We have already reported the similarity of phase shifts between RV variations in the lines of different elements/ions (Sachkov et al. 2004b ) based on the observations taken in 2001 and 2003. Figure 7 gives another comparison of the RV variations derived from the observations taken in 2001 (GECKO) and in 2004 (HARPS) at rotation phase 0.87. It was mentioned in Sect. 4 that the frequency analysis of our observations in 2001 and 2004 reveals the same highest amplitude frequencies of 2720.9 and 2652.9 Hz, which corresponds to pulsation periods of 6.125 and 6.28 min. In 2003 we got only 53 spectra and hence we can not resolve frequencies, therefore a mean period of 6.20 min was used. RV amplitudes and phases for a sample of common lines observed in 2001, 2003 and 2004 are given in Table 5 (Online material). Phases in 2001 and 2003 were calculated relative to the HJD of the first observation in a given year and were shifted for comparison purpose by and , respectively. Obviously, the same lines are variable and the similarity of amplitudes and phases of the RV maximum indicate stability of the pulsation pattern in the atmosphere of HD 24712 at least during recent years.
Simultaneous photometry and spectroscopy allow us for the first time to phase accurately RV variations due to pulsation observed in different spectral lines with the photometric pulsation signature. To determine a phase shift between RV and light variations we used the pulsation frequency with the largest photometric amplitude in the WET and MOST data (6.125 min).
Our results show a gradual decrease of the phase lag from the H line to Tb iii lines, which may be interpreted as a running wave in the atmosphere of HD 24712, if different lines are formed at different atmospheric layers. The same phenomenon, known as the Van Hoof effect, was found earlier in Cep-type stars (Mathias & Gillet bcep (1993)) and allowed them to derive the propagation time of the running wave through the stellar atmosphere. A first estimate of the running pulsation wave speed in the atmosphere of HD 24712 can be obtained from the phase lags and the respective formation depths of the Nd ii and Nd iii lines determined according to Mashonkina et al. (MRR05 (2005)). In the relevant atmospheric layers () the pulsation wave propagates with nearly constant speed of 6 km s-1 which is slightly less than the sound speed in adiabatic approximation.
An analysis of the running wave properties in a roAp star atmosphere is rather difficult. First, we know that elements are stratified in the atmospheres of Ap and roAp stars (Babel Babel92 (1992); Ryabchikova et al. RPK02 (2002), RLK05 (2005)), and therefore stratification has to be taken into account for the line formation depth calculations. Second, a stratification analysis of the REEs, which are the main carriers of pulsation information, is not correct without considering NLTE effects (Mashonkina et al. MRR05 (2005)). The third important issue is the surface inhomogeneity in the chemical composition. HD 24712 is a spectrum variable and the first rough analysis of the element distribution was published by Preston (Preston (1972)). Later, Ryabchikova et al. (RTMS00 (2000)) showed evidence for a concentration of the Fe-peak elements in a wide band around the magnetic equator, while REEs (in particular Pr and Nd) and Co are concentrated in large spots near, but not exactly at one magnetic pole (the other pole is never visible). Our magnetic field measurements support this difference in the element surface distribution.
Recent Magnetic Doppler Imaging of HD 24712 (Lüftinger at el. MDI06 (2006)) revealed a small but non negligible difference (both in longitude and latitude) between the surface distributions of different REE elements. Therefore, part of the phase shifts between RV curves may be due to the different chemical surface distribution relative to the magnetic pole. Cunha (cunha06 (2006)) showed that phase shifts may reach 0.25 of the period between the magnetic pole and the magnetic co-latitude (see lower panel of Fig. 6 in Cunha cunha06 (2006)).
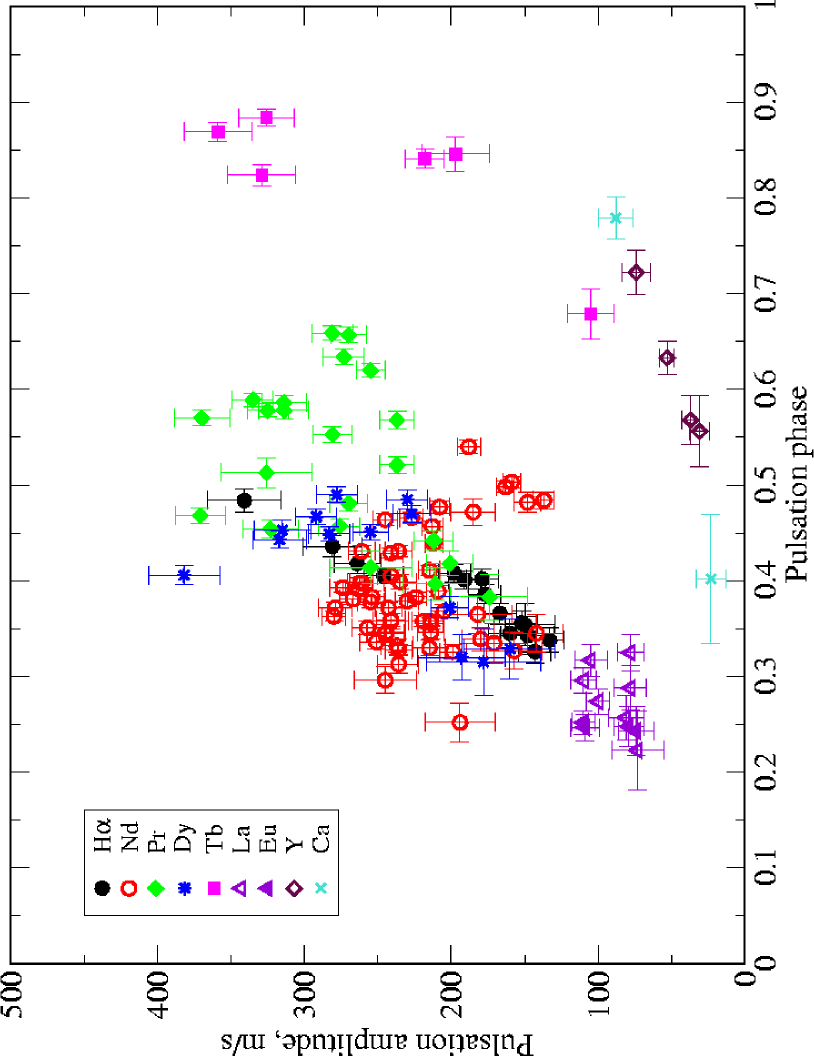
A detailed study of the line formation depth in the atmosphere of HD 24712 will be subject of a forthcoming paper. However, some first information may be obtained already without such a detailed analysis when plotting the maximum RV value observed for a given spectral line as a function of pulsation phase, determined from photometry. If the photometric pulsation phase of the maximum RV is related to specific line-forming layers in the stellar atmosphere, then we expect new insights in a pulsating atmosphere. Figure 8 shows RV amplitudes as a function of pulsation phases for numerous lines of several elements measured in UVES spectra (rotation phase 0.944). These pulsation data include bisector measurements of the H core and the cores of Ca i and Ca ii resonance lines.
The data seem to cluster along two curves separated roughly by 0.5 of a pulsation period (Fig. 8). The first curve may be directly connected with optical depth, thanks to NLTE calculations for hydrogen and Nd lines (Mashonkina et al. MRR05 (2005); Sachkov et al. Rome (2006)). The RV amplitude grows towards the upper layers, reaches a maximum and then decreases, as indicated by the Nd and Pr lines.
At present it is difficult to conclude if the second curve represents another part of a continuous amplitude–phase distribution, because it is defined mainly by Y and Tb lines, which formation depths are unknown. We think that Tb lines are formed at about the same depth or higher than Nd, Pr and other REE lines. The core of the resonance Ca ii 3933 Å line (pulsation phase of 0.8) may be also formed high in the atmosphere, particularly if one considers possible stratification of Ca. But the Y lines are probably formed in lower atmospheric layers.
Our observations allow us to check the claimed pulsation phase jumps of 180 at rotation phases corresponding to magnetic extrema (Mkrtichian & Hatzes mkrt05 (2005)). These authors had to link two sets of observations, separated by one month (more than 9000 pulsation cycles), to cover these phases. The phase jumps reported by Mkrtichian & Hatzes occur exactly between the two sets of observations. We, on the other hand, do not observe any phase changes exceeding 35 (0.1 of the pulsation period) in our data sets, which fortunately happen to cover in 2002 the magnetic minimum in 4 consecutive nights (sets 4 to 10) and in 2004 the magnetic maximum in 4 nights of which three were consecutive (sets 12 to 15). Thus, we believe that the rotational modulation of pulsation phase reported for HD 24712 by Mkrtichian & Hatzes (mkrt05 (2005)) is spurious.
Finally we want to point again to Table LABEL:puls which provides the basis for the present investigation. It is a compilation of unblended spectral lines measured in the spectral range from 3900 to 6800 Å and of further 80 lines bluewards the Balmer jump. Because of its volume this table is available only as on-line material. We present the measured central wavelengths of nearly 600 spectral lines in Å, followed by the pulsation amplitude in m s-1 and the amplitude error, the period with the largest amplitude determined with a least-squares fit after a periodogram analysis and the probability of the given period (Horne & Baliunas horne (1986)). The next four columns give amplitude, amplitude error, phase relative to the main photometric period observed by MOST (6.125 min) and the phase error. These data are followed by the same information, but relative to the third prominent photometric period observed by MOST (6.282 min), which is the second prominent spectroscopic period. And finally we give in the last column additional information. This table includes information of pulsation properties of 600 spectral lines in the roAp star HD 24712 observed in 2004 in a range of more than 3000 Å. Because of the known rotational modulation of the pulsation RV amplitudes (see Fig. 3) the lines measured in both observing runs have different amplitudes in Table LABEL:puls.
8 Conclusions
An extensive spectroscopic and polarimetric study of HD 24712 provide new information about the pulsation properties of a roAp star atmosphere. With this new analysis we confirm our previous results (Sachkov et al. 2004b ) and of Balona & Zima (bal_z (2002)), that REE lines and the H core show large pulsation amplitudes (150 to 400 m s-1), while spectral lines of the other elements (Mg, Si, Ca, Fe-peak) are nearly constant.
Our data permit for the first time to determine directly the phase shifts for different chemical elements, respectively ions, between pulsation signatures observed in RV data and in photometry. These shifts, derived from contemporaneous photometric and spectroscopic observations, together with magnetic field measurements over a stellar rotation period, will be used in our forthcoming structural analysis of the pulsating atmosphere of HD 24712.
Acknowledgements.
We thank the MOST Science Team for providing us with the photometric data and frequency analysis of HD 24712 prior to publication. This work was supported by the Austrian FFG-ALR (MOST Ground Station) and Austrian Science Fund (FWF-P17580N2), by grant 11630102 from the Royal Swedish Academy of Sciences, and by the Natural Sciences and Engineering Research Council of Canada. TR and MS acknowledge financial support from RFBR grant 04-02-16788a and from the RAS Presidium (Program “Origin and Evolution of Stars and Galaxies”). We also thank our referee, Don W. Kurtz, for his constructive comments which helped to improve the paper.References
- (1) Aldenius, M. 2001, Master Thesis, Depart. of Physics, Univ. of Lund
- (2) Babel, J. 1992, A&A, 258, 449
- (3) Baldry, I.K., Viskum, M., Bedding, T.R., et al. 1999, MNRAS, 302, 381
- (4) Balona, L. A. 2002, MNRAS, 337, 1059
- (5) Balona, L. A., & Zima, W. 2002, MNRAS, 336, 873
- (6) Balona, L. A., & Laney, C. D. 2003, MNRAS, 344, 242
- (7) Biémont, E., Palmeri, P., & Quinet, P. 1999, Ap&SS, 635, 269
- (8) Biémont, E., Palmeri, P., Quinet, P., Zhang, Z.G., & Svanberg S. 2002, ApJ, 567, 1276
- (9) Crosswhite, H. 1976, unpublished data
- (10) Cowley, C.R., Ryabchikova, T., Kupka, F., et al. 2000, MNRAS, 317, 299
- (11) Cunha, M.S. 2006, MNRAS, 365, 153
- (12) Cunha, M.S., Fernandes J.M.M.B., Monteiro, M.J.P.F.G. 2003, MNRAS, 343, 831
- (13) Elkin, V.G., Kurtz, D.W., & Mathys, G. 2005, MNRAS, 364, 864
- (14) Horne, J.H., Baliunas, S.L.1986, ApJ, 302, 757
- (15) Ilyin, I.V. 2000, High resolution SOFIN CCD échelle spectroscopy, PhD Thesis, University of Oulu
- (16) Kochukhov, O. 2006, in Magnetic Stars 2006, eds. I.I. Romanyuk and D. O. Kudryavtsev, in press
- (17) Kupka, F., Piskunov, N., Ryabchikova, T.A., Stempels, H.C., & Weiss, W.W. 1999, A&AS, 138, 119
- (18) Kurtz, D.W. 1982, MNRAS, 200, 807
- (19) Kurtz, D.W., Kawaler, S.D., Riddle, R.L., et al. 2002, MNRAS, 330, L57
- (20) Kurtz, D.W., Cameron, C., Cunha, M.S. et al. 2005, MNRAS, 358, 651
- (21) Leone, F., & Catanzaro, G. 2004, A&A, 425, 271
- (22) Lüftinger, T., Kochukhov, O., Ryabchikova, T., Weiss, W.W., & Ilyin, I. 2006, in Magnetic Stars, eds. I.I. Romanyuk and D.O.Kudryavtsev, (in press)
- (23) Martin, W.C., Zalubas, R., & Hagan, L. 1978, NSRDS-NBS 60, Washington
- (24) Mashonkina, L. I., Ryabchikova, T. A., & Ryabtsev, A. N. 2005, A&A, 441, 309
- (25) Mathias, P., & Gillet, D. 1993, A&A, 278, 511
- (26) Matthews, J.M., Wehlau, W.H., Walker, G.A.H., & Yang, S. 1988, ApJ, 324, 1099
- (27) Mkrtichian, D.E., & Hatzes, A.P. 2005, A&A 430, 263
- (28) Preston, G. W. 1972, ApJ, 175, 465
- (29) Piskunov, N. E. 1999, in 2nd International Workshop on Solar Polarization, eds. K. Nagendra and J. Stenflo, Kluwer Acad. Publ. ASSL, 243, 515
- (30) Ryabchikova, T.A., Landstreet, J.D., Gelbmann, M.J., et al. 1997, A&A, 327, 1137
- (31) Ryabchikova, T., Leone, F., & Kochukhov, O. 2005, A&A, 438, 973
- (32) Ryabchikova, T., Piskunov, N., Kochukhov, O., Tsymbal, V., Mittermayer, P., & Weiss, W. W. 2002, A&A, 384, 545
- (33) Ryabchikova, T., Ryabtsev, A., Kochukhov, O., & Bagnulo, S. 2006, A&A, 456, 329
- (34) Ryabchikova, T.A., Tsymbal, V.V., Malanushenko, V.P., & Savanov, I.S. 2000, in Magnetic Fields of Chemically Peculiar and Related Stars, eds. Yu. V. Glagolevskij, & I.I. Romanyuk, Moscow, 180
- (35) Ryabchikova, T., Wade, G.A., Auriére, M., et al. 2005, A&A, 429, L55
- (36) Sachkov, M., Ryabchikova, T., Kochukhov, O., et al. 2004a, in Variable Stars in the Local Group, eds. D.W. Kurtz & K.R. Pollard, ASP Conf. Ser., 310, 208
- (37) Sachkov, M., Ryabchikova, T., Ilyin, I., et al. 2004b, in The A-Star Puzzle, IAU Symp. No. 224, eds. J.Zverko, W.W. Weiss, J.Žižňovský, & S. J. Adelman, Cambridge University Press, 770
- (38) Sachkov, M., Ryabchikova, T., Bagnulo, S., et al. 2006, in Stellar Pulsation and Evolution, eds. A.R. Walker, G. Bono, Mem. Soc. Astron. Italiana, 77, 397
- (39) Tsymbal, V., Lyashko, D., & Weiss, W. W. 2003, in Modelling of Stellar Atmospheres, IAU Symp. No. 210, eds. N. Piskunov, W.W.Weiss, D.F. Gray, Astr. Soc. Pacific., E49
- (40) Walker, G., Matthews, G., Kuschnig, R., et al. 2003, PASP, 115, 1023
| Wavelength | Free period | Fixed periods | Identification | |||||||||||
|---|---|---|---|---|---|---|---|---|---|---|---|---|---|---|
| 6.125 min | 6.282 min | |||||||||||||
| Å | (m s-1) | Prob. | (m s-1) | (m s-1) | ||||||||||
| Hydrogen | ||||||||||||||
| HARPS | ||||||||||||||
| 4340.468 | 59 | 15 | 6.237 | 0.041 | 0.847 | 22 | 18 | 0.132 | 0.132 | 44 | 18 | 0.759 | 0.067 | H |
| 4861.330 | 91 | 11 | 6.115 | 0.018 | 1.000 | 93 | 13 | 0.230 | 0.022 | 39 | 13 | 0.605 | 0.053 | H |
| 6562.799 | 175 | 10 | 6.140 | 0.009 | 1.000 | 168 | 8 | 0.376 | 0.008 | 87 | 8 | 0.785 | 0.015 | H |
| Na | ||||||||||||||
| HARPS | ||||||||||||||
| 5895.996 | 37 | 12 | 3.831 | 0.018 | 0.368 | 30 | 14 | 0.581 | 0.077 | 20 | 14 | 0.656 | 0.118 | Na i |
| Mg | ||||||||||||||
| HARPS | ||||||||||||||
| 5172.701 | 22 | 6 | 3.862 | 0.017 | 0.644 | 20 | 7 | 0.656 | 0.062 | 14 | 7 | 0.759 | 0.088 | Mg i |
| Si | ||||||||||||||
| HARPS | ||||||||||||||
| 5701.115 | 113 | 40 | 5.501 | 0.043 | 0.122 | 35 | 50 | 0.209 | 0.069 | 43 | 49 | 0.343 | 0.025 | Si i |
| 5056.005 | 20 | 7 | 3.426 | 0.018 | 0.053 | 5 | 9 | 0.612 | 0.134 | 5 | 9 | 0.690 | 0.119 | Si ii |
| 5978.939 | 82 | 23 | 4.418 | 0.022 | 0.700 | 89 | 28 | 0.558 | 0.051 | 66 | 28 | 0.707 | 0.069 | Si ii |
| 6347.113 | 41 | 10 | 9.187 | 0.086 | 0.907 | 29 | 13 | 0.371 | 0.071 | 37 | 13 | 0.567 | 0.055 | Si ii |
| S | ||||||||||||||
| HARPS | ||||||||||||||
| 4696.202 | 316 | 35 | 6.126 | 0.017 | 1.000 | 304 | 39 | 0.405 | 0.020 | 160 | 38 | 0.813 | 0.039 | S i+ Nd iii 4696.205 |
| Ca | ||||||||||||||
| HARPS | ||||||||||||||
| 4226.735 | 27 | 8 | 10.281 | 0.123 | 0.481 | 21 | 9 | 0.548 | 0.073 | 9 | 9 | 0.781 | 0.156 | Ca i core |
| 4425.444 | 16 | 5 | 6.207 | 0.049 | 0.388 | 11 | 6 | 0.356 | 0.087 | 11 | 6 | 0.849 | 0.091 | Ca i |
| 5349.471 | 25 | 7 | 3.302 | 0.014 | 0.616 | 13 | 9 | 0.246 | 0.117 | 5 | 9 | 0.428 | 0.119 | Ca i |
| 5590.124 | 34 | 13 | 3.065 | 0.016 | 0.376 | 2 | 16 | 0.535 | 0.147 | 14 | 15 | 0.759 | 0.020 | Ca i |
| 5857.467 | 30 | 9 | 8.749 | 0.094 | 0.503 | 21 | 11 | 0.313 | 0.087 | 24 | 11 | 0.622 | 0.075 | Ca i |
| 5867.564 | 147 | 36 | 5.794 | 0.033 | 0.925 | 141 | 45 | 0.227 | 0.051 | 47 | 45 | 0.403 | 0.152 | Ca i bl. ? |
| 6122.224 | 28 | 7 | 6.149 | 0.040 | 0.825 | 26 | 9 | 0.211 | 0.055 | 14 | 9 | 0.632 | 0.098 | Ca i |
| 6162.198 | 34 | 10 | 4.562 | 0.024 | 0.574 | 18 | 12 | 0.506 | 0.106 | 12 | 12 | 0.129 | 0.156 | Ca i |
| 6163.760 | 63 | 22 | 4.329 | 0.026 | 0.149 | 18 | 27 | 0.311 | 0.076 | 42 | 27 | 0.138 | 0.102 | Ca i |
| 6439.107 | 30 | 7 | 6.175 | 0.038 | 0.926 | 24 | 8 | 0.470 | 0.057 | 18 | 8 | 0.921 | 0.076 | Ca i |
| 6462.592 | 21 | 6 | 6.221 | 0.046 | 0.568 | 8 | 7 | 0.105 | 0.147 | 15 | 7 | 0.665 | 0.080 | Ca i |
| 6471.673 | 56 | 13 | 6.082 | 0.035 | 0.941 | 59 | 16 | 0.346 | 0.043 | 30 | 16 | 0.692 | 0.085 | Ca i |
| 6493.793 | 48 | 12 | 6.116 | 0.038 | 0.896 | 54 | 14 | 0.825 | 0.044 | 18 | 15 | 0.128 | 0.125 | Ca i |
| 6499.655 | 26 | 8 | 10.094 | 0.132 | 0.303 | 19 | 10 | 0.978 | 0.090 | 5 | 10 | 0.420 | 0.155 | Ca i |
| 6717.705 | 53 | 55 | 3.060 | 0.027 | 0.005 | 26 | 19 | 0.227 | 0.118 | 46 | 19 | 0.354 | 0.067 | Ca i |
| 3933.655 | 126 | 21 | 6.134 | 0.025 | 0.999 | 121 | 25 | 0.816 | 0.033 | 43 | 25 | 0.243 | 0.093 | Ca ii core |
| 5021.158 | 52 | 16 | 3.952 | 0.019 | 0.423 | 2 | 20 | 0.104 | 0.046 | 14 | 20 | 0.840 | 0.063 | Ca ii |
| 5285.280 | 51 | 16 | 6.112 | 0.047 | 0.411 | 60 | 19 | 0.842 | 0.052 | 26 | 19 | 0.878 | 0.120 | Ca ii |
| Sc | ||||||||||||||
| HARPS | ||||||||||||||
| 4415.579 | 143 | 12 | 6.135 | 0.013 | 1.000 | 130 | 14 | 0.366 | 0.017 | 55 | 14 | 0.829 | 0.041 | Sc ii + Nd iii 4415.60 |
| 5239.807 | 251 | 17 | 6.135 | 0.010 | 1.000 | 251 | 14 | 0.396 | 0.009 | 139 | 14 | 0.781 | 0.016 | Sc ii + Ce ii 5239.84 |
| 5526.831 | 53 | 11 | 6.027 | 0.031 | 0.986 | 54 | 13 | 0.397 | 0.040 | 35 | 13 | 0.708 | 0.063 | Sc ii + Ce ii 5526.86 |
| 5641.007 | 516 | 358 | 3.049 | 0.006 | 0.354 | 84 | 75 | 0.340 | 0.141 | 87 | 74 | 0.313 | 0.139 | Sc ii |
| 5657.908 | 80 | 20 | 9.500 | 0.092 | 0.854 | 26 | 26 | 0.267 | 0.001 | 37 | 26 | 0.423 | 0.116 | Sc ii + Fe ii |
| Ti | ||||||||||||||
| UVES1 | ||||||||||||||
| 3444.295 | 114 | 14 | 6.113 | 0.020 | 1.000 | 111 | 18 | 0.229 | 0.026 | 35 | 18 | 0.494 | 0.081 | Ti ii + Dy ii 3444.25 |
| 3491.039 | 58 | 9 | 6.096 | 0.028 | 0.999 | 63 | 12 | 0.065 | 0.032 | 23 | 12 | 0.384 | 0.083 | Ti ii |
| HARPS | ||||||||||||||
| 4518.038 | 96 | 32 | 5.122 | 0.035 | 0.237 | 55 | 40 | 0.055 | 0.116 | 4 | 40 | 0.666 | 0.075 | Ti i |
| 4913.636 | 108 | 33 | 3.427 | 0.014 | 0.493 | 15 | 41 | 0.865 | 0.098 | 35 | 41 | 0.680 | 0.026 | Ti i |
| 5016.182 | 117 | 36 | 3.934 | 0.018 | 0.462 | 78 | 44 | 0.511 | 0.091 | 50 | 45 | 0.522 | 0.141 | Ti i |
| 4422.380 | 25 | 8 | 3.679 | 0.018 | 0.223 | 21 | 10 | 0.039 | 0.077 | 3 | 10 | 0.294 | 0.045 | Ti ii |
| 4464.470 | 29 | 5 | 6.061 | 0.025 | 0.999 | 32 | 6 | 0.990 | 0.030 | 12 | 6 | 0.273 | 0.075 | Ti ii |
| 4501.267 | 94 | 6 | 6.118 | 0.010 | 1.000 | 98 | 4 | 0.436 | 0.008 | 53 | 4 | 0.799 | 0.014 | Ti ii + Nd iii 4501.23 |
| 4529.513 | 13 | 5 | 7.566 | 0.082 | 0.095 | 10 | 6 | 0.002 | 0.096 | 3 | 6 | 0.467 | 0.121 | Ti ii |
| 4563.774 | 30 | 3 | 6.177 | 0.018 | 1.000 | 24 | 3 | 0.066 | 0.025 | 19 | 3 | 0.514 | 0.032 | Ti ii |
| 4583.409 | 90 | 24 | 6.083 | 0.039 | 0.820 | 81 | 29 | 0.387 | 0.056 | 17 | 28 | 0.910 | 0.102 | Ti ii |
| 4708.683 | 37 | 13 | 9.331 | 0.119 | 0.086 | 28 | 15 | 0.797 | 0.088 | 9 | 15 | 0.415 | 0.102 | Ti ii |
| 4805.105 | 35 | 8 | 6.149 | 0.033 | 0.976 | 31 | 9 | 0.225 | 0.048 | 14 | 9 | 0.693 | 0.107 | Ti ii |
| 4911.212 | 27 | 8 | 8.466 | 0.085 | 0.581 | 33 | 9 | 0.957 | 0.046 | 19 | 9 | 0.167 | 0.077 | Ti ii |
| 5005.194 | 63 | 19 | 7.388 | 0.067 | 0.449 | 30 | 23 | 0.275 | 0.124 | 44 | 23 | 0.801 | 0.086 | Ti ii |
| 5013.706 | 56 | 13 | 8.238 | 0.061 | 0.974 | 35 | 16 | 0.181 | 0.074 | 16 | 16 | 0.471 | 0.005 | Ti ii |
| 5129.176 | 22 | 6 | 3.418 | 0.013 | 0.845 | 20 | 7 | 0.131 | 0.057 | 14 | 7 | 0.301 | 0.085 | Ti ii |
| 5185.918 | 19 | 3 | 6.127 | 0.028 | 0.998 | 20 | 4 | 0.977 | 0.033 | 12 | 4 | 0.338 | 0.057 | Ti ii |
| 5226.562 | 17 | 4 | 6.160 | 0.036 | 0.937 | 13 | 4 | 0.097 | 0.058 | 7 | 4 | 0.647 | 0.111 | Ti ii |
| 5418.794 | 58 | 12 | 8.912 | 0.066 | 0.992 | 28 | 16 | 0.359 | 0.091 | 34 | 16 | 0.590 | 0.074 | Ti ii |
| 6491.602 | 70 | 23 | 8.052 | 0.085 | 0.162 | 51 | 29 | 0.951 | 0.090 | 30 | 29 | 0.056 | 0.152 | Ti ii |
| V | ||||||||||||||
| HARPS | ||||||||||||||
| 6119.500 | 197 | 78 | 3.072 | 0.013 | 0.122 | 57 | 90 | 0.909 | 0.091 | 72 | 91 | 0.156 | 0.038 | V i |
| 4564.593 | 33 | 9 | 6.197 | 0.040 | 0.855 | 20 | 10 | 0.030 | 0.082 | 19 | 10 | 0.726 | 0.090 | V ii |
| Cr | ||||||||||||||
| UVES1 | ||||||||||||||
| 3484.117 | 35 | 9 | 6.119 | 0.043 | 0.622 | 44 | 12 | 0.344 | 0.042 | 19 | 12 | 0.752 | 0.096 | Cr ii |
| HARPS | ||||||||||||||
| 4595.598 | 75 | 10 | 6.116 | 0.021 | 1.000 | 85 | 10 | 0.396 | 0.020 | 59 | 10 | 0.726 | 0.029 | Cr i bl ? |
| 4600.752 | 29 | 9 | 5.313 | 0.035 | 0.483 | 22 | 11 | 0.155 | 0.079 | 10 | 11 | 0.679 | 0.005 | Cr i |
| 4622.454 | 49 | 15 | 8.124 | 0.082 | 0.390 | 44 | 18 | 0.184 | 0.067 | 41 | 18 | 0.520 | 0.072 | Cr i |
| 4626.191 | 30 | 10 | 3.848 | 0.020 | 0.153 | 26 | 13 | 0.927 | 0.079 | 20 | 12 | 0.211 | 0.104 | Cr i |
| 4637.204 | 111 | 15 | 6.140 | 0.021 | 1.000 | 112 | 17 | 0.265 | 0.025 | 60 | 17 | 0.642 | 0.047 | Cr i |
| 4649.436 | 57 | 16 | 6.100 | 0.043 | 0.685 | 60 | 19 | 0.372 | 0.052 | 37 | 19 | 0.727 | 0.085 | Cr i |
| 4651.294 | 18 | 6 | 5.083 | 0.036 | 0.114 | 11 | 8 | 0.055 | 0.113 | 12 | 8 | 0.298 | 0.107 | Cr i |
| 4652.170 | 20 | 5 | 5.063 | 0.029 | 0.768 | 5 | 7 | 0.321 | 0.033 | 10 | 7 | 0.915 | 0.112 | Cr i |
| 4730.715 | 41 | 13 | 5.365 | 0.037 | 0.394 | 16 | 16 | 0.820 | 0.001 | 29 | 16 | 0.070 | 0.089 | Cr i |
| 4764.305 | 52 | 16 | 3.850 | 0.019 | 0.322 | 13 | 21 | 0.403 | 0.095 | 29 | 21 | 0.662 | 0.114 | Cr i |
| 4771.507 | 31 | 10 | 6.182 | 0.048 | 0.283 | 25 | 12 | 0.976 | 0.075 | 15 | 12 | 0.440 | 0.123 | Cr i? |
| 5208.858 | 91 | 11 | 6.079 | 0.019 | 1.000 | 103 | 12 | 0.678 | 0.020 | 67 | 12 | 0.994 | 0.030 | Cr i, Pr iii 5208.51 |
| 5247.592 | 71 | 21 | 4.185 | 0.021 | 0.561 | 48 | 26 | 0.747 | 0.087 | 2 | 26 | 0.339 | 0.014 | Cr i |
| 5296.695 | 46 | 12 | 4.407 | 0.020 | 0.858 | 7 | 15 | 0.000 | 0.037 | 18 | 15 | 0.454 | 0.133 | Cr i |
| 5297.379 | 27 | 10 | 3.986 | 0.023 | 0.048 | 1 | 12 | 0.652 | 0.035 | 8 | 12 | 0.504 | 0.083 | Cr i |
| 5348.324 | 47 | 15 | 6.091 | 0.048 | 0.354 | 48 | 18 | 0.235 | 0.061 | 3 | 18 | 0.412 | 0.152 | Cr i |
| 5628.650 | 209 | 63 | 4.912 | 0.029 | 0.559 | 77 | 79 | 0.313 | 0.004 | 119 | 80 | 0.584 | 0.105 | Cr i |
| 4588.206 | 8 | 2 | 3.548 | 0.016 | 0.292 | 4 | 3 | 0.025 | 0.123 | 8 | 3 | 0.198 | 0.066 | Cr ii |
| 4592.063 | 14 | 4 | 5.143 | 0.031 | 0.508 | 4 | 5 | 0.327 | 0.027 | 10 | 5 | 0.709 | 0.082 | Cr ii |
| 4634.080 | 11 | 4 | 5.978 | 0.050 | 0.074 | 11 | 5 | 0.940 | 0.070 | 12 | 5 | 0.229 | 0.065 | Cr ii |
| 5153.502 | 46 | 12 | 6.098 | 0.040 | 0.828 | 46 | 15 | 0.148 | 0.052 | 14 | 15 | 0.535 | 0.002 | Cr ii asymm. |
| 5232.513 | 36 | 12 | 5.267 | 0.037 | 0.210 | 7 | 14 | 0.503 | 0.159 | 30 | 14 | 0.933 | 0.079 | Cr ii |
| 5237.328 | 19 | 5 | 4.705 | 0.025 | 0.694 | 2 | 7 | 0.479 | 0.086 | 10 | 7 | 0.672 | 0.107 | Cr ii |
| 5246.802 | 44 | 17 | 4.987 | 0.039 | 0.009 | 26 | 21 | 0.314 | 0.132 | 34 | 21 | 0.334 | 0.102 | Cr ii |
| 5510.720 | 55 | 19 | 3.235 | 0.013 | 0.148 | 22 | 22 | 0.712 | 0.004 | 31 | 22 | 0.048 | 0.113 | Cr ii |
| Mn | ||||||||||||||
| UVES1 | ||||||||||||||
| 3441.972 | 15 | 5 | 9.739 | 0.143 | 0.020 | 7 | 7 | 0.276 | 0.003 | 10 | 7 | 0.816 | 0.108 | Mn ii |
| 3482.887 | 15 | 6 | 4.059 | 0.028 | 0.003 | 16 | 7 | 0.259 | 0.077 | 9 | 7 | 0.682 | 0.127 | Mn ii |
| 3488.658 | 15 | 6 | 8.778 | 0.140 | 0.000 | 4 | 8 | 0.616 | 0.133 | 12 | 8 | 0.031 | 0.109 | Mn ii |
| 3497.512 | 29 | 13 | 4.460 | 0.043 | 0.000 | 26 | 18 | 0.899 | 0.108 | 4 | 18 | 0.152 | 0.121 | Mn ii |
| HARPS | ||||||||||||||
| 4754.052 | 24 | 7 | 5.714 | 0.040 | 0.433 | 19 | 9 | 0.911 | 0.077 | 15 | 9 | 0.110 | 0.095 | Mn i |
| 4761.516 | 37 | 11 | 9.623 | 0.114 | 0.478 | 16 | 14 | 0.680 | 0.143 | 9 | 14 | 0.144 | 0.093 | Mn i |
| 4765.875 | 59 | 13 | 7.456 | 0.049 | 0.976 | 15 | 17 | 0.524 | 0.013 | 46 | 17 | 0.725 | 0.059 | Mn i |
| 4766.430 | 38 | 10 | 6.090 | 0.039 | 0.852 | 33 | 11 | 0.320 | 0.056 | 26 | 11 | 0.754 | 0.071 | Mn i |
| Fe | ||||||||||||||
| UVES1 | ||||||||||||||
| 3475.442 | 26 | 8 | 2.864 | 0.011 | 0.090 | 9 | 11 | 0.397 | 0.033 | 18 | 11 | 0.922 | 0.097 | Fe i |
| 3540.099 | 90 | 17 | 6.076 | 0.032 | 0.997 | 89 | 23 | 0.342 | 0.041 | 11 | 23 | 0.952 | 0.159 | Fe i |
| 3581.186 | 31 | 8 | 7.922 | 0.080 | 0.134 | 24 | 12 | 0.326 | 0.075 | 14 | 11 | 0.889 | 0.128 | Fe i |
| 3606.679 | 29 | 11 | 7.489 | 0.101 | 0.003 | 31 | 24 | 0.458 | 0.124 | 4 | 24 | 0.143 | 0.142 | Fe i |
| 3621.464 | 35 | 8 | 6.115 | 0.042 | 0.928 | 38 | 11 | 0.868 | 0.046 | 20 | 11 | 0.161 | 0.088 | Fe i |
| 3621.709 | 97 | 36 | 5.404 | 0.048 | 0.036 | 78 | 47 | 0.193 | 0.097 | 69 | 47 | 0.504 | 0.109 | Fe i |
| 3820.419 | 12 | 5 | 6.517 | 0.085 | 0.000 | 3 | 7 | 0.720 | 0.053 | 4 | 7 | 0.058 | 0.088 | Fe i |
| 4202.039 | 15 | 5 | 6.520 | 0.069 | 0.000 | 16 | 7 | 0.640 | 0.073 | 11 | 7 | 0.036 | 0.104 | Fe i |
| 4213.640 | 66 | 7 | 6.101 | 0.018 | 1.000 | 70 | 8 | 0.388 | 0.020 | 27 | 8 | 0.704 | 0.052 | Fe i |
| HARPS | ||||||||||||||
| 4045.823 | 49 | 8 | 6.107 | 0.026 | 0.999 | 40 | 8 | 0.829 | 0.033 | 24 | 8 | 0.112 | 0.054 | Fe i core |
| 4202.039 | 19 | 5 | 6.164 | 0.037 | 0.918 | 14 | 5 | 0.705 | 0.063 | 9 | 5 | 0.284 | 0.099 | Fe i |
| 4213.640 | 59 | 11 | 6.095 | 0.027 | 0.999 | 67 | 12 | 0.451 | 0.029 | 50 | 12 | 0.774 | 0.039 | Fe i |
| 4484.226 | 49 | 8 | 6.134 | 0.024 | 0.999 | 48 | 9 | 0.282 | 0.031 | 12 | 9 | 0.712 | 0.118 | Fe i |
| 4547.854 | 44 | 8 | 6.245 | 0.031 | 0.993 | 22 | 10 | 0.315 | 0.075 | 35 | 10 | 0.816 | 0.048 | Fe i |
| 4637.522 | 31 | 10 | 6.036 | 0.047 | 0.252 | 32 | 12 | 0.442 | 0.062 | 12 | 12 | 0.662 | 0.007 | Fe i |
| 4668.139 | 30 | 7 | 6.197 | 0.040 | 0.899 | 18 | 9 | 0.360 | 0.081 | 16 | 9 | 0.038 | 0.091 | Fe i |
| 4729.015 | 130 | 32 | 3.805 | 0.014 | 0.908 | 50 | 41 | 0.413 | 0.131 | 58 | 41 | 0.712 | 0.114 | Fe i |
| 4908.043 | 84 | 27 | 4.813 | 0.031 | 0.290 | 70 | 34 | 0.480 | 0.077 | 33 | 33 | 0.856 | 0.004 | Fe i |
| 4909.370 | 128 | 19 | 6.082 | 0.022 | 1.000 | 130 | 22 | 0.299 | 0.028 | 42 | 22 | 0.659 | 0.084 | Fe i bl. |
| 4910.331 | 23 | 7 | 6.855 | 0.060 | 0.297 | 14 | 9 | 0.437 | 0.101 | 20 | 9 | 0.732 | 0.074 | Fe i |
| 4938.833 | 27 | 9 | 7.148 | 0.071 | 0.089 | 7 | 11 | 0.345 | 0.091 | 7 | 11 | 0.197 | 0.078 | Fe i |
| 4950.121 | 73 | 18 | 6.061 | 0.036 | 0.920 | 88 | 22 | 0.330 | 0.039 | 46 | 22 | 0.544 | 0.074 | Fe i bl. ? |
| 4966.101 | 25 | 9 | 3.579 | 0.019 | 0.054 | 6 | 11 | 0.657 | 0.147 | 19 | 11 | 0.923 | 0.097 | Fe i |
| 4982.514 | 23 | 7 | 3.476 | 0.017 | 0.336 | 11 | 9 | 0.546 | 0.138 | 9 | 9 | 0.172 | 0.006 | Fe i |
| 5049.834 | 27 | 8 | 5.336 | 0.034 | 0.578 | 7 | 10 | 0.052 | 0.058 | 18 | 10 | 0.071 | 0.090 | Fe i |
| 5051.644 | 45 | 10 | 6.013 | 0.032 | 0.982 | 48 | 12 | 0.291 | 0.040 | 39 | 12 | 0.595 | 0.048 | Fe i |
| 5068.782 | 25 | 9 | 2.927 | 0.012 | 0.030 | 16 | 11 | 0.899 | 0.107 | 12 | 11 | 0.074 | 0.140 | Fe i |
| 5171.615 | 117 | 11 | 6.132 | 0.014 | 1.000 | 120 | 11 | 0.391 | 0.014 | 69 | 10 | 0.763 | 0.025 | Fe i bl. |
| 5196.071 | 50 | 17 | 3.704 | 0.018 | 0.176 | 25 | 21 | 0.484 | 0.133 | 17 | 21 | 0.013 | 0.036 | Fe i |
| 5198.714 | 56 | 22 | 4.901 | 0.038 | 0.017 | 13 | 27 | 0.866 | 0.157 | 7 | 27 | 0.319 | 0.106 | Fe i |
| 5215.202 | 35 | 10 | 5.925 | 0.042 | 0.358 | 14 | 13 | 0.251 | 0.148 | 28 | 13 | 0.431 | 0.076 | Fe i |
| 5217.407 | 39 | 13 | 7.137 | 0.070 | 0.135 | 1 | 16 | 0.501 | 0.020 | 21 | 16 | 0.462 | 0.126 | Fe i |
| 5242.503 | 32 | 10 | 8.150 | 0.086 | 0.315 | 25 | 13 | 0.413 | 0.082 | 20 | 13 | 0.628 | 0.102 | Fe i |
| 5253.477 | 60 | 18 | 7.375 | 0.067 | 0.498 | 56 | 22 | 0.220 | 0.064 | 15 | 22 | 0.304 | 0.076 | Fe i |
| 5281.798 | 23 | 8 | 6.546 | 0.060 | 0.122 | 27 | 10 | 0.484 | 0.058 | 14 | 10 | 0.704 | 0.113 | Fe i |
| 5383.380 | 29 | 12 | 8.747 | 0.128 | 0.003 | 17 | 14 | 0.458 | 0.137 | 23 | 14 | 0.782 | 0.104 | Fe i |
| 5397.142 | 25 | 8 | 3.609 | 0.018 | 0.142 | 13 | 10 | 0.922 | 0.129 | 25 | 10 | 0.164 | 0.066 | Fe i |
| 5405.783 | 12 | 4 | 5.806 | 0.052 | 0.020 | 3 | 5 | 0.345 | 0.147 | 6 | 5 | 0.284 | 0.143 | Fe i |
| 5410.917 | 15 | 6 | 6.852 | 0.080 | 0.001 | 12 | 8 | 0.406 | 0.100 | 10 | 8 | 0.537 | 0.116 | Fe i |
| 5415.211 | 17 | 4 | 5.104 | 0.030 | 0.706 | 4 | 6 | 0.046 | 0.049 | 5 | 6 | 0.227 | 0.012 | Fe i |
| 5424.080 | 19 | 6 | 3.522 | 0.015 | 0.413 | 4 | 7 | 0.795 | 0.124 | 4 | 7 | 0.933 | 0.133 | Fe i |
| 5434.535 | 23 | 8 | 3.376 | 0.017 | 0.083 | 7 | 10 | 0.983 | 0.052 | 14 | 10 | 0.063 | 0.114 | Fe i |
| 5445.050 | 35 | 8 | 6.192 | 0.036 | 0.948 | 23 | 10 | 0.185 | 0.070 | 20 | 10 | 0.945 | 0.079 | Fe i+ Ce ii 5445.23 |
| 5446.616 | 40 | 10 | 10.376 | 0.109 | 0.308 | 24 | 13 | 0.943 | 0.087 | 16 | 13 | 0.188 | 0.127 | Fe i |
| 5462.968 | 18 | 6 | 3.628 | 0.017 | 0.150 | 7 | 7 | 0.262 | 0.008 | 3 | 7 | 0.597 | 0.018 | Fe i |
| 5466.418 | 44 | 13 | 5.793 | 0.041 | 0.520 | 23 | 17 | 0.134 | 0.118 | 14 | 17 | 0.487 | 0.031 | Fe i |
| 5560.217 | 106 | 34 | 5.406 | 0.037 | 0.250 | 17 | 42 | 0.499 | 0.074 | 69 | 42 | 0.501 | 0.096 | Fe i |
| 5562.712 | 85 | 31 | 5.437 | 0.043 | 0.064 | 62 | 37 | 0.290 | 0.095 | 53 | 36 | 0.767 | 0.111 | Fe i |
| 5576.094 | 34 | 10 | 5.111 | 0.032 | 0.488 | 11 | 13 | 0.246 | 0.027 | 22 | 13 | 0.258 | 0.095 | Fe i |
| 5586.777 | 28 | 10 | 9.075 | 0.126 | 0.021 | 7 | 13 | 0.720 | 0.114 | 18 | 13 | 0.812 | 0.115 | Fe i |
| 5615.656 | 18 | 5 | 7.360 | 0.067 | 0.499 | 9 | 7 | 0.574 | 0.127 | 7 | 7 | 0.884 | 0.152 | Fe i |
| 5775.093 | 148 | 44 | 3.295 | 0.013 | 0.445 | 46 | 55 | 0.050 | 0.033 | 82 | 56 | 0.153 | 0.107 | Fe i |
| 5862.370 | 70 | 22 | 3.457 | 0.014 | 0.481 | 44 | 26 | 0.761 | 0.096 | 61 | 26 | 0.921 | 0.070 | Fe i |
| 5930.195 | 44 | 14 | 4.124 | 0.022 | 0.224 | 40 | 18 | 0.741 | 0.071 | 19 | 17 | 0.743 | 0.150 | Fe i |
| 5987.078 | 76 | 22 | 6.740 | 0.053 | 0.536 | 50 | 27 | 0.609 | 0.086 | 70 | 27 | 0.959 | 0.062 | Fe i |
| 6024.076 | 40 | 15 | 5.019 | 0.038 | 0.033 | 14 | 19 | 0.903 | 0.053 | 18 | 19 | 0.988 | 0.012 | Fe i |
| 6137.714 | 49 | 14 | 3.903 | 0.017 | 0.697 | 19 | 17 | 0.208 | 0.148 | 5 | 17 | 0.739 | 0.092 | Fe i |
| 6191.593 | 32 | 10 | 3.306 | 0.013 | 0.363 | 26 | 12 | 0.797 | 0.075 | 24 | 12 | 0.985 | 0.081 | Fe i |
| 6393.628 | 35 | 12 | 6.662 | 0.063 | 0.003 | 26 | 15 | 0.519 | 0.092 | 36 | 14 | 0.792 | 0.066 | Fe i |
| 6400.024 | 48 | 13 | 6.098 | 0.040 | 0.808 | 47 | 16 | 0.151 | 0.054 | 7 | 16 | 0.583 | 0.019 | Fe i |
| 6411.671 | 61 | 21 | 3.491 | 0.016 | 0.081 | 39 | 25 | 0.085 | 0.106 | 37 | 25 | 0.207 | 0.111 | Fe i |
| 6419.972 | 82 | 22 | 3.282 | 0.012 | 0.841 | 41 | 28 | 0.012 | 0.108 | 47 | 27 | 0.317 | 0.095 | Fe i |
| 6495.004 | 21 | 8 | 7.994 | 0.094 | 0.013 | 6 | 10 | 0.408 | 0.103 | 7 | 10 | 0.008 | 0.061 | Fe i |
| 6678.001 | 50 | 21 | 5.386 | 0.050 | 0.000 | 19 | 19 | 0.676 | 0.001 | 31 | 19 | 0.034 | 0.100 | Fe i |
| 4555.897 | 12 | 4 | 6.472 | 0.060 | 0.068 | 12 | 5 | 0.870 | 0.069 | 8 | 5 | 0.184 | 0.103 | Fe ii |
| 4635.331 | 36 | 9 | 4.905 | 0.024 | 0.892 | 33 | 11 | 0.364 | 0.053 | 14 | 11 | 0.723 | 0.127 | Fe ii |
| 4923.937 | 18 | 3 | 6.133 | 0.029 | 0.997 | 19 | 4 | 0.215 | 0.034 | 11 | 4 | 0.570 | 0.056 | Fe ii+ Nd ii 4923.93 |
| 4993.357 | 31 | 11 | 3.729 | 0.020 | 0.080 | 14 | 14 | 0.077 | 0.156 | 14 | 14 | 0.207 | 0.156 | Fe ii |
| 5018.455 | 14 | 2 | 6.137 | 0.027 | 0.996 | 13 | 3 | 0.781 | 0.038 | 6 | 3 | 0.220 | 0.082 | Fe ii+ Ce ii 5018.45 |
| 5132.675 | 85 | 31 | 4.762 | 0.033 | 0.070 | 29 | 38 | 0.229 | 0.049 | 44 | 38 | 0.985 | 0.136 | Fe ii |
| 5169.038 | 15 | 4 | 3.375 | 0.013 | 0.796 | 4 | 5 | 0.306 | 0.013 | 1 | 5 | 0.899 | 0.012 | Fe ii |
| 5197.591 | 11 | 3 | 2.933 | 0.009 | 0.660 | 5 | 3 | 0.456 | 0.112 | 6 | 3 | 0.968 | 0.097 | Fe ii |
| 5362.838 | 20 | 6 | 3.258 | 0.015 | 0.279 | 15 | 8 | 0.556 | 0.084 | 19 | 8 | 0.714 | 0.066 | Fe ii |
| 5414.086 | 85 | 31 | 3.164 | 0.013 | 0.084 | 21 | 37 | 0.673 | 0.115 | 33 | 37 | 0.597 | 0.019 | Fe ii |
| 5425.266 | 55 | 17 | 8.390 | 0.086 | 0.430 | 36 | 21 | 0.698 | 0.095 | 27 | 21 | 0.947 | 0.127 | Fe ii |
| 6147.747 | 70 | 18 | 6.135 | 0.040 | 0.855 | 64 | 22 | 0.960 | 0.055 | 24 | 22 | 0.417 | 0.147 | Fe ii+ Tb iii 6147.67 |
| 6516.126 | 27 | 8 | 3.416 | 0.014 | 0.018 | 20 | 10 | 0.088 | 0.079 | 15 | 10 | 0.257 | 0.104 | Fe ii |
| 6592.934 | 60 | 24 | 2.905 | 0.013 | 0.013 | 29 | 29 | 0.296 | 0.157 | 12 | 29 | 0.433 | 0.048 | Fe ii |
| Co | ||||||||||||||
| UVES1 | ||||||||||||||
| 3412.622 | 26 | 9 | 4.623 | 0.034 | 0.034 | 30 | 12 | 0.289 | 0.063 | 19 | 12 | 0.835 | 0.099 | Co i |
| 3455.228 | 26 | 11 | 4.566 | 0.041 | 0.000 | 9 | 15 | 0.820 | 0.091 | 7 | 15 | 0.245 | 0.021 | Co i |
| 3489.393 | 23 | 8 | 9.626 | 0.154 | 0.016 | 17 | 11 | 0.050 | 0.104 | 16 | 11 | 0.801 | 0.109 | Co i |
| 3491.296 | 25 | 9 | 4.200 | 0.029 | 0.005 | 26 | 12 | 0.430 | 0.072 | 26 | 12 | 0.770 | 0.072 | Co i |
| 3564.947 | 30 | 11 | 7.690 | 0.105 | 0.004 | 17 | 15 | 0.640 | 0.142 | 6 | 15 | 0.245 | 0.040 | Co i |
| HARPS | ||||||||||||||
| 4588.732 | 183 | 35 | 6.064 | 0.028 | 0.998 | 210 | 43 | 0.315 | 0.033 | 60 | 44 | 0.488 | 0.115 | Co i |
| 4781.449 | 77 | 26 | 4.283 | 0.026 | 0.169 | 50 | 32 | 0.691 | 0.104 | 63 | 32 | 0.898 | 0.084 | Co i |
| 4792.852 | 23 | 7 | 3.333 | 0.014 | 0.309 | 7 | 9 | 0.962 | 0.036 | 8 | 9 | 0.130 | 0.023 | Co i |
| 4813.478 | 26 | 8 | 3.725 | 0.017 | 0.304 | 21 | 10 | 0.428 | 0.079 | 2 | 10 | 0.953 | 0.100 | Co i |
| 4813.969 | 69 | 22 | 2.987 | 0.009 | 0.314 | 23 | 25 | 0.756 | 0.015 | 13 | 25 | 0.590 | 0.149 | Co i |
| 5146.757 | 28 | 10 | 6.037 | 0.051 | 0.093 | 28 | 12 | 0.891 | 0.069 | 12 | 12 | 0.164 | 0.004 | Co i |
| 5254.649 | 39 | 9 | 9.069 | 0.079 | 0.944 | 19 | 12 | 0.512 | 0.102 | 9 | 12 | 0.637 | 0.044 | Co i |
| 5257.615 | 38 | 12 | 6.595 | 0.058 | 0.202 | 11 | 16 | 0.610 | 0.072 | 6 | 15 | 0.292 | 0.062 | Co i |
| 5280.626 | 25 | 9 | 4.160 | 0.024 | 0.057 | 17 | 11 | 0.479 | 0.103 | 1 | 11 | 0.939 | 0.065 | Co i |
| 5342.704 | 27 | 9 | 7.659 | 0.081 | 0.125 | 9 | 12 | 0.333 | 0.036 | 15 | 12 | 0.675 | 0.122 | Co i |
| 5343.395 | 40 | 14 | 3.970 | 0.022 | 0.064 | 6 | 17 | 0.808 | 0.104 | 32 | 17 | 0.591 | 0.086 | Co i |
| 5352.038 | 32 | 10 | 6.132 | 0.046 | 0.462 | 32 | 12 | 0.659 | 0.061 | 6 | 12 | 0.561 | 0.127 | Co i |
| 5444.585 | 59 | 18 | 4.040 | 0.020 | 0.424 | 54 | 22 | 0.236 | 0.066 | 47 | 22 | 0.347 | 0.076 | Co i |
| 5454.576 | 71 | 17 | 8.890 | 0.074 | 0.880 | 59 | 21 | 0.176 | 0.058 | 53 | 21 | 0.403 | 0.064 | Co i |
| 5483.949 | 80 | 24 | 4.346 | 0.023 | 0.624 | 30 | 30 | 0.271 | 0.003 | 9 | 30 | 0.876 | 0.016 | Co i |
| 5489.663 | 74 | 27 | 4.715 | 0.032 | 0.063 | 72 | 32 | 0.455 | 0.072 | 51 | 32 | 0.735 | 0.102 | Co i |
| 5590.734 | 138 | 44 | 4.675 | 0.028 | 0.385 | 35 | 56 | 0.741 | 0.092 | 55 | 56 | 0.995 | 0.001 | Co i |
| 5647.235 | 79 | 27 | 5.365 | 0.040 | 0.091 | 19 | 34 | 0.861 | 0.121 | 68 | 34 | 0.166 | 0.079 | Co i |
| 6257.577 | 137 | 48 | 5.950 | 0.049 | 0.115 | 75 | 60 | 0.018 | 0.127 | 75 | 59 | 0.252 | 0.128 | Co i |
| 6347.833 | 101 | 32 | 7.554 | 0.071 | 0.439 | 60 | 40 | 0.874 | 0.106 | 5 | 39 | 0.906 | 0.000 | Co i |
| 4516.630 | 81 | 11 | 6.132 | 0.021 | 1.000 | 79 | 12 | 0.350 | 0.026 | 42 | 12 | 0.754 | 0.049 | Co ii |
| 4569.248 | 30 | 10 | 3.560 | 0.015 | 0.361 | 19 | 12 | 0.487 | 0.097 | 10 | 11 | 0.783 | 0.033 | Co ii |
| 4660.636 | 47 | 14 | 6.692 | 0.055 | 0.537 | 44 | 17 | 0.367 | 0.063 | 17 | 17 | 0.600 | 0.157 | Co ii |
| Ni | ||||||||||||||
| UVES1 | ||||||||||||||
| 3515.027 | 70 | 10 | 6.145 | 0.026 | 1.000 | 65 | 14 | 0.385 | 0.033 | 30 | 13 | 0.622 | 0.074 | Ni i |
| HARPS | ||||||||||||||
| 5035.398 | 80 | 29 | 4.155 | 0.024 | 0.042 | 38 | 35 | 0.215 | 0.145 | 40 | 35 | 0.582 | 0.138 | Ni i |
| Sr | ||||||||||||||
| UVES1 | ||||||||||||||
| 3380.722 | 25 | 8 | 6.965 | 0.023 | 0.817 | 20 | 8 | 0.338 | 0.061 | 6 | 8 | 0.438 | 0.038 | Sr ii |
| 3474.902 | 114 | 8 | 6.116 | 0.012 | 1.000 | 119 | 10 | 0.426 | 0.013 | 33 | 9 | 0.722 | 0.047 | Sr ii |
| HARPS | ||||||||||||||
| 4784.335 | 116 | 43 | 3.629 | 0.019 | 0.069 | 47 | 51 | 0.623 | 0.014 | 111 | 51 | 0.884 | 0.074 | Sr i |
| 4811.889 | 125 | 30 | 9.133 | 0.081 | 0.929 | 27 | 40 | 0.469 | 0.070 | 27 | 40 | 0.541 | 0.070 | Sr i |
| 4215.525 | 104 | 7 | 6.128 | 0.010 | 1.000 | 103 | 6 | 0.420 | 0.010 | 48 | 6 | 0.812 | 0.022 | Sr ii core |
| Y | ||||||||||||||
| UVES1 | ||||||||||||||
| 3549.001 | 71 | 9 | 6.133 | 0.022 | 0.999 | 74 | 10 | 0.722 | 0.023 | 49 | 10 | 0.024 | 0.035 | Y ii |
| HARPS | ||||||||||||||
| 5693.659 | 185 | 73 | 10.158 | 0.166 | 0.008 | 119 | 89 | 0.282 | 0.119 | 132 | 89 | 0.694 | 0.108 | Y i |
| 4883.686 | 82 | 9 | 6.092 | 0.016 | 1.000 | 89 | 10 | 0.728 | 0.018 | 43 | 10 | 0.060 | 0.037 | Y ii |
| 4982.134 | 30 | 10 | 4.731 | 0.031 | 0.116 | 15 | 13 | 0.537 | 0.136 | 5 | 13 | 0.498 | 0.082 | Y ii |
| 5087.427 | 51 | 5 | 6.129 | 0.016 | 1.000 | 52 | 5 | 0.693 | 0.018 | 27 | 5 | 0.075 | 0.034 | Y ii |
| 5119.118 | 28 | 9 | 6.044 | 0.047 | 0.255 | 31 | 11 | 0.427 | 0.057 | 13 | 11 | 0.606 | 0.131 | Y ii |
| 5289.824 | 65 | 19 | 3.312 | 0.012 | 0.626 | 34 | 24 | 0.917 | 0.110 | 9 | 23 | 0.748 | 0.072 | Y ii |
| 5402.781 | 39 | 14 | 3.300 | 0.016 | 0.111 | 24 | 17 | 0.563 | 0.110 | 29 | 17 | 0.024 | 0.091 | Y ii |
| 5509.901 | 30 | 7 | 6.049 | 0.037 | 0.885 | 34 | 9 | 0.533 | 0.043 | 18 | 9 | 0.741 | 0.082 | Y ii |
| 5662.928 | 48 | 7 | 6.133 | 0.022 | 1.000 | 48 | 8 | 0.667 | 0.027 | 32 | 8 | 0.045 | 0.040 | Y ii |
| 5728.899 | 45 | 16 | 3.576 | 0.018 | 0.073 | 20 | 20 | 0.360 | 0.155 | 17 | 20 | 0.539 | 0.022 | Y ii |
| 6613.749 | 85 | 24 | 6.195 | 0.044 | 0.712 | 64 | 29 | 0.421 | 0.072 | 57 | 28 | 0.900 | 0.081 | Y ii bl. |
| Zr | ||||||||||||||
| HARPS | ||||||||||||||
| 5350.379 | 168 | 24 | 6.189 | 0.022 | 1.000 | 114 | 29 | 0.340 | 0.041 | 89 | 29 | 0.873 | 0.053 | Zr ii? |
| Rh | ||||||||||||||
| UVES1 | ||||||||||||||
| 3434.865 | 64 | 18 | 3.196 | 0.014 | 0.603 | 18 | 26 | 0.420 | 0.067 | 22 | 25 | 0.679 | 0.022 | Rh i |
| Pd | ||||||||||||||
| UVES1 | ||||||||||||||
| 3404.570 | 14 | 7 | 4.807 | 0.054 | 0.000 | 20 | 9 | 0.522 | 0.078 | 7 | 9 | 0.035 | 0.066 | Pd i |
| HARPS | ||||||||||||||
| 5163.819 | 31 | 11 | 3.709 | 0.020 | 0.050 | 6 | 14 | 0.580 | 0.015 | 15 | 14 | 0.670 | 0.152 | Pd i |
| 5295.623 | 68 | 23 | 4.131 | 0.023 | 0.202 | 31 | 28 | 0.023 | 0.146 | 63 | 29 | 0.150 | 0.072 | Pd i |
| In | ||||||||||||||
| HARPS | ||||||||||||||
| 4511.263 | 254 | 31 | 6.173 | 0.011 | 1.000 | 228 | 36 | 0.351 | 0.025 | 177 | 36 | 0.756 | 0.033 | In i |
| Ba | ||||||||||||||
| HARPS | ||||||||||||||
| 4554.032 | 10 | 3 | 3.898 | 0.017 | 0.726 | 9 | 3 | 0.871 | 0.057 | 6 | 3 | 0.237 | 0.082 | Ba ii |
| 4934.071 | 8 | 2 | 6.103 | 0.049 | 0.298 | 8 | 3 | 0.966 | 0.063 | 4 | 3 | 0.349 | 0.116 | Ba ii |
| 5853.674 | 19 | 5 | 3.697 | 0.016 | 0.328 | 13 | 7 | 0.310 | 0.082 | 10 | 7 | 0.504 | 0.104 | Ba ii |
| 6141.718 | 17 | 5 | 3.379 | 0.013 | 0.602 | 11 | 6 | 0.841 | 0.088 | 5 | 6 | 0.485 | 0.018 | Ba ii |
| 6496.905 | 15 | 4 | 5.967 | 0.041 | 0.592 | 12 | 5 | 0.113 | 0.071 | 10 | 5 | 0.330 | 0.086 | Ba ii |
| La | ||||||||||||||
| UVES1 | ||||||||||||||
| 3517.010 | 88 | 5 | 6.110 | 0.011 | 1.000 | 98 | 6 | 0.475 | 0.010 | 42 | 6 | 0.802 | 0.024 | La iii |
| HARPS | ||||||||||||||
| 4526.097 | 113 | 9 | 6.160 | 0.013 | 1.000 | 97 | 10 | 0.385 | 0.017 | 52 | 10 | 0.851 | 0.032 | La ii |
| 4574.857 | 113 | 12 | 6.164 | 0.017 | 1.000 | 99 | 13 | 0.384 | 0.022 | 66 | 13 | 0.820 | 0.033 | La ii |
| 4655.474 | 155 | 16 | 6.118 | 0.015 | 1.000 | 152 | 17 | 0.328 | 0.019 | 74 | 17 | 0.728 | 0.038 | La ii |
| 4662.504 | 151 | 15 | 6.108 | 0.015 | 1.000 | 160 | 14 | 0.432 | 0.015 | 102 | 14 | 0.786 | 0.023 | La ii |
| 4692.489 | 107 | 19 | 6.119 | 0.026 | 0.999 | 107 | 23 | 0.301 | 0.034 | 1 | 23 | 0.563 | 0.127 | La ii |
| 4740.261 | 170 | 12 | 6.140 | 0.011 | 1.000 | 160 | 11 | 0.426 | 0.011 | 91 | 11 | 0.841 | 0.020 | La ii |
| 4748.724 | 134 | 16 | 6.162 | 0.019 | 1.000 | 120 | 18 | 0.401 | 0.025 | 77 | 18 | 0.831 | 0.039 | La ii |
| 4804.026 | 123 | 20 | 6.095 | 0.024 | 0.999 | 129 | 23 | 0.360 | 0.029 | 57 | 23 | 0.710 | 0.065 | La ii |
| 4921.802 | 146 | 12 | 6.133 | 0.013 | 1.000 | 137 | 12 | 0.486 | 0.015 | 72 | 12 | 0.907 | 0.028 | La ii |
| 4986.837 | 82 | 11 | 6.141 | 0.020 | 1.000 | 83 | 11 | 0.394 | 0.023 | 56 | 11 | 0.767 | 0.034 | La ii |
| 5482.256 | 128 | 33 | 6.078 | 0.038 | 0.880 | 118 | 40 | 0.241 | 0.055 | 16 | 40 | 0.782 | 0.066 | La ii |
| 5797.557 | 93 | 15 | 6.103 | 0.025 | 0.999 | 89 | 18 | 0.391 | 0.032 | 52 | 17 | 0.790 | 0.055 | La ii |
| 5805.766 | 159 | 30 | 6.087 | 0.028 | 0.998 | 164 | 36 | 0.364 | 0.035 | 45 | 36 | 0.703 | 0.125 | La ii |
| 5808.295 | 144 | 32 | 6.101 | 0.033 | 0.973 | 158 | 38 | 0.179 | 0.039 | 36 | 38 | 0.234 | 0.011 | La ii |
| 6262.283 | 183 | 32 | 6.150 | 0.026 | 0.999 | 145 | 38 | 0.292 | 0.042 | 91 | 37 | 0.815 | 0.067 | La ii + Pr ii 6262.55 |
| 6296.074 | 161 | 30 | 6.152 | 0.028 | 0.999 | 141 | 36 | 0.313 | 0.041 | 42 | 35 | 0.861 | 0.137 | La ii |
| 6320.376 | 84 | 13 | 6.136 | 0.023 | 1.000 | 79 | 14 | 0.293 | 0.030 | 44 | 14 | 0.710 | 0.053 | La ii |
| 6399.017 | 133 | 42 | 4.142 | 0.022 | 0.339 | 114 | 52 | 0.376 | 0.073 | 50 | 52 | 0.595 | 0.005 | La ii |
| Ce | ||||||||||||||
| UVES1 | ||||||||||||||
| 3534.018 | 233 | 20 | 6.138 | 0.015 | 1.000 | 242 | 23 | 0.515 | 0.015 | 119 | 23 | 0.794 | 0.031 | Ce ii |
| 3577.444 | 231 | 23 | 6.134 | 0.017 | 1.000 | 250 | 24 | 0.504 | 0.015 | 172 | 24 | 0.816 | 0.022 | Ce ii |
| 3395.770 | 157 | 47 | 6.174 | 0.051 | 0.589 | 167 | 60 | 0.490 | 0.058 | 118 | 61 | 0.810 | 0.081 | Ce iii+ Ti ii 3395.789 |
| 3427.352 | 152 | 14 | 6.138 | 0.016 | 1.000 | 146 | 15 | 0.590 | 0.018 | 88 | 16 | 0.857 | 0.029 | Ce iii |
| HARPS | ||||||||||||||
| 4418.785 | 201 | 11 | 6.118 | 0.009 | 1.000 | 204 | 10 | 0.548 | 0.008 | 91 | 10 | 0.928 | 0.018 | Ce ii |
| 4515.832 | 111 | 18 | 6.131 | 0.024 | 0.999 | 119 | 18 | 0.520 | 0.025 | 97 | 18 | 0.866 | 0.031 | Ce ii |
| 4562.357 | 298 | 17 | 6.120 | 0.009 | 1.000 | 299 | 14 | 0.549 | 0.008 | 142 | 14 | 0.934 | 0.016 | Ce ii |
| 4591.093 | 200 | 19 | 6.118 | 0.014 | 1.000 | 197 | 20 | 0.428 | 0.016 | 107 | 19 | 0.820 | 0.030 | Ce ii |
| 4914.919 | 199 | 23 | 6.102 | 0.018 | 1.000 | 206 | 26 | 0.405 | 0.020 | 112 | 25 | 0.767 | 0.037 | Ce ii |
| 5077.853 | 189 | 22 | 6.106 | 0.017 | 1.000 | 201 | 24 | 0.461 | 0.019 | 91 | 24 | 0.805 | 0.043 | Ce ii |
| 5147.554 | 201 | 31 | 6.107 | 0.023 | 1.000 | 239 | 32 | 0.504 | 0.022 | 166 | 32 | 0.812 | 0.032 | Ce ii |
| 5274.226 | 288 | 17 | 6.126 | 0.009 | 1.000 | 290 | 16 | 0.518 | 0.009 | 128 | 16 | 0.902 | 0.020 | Ce ii |
| 5451.102 | 295 | 18 | 6.123 | 0.009 | 1.000 | 298 | 18 | 0.377 | 0.010 | 120 | 18 | 0.761 | 0.024 | Ce ii |
| 5468.366 | 204 | 26 | 6.122 | 0.019 | 1.000 | 210 | 27 | 0.483 | 0.021 | 137 | 27 | 0.850 | 0.032 | Ce ii |
| 5975.808 | 165 | 34 | 6.105 | 0.031 | 0.994 | 176 | 39 | 0.440 | 0.036 | 96 | 39 | 0.785 | 0.066 | Ce ii |
| 6043.372 | 208 | 31 | 6.115 | 0.023 | 1.000 | 214 | 33 | 0.497 | 0.025 | 158 | 33 | 0.862 | 0.034 | Ce ii |
| Pr | ||||||||||||||
| HARPS | ||||||||||||||
| 5002.436 | 272 | 43 | 6.120 | 0.024 | 0.999 | 285 | 48 | 0.406 | 0.027 | 177 | 47 | 0.766 | 0.044 | Pr ii |
| 5110.759 | 190 | 17 | 6.116 | 0.013 | 1.000 | 199 | 17 | 0.468 | 0.014 | 106 | 16 | 0.828 | 0.026 | Pr ii |
| 5129.506 | 242 | 20 | 6.116 | 0.012 | 1.000 | 247 | 20 | 0.459 | 0.013 | 121 | 20 | 0.832 | 0.027 | Pr ii |
| 5135.123 | 305 | 32 | 6.094 | 0.015 | 1.000 | 326 | 34 | 0.458 | 0.017 | 163 | 34 | 0.796 | 0.034 | Pr ii |
| 5152.243 | 272 | 17 | 6.131 | 0.009 | 1.000 | 265 | 15 | 0.412 | 0.009 | 120 | 15 | 0.818 | 0.021 | Pr ii + Nd iii 5152.292 |
| 5292.598 | 215 | 20 | 6.127 | 0.015 | 1.000 | 208 | 22 | 0.472 | 0.017 | 109 | 21 | 0.877 | 0.032 | Pr ii |
| 5343.837 | 220 | 66 | 6.051 | 0.043 | 0.580 | 220 | 79 | 0.478 | 0.057 | 148 | 78 | 0.810 | 0.086 | Pr ii + Ce ii 5343.90 |
| 5681.862 | 414 | 78 | 6.253 | 0.029 | 0.998 | 93 | 94 | 0.263 | 0.002 | 360 | 95 | 0.982 | 0.042 | Pr ii |
| 6017.753 | 255 | 43 | 6.115 | 0.025 | 0.999 | 247 | 49 | 0.444 | 0.031 | 179 | 48 | 0.834 | 0.044 | Pr ii |
| 6165.922 | 229 | 32 | 6.086 | 0.020 | 1.000 | 254 | 35 | 0.481 | 0.022 | 155 | 34 | 0.803 | 0.037 | Pr ii |
| 6584.514 | 247 | 62 | 6.090 | 0.037 | 0.925 | 233 | 74 | 0.248 | 0.051 | 82 | 74 | 0.684 | 0.143 | Pr ii |
| 6656.788 | 320 | 37 | 6.090 | 0.017 | 1.000 | 318 | 45 | 0.403 | 0.023 | 20 | 45 | 0.400 | 0.033 | Pr ii |
| 6673.390 | 125 | 19 | 6.091 | 0.022 | 1.000 | 135 | 22 | 0.380 | 0.027 | 45 | 22 | 0.692 | 0.080 | Pr ii |
| 6673.695 | 421 | 46 | 6.127 | 0.016 | 1.000 | 136 | 24 | 0.396 | 0.029 | 64 | 24 | 0.728 | 0.061 | Pr ii |
| 4910.816 | 332 | 20 | 6.124 | 0.009 | 1.000 | 334 | 17 | 0.572 | 0.008 | 158 | 17 | 0.955 | 0.017 | Pr iii |
| 4929.109 | 302 | 20 | 6.103 | 0.010 | 1.000 | 306 | 21 | 0.555 | 0.011 | 116 | 21 | 0.927 | 0.030 | Pr iii |
| 5284.690 | 345 | 19 | 6.132 | 0.008 | 1.000 | 338 | 11 | 0.685 | 0.006 | 184 | 12 | 0.082 | 0.010 | Pr iii |
| 5299.986 | 332 | 18 | 6.131 | 0.008 | 1.000 | 327 | 12 | 0.678 | 0.006 | 173 | 13 | 0.074 | 0.012 | Pr iii |
| 5339.990 | 210 | 16 | 6.109 | 0.012 | 1.000 | 224 | 14 | 0.678 | 0.010 | 130 | 14 | 0.029 | 0.018 | Pr iii bl. |
| 5462.147 | 167 | 31 | 6.127 | 0.028 | 0.998 | 179 | 38 | 0.399 | 0.034 | 41 | 38 | 0.712 | 0.145 | Pr iii |
| 5765.251 | 358 | 46 | 6.112 | 0.019 | 1.000 | 337 | 49 | 0.556 | 0.023 | 226 | 49 | 0.963 | 0.035 | Pr iii |
| 5844.406 | 318 | 18 | 6.134 | 0.009 | 1.000 | 305 | 14 | 0.603 | 0.008 | 152 | 14 | 0.014 | 0.015 | Pr iii |
| 5956.040 | 307 | 14 | 6.122 | 0.007 | 1.000 | 308 | 9 | 0.656 | 0.005 | 140 | 9 | 0.043 | 0.011 | Pr iii |
| 5998.935 | 410 | 22 | 6.141 | 0.008 | 1.000 | 382 | 18 | 0.606 | 0.008 | 188 | 18 | 0.035 | 0.015 | Pr iii |
| 6052.995 | 402 | 23 | 6.141 | 0.009 | 1.000 | 384 | 15 | 0.623 | 0.006 | 220 | 15 | 0.029 | 0.011 | Pr iii |
| 6090.018 | 372 | 23 | 6.126 | 0.009 | 1.000 | 365 | 18 | 0.672 | 0.008 | 195 | 19 | 0.068 | 0.015 | Pr iii |
| 6160.238 | 346 | 18 | 6.121 | 0.008 | 1.000 | 342 | 12 | 0.657 | 0.006 | 172 | 12 | 0.051 | 0.012 | Pr iii |
| 6195.616 | 351 | 19 | 6.133 | 0.008 | 1.000 | 346 | 11 | 0.671 | 0.005 | 193 | 11 | 0.063 | 0.009 | Pr iii |
| 6500.019 | 386 | 33 | 6.128 | 0.013 | 1.000 | 378 | 35 | 0.544 | 0.015 | 182 | 35 | 0.944 | 0.031 | Pr iii |
| 6501.488 | 310 | 26 | 6.112 | 0.012 | 1.000 | 325 | 26 | 0.584 | 0.013 | 154 | 26 | 0.940 | 0.028 | Pr iii |
| 6578.880 | 384 | 33 | 6.117 | 0.013 | 1.000 | 376 | 36 | 0.592 | 0.016 | 142 | 37 | 0.999 | 0.041 | Pr iii |
| 6616.481 | 314 | 66 | 6.193 | 0.032 | 0.992 | 214 | 79 | 0.514 | 0.059 | 169 | 80 | 0.037 | 0.074 | Pr iii |
| 6692.225 | 281 | 54 | 6.197 | 0.030 | 0.998 | 245 | 61 | 0.547 | 0.040 | 230 | 61 | 0.929 | 0.043 | Pr iii |
| 6706.708 | 368 | 27 | 6.114 | 0.011 | 1.000 | 371 | 27 | 0.601 | 0.012 | 174 | 27 | 0.984 | 0.025 | Pr iii |
| Nd | ||||||||||||||
| UVES1 | ||||||||||||||
| 3339.057 | 128 | 12 | 6.111 | 0.016 | 1.000 | 131 | 16 | 0.379 | 0.019 | 42 | 15 | 0.662 | 0.061 | Nd ii |
| 3375.226 | 172 | 18 | 6.107 | 0.018 | 1.000 | 182 | 23 | 0.365 | 0.020 | 69 | 22 | 0.670 | 0.053 | Nd ii |
| 4061.099 | 156 | 6 | 6.117 | 0.007 | 1.000 | 163 | 6 | 0.433 | 0.006 | 60 | 6 | 0.727 | 0.016 | Nd ii |
| 4069.270 | 269 | 12 | 6.107 | 0.007 | 1.000 | 290 | 10 | 0.389 | 0.006 | 115 | 10 | 0.704 | 0.014 | Nd ii |
| 4211.294 | 217 | 14 | 6.101 | 0.009 | 1.000 | 241 | 8 | 0.367 | 0.006 | 90 | 8 | 0.710 | 0.015 | Nd ii |
| 3433.305 | 28 | 8 | 6.128 | 0.050 | 0.075 | 31 | 11 | 0.434 | 0.055 | 9 | 11 | 0.790 | 0.032 | Nd iii + Cr ii |
| 3442.767 | 138 | 11 | 6.121 | 0.014 | 1.000 | 147 | 12 | 0.437 | 0.014 | 66 | 12 | 0.741 | 0.030 | Nd iii |
| 3476.175 | 137 | 8 | 6.109 | 0.011 | 1.000 | 147 | 10 | 0.430 | 0.011 | 45 | 10 | 0.751 | 0.037 | Nd iii |
| 3477.830 | 86 | 5 | 6.096 | 0.012 | 1.000 | 99 | 6 | 0.454 | 0.011 | 40 | 6 | 0.819 | 0.027 | Nd iii |
| 3537.600 | 139 | 10 | 6.121 | 0.012 | 1.000 | 136 | 11 | 0.416 | 0.013 | 56 | 11 | 0.670 | 0.033 | Nd iii + Dy ii |
| 3561.860 | 132 | 13 | 6.134 | 0.017 | 1.000 | 134 | 15 | 0.394 | 0.018 | 66 | 15 | 0.666 | 0.037 | Nd iii + Ti ii |
| 3590.333 | 111 | 6 | 6.103 | 0.009 | 1.000 | 123 | 6 | 0.450 | 0.008 | 46 | 6 | 0.786 | 0.022 | Nd iii + Ce ii |
| 3597.625 | 129 | 7 | 6.119 | 0.009 | 1.000 | 137 | 7 | 0.484 | 0.009 | 55 | 7 | 0.790 | 0.021 | Nd iii |
| 3603.965 | 183 | 13 | 6.123 | 0.013 | 1.000 | 185 | 15 | 0.472 | 0.014 | 76 | 16 | 0.742 | 0.033 | Nd iii |
| 3612.330 | 225 | 14 | 6.118 | 0.011 | 1.000 | 238 | 15 | 0.529 | 0.011 | 97 | 15 | 0.832 | 0.026 | Nd iii + La ii |
| 3621.181 | 75 | 7 | 6.162 | 0.017 | 1.000 | 68 | 9 | 0.490 | 0.021 | 40 | 9 | 0.730 | 0.036 | Nd iii + Sm ii Co ii, Fe ii |
| 3644.374 | 134 | 9 | 6.108 | 0.012 | 1.000 | 148 | 9 | 0.482 | 0.010 | 77 | 9 | 0.803 | 0.020 | Nd iii |
| HARPS | ||||||||||||||
| 4061.091 | 229 | 14 | 6.125 | 0.009 | 1.000 | 233 | 8 | 0.473 | 0.006 | 127 | 8 | 0.847 | 0.011 | Nd ii |
| 4438.990 | 253 | 18 | 6.142 | 0.011 | 1.000 | 235 | 18 | 0.375 | 0.013 | 108 | 18 | 0.812 | 0.028 | Nd ii |
| 4462.982 | 324 | 16 | 6.132 | 0.008 | 1.000 | 316 | 10 | 0.424 | 0.005 | 155 | 9 | 0.826 | 0.010 | Nd ii |
| 4467.841 | 285 | 18 | 6.121 | 0.010 | 1.000 | 281 | 17 | 0.377 | 0.010 | 136 | 16 | 0.774 | 0.020 | Nd ii |
| 4556.722 | 309 | 27 | 6.131 | 0.013 | 1.000 | 308 | 25 | 0.369 | 0.013 | 189 | 25 | 0.753 | 0.021 | Nd ii |
| 4706.545 | 313 | 18 | 6.119 | 0.009 | 1.000 | 314 | 14 | 0.428 | 0.007 | 161 | 14 | 0.811 | 0.014 | Nd ii |
| 4717.084 | 296 | 21 | 6.083 | 0.010 | 1.000 | 308 | 23 | 0.364 | 0.012 | 129 | 23 | 0.708 | 0.028 | Nd ii |
| 4736.196 | 275 | 26 | 6.136 | 0.014 | 1.000 | 260 | 28 | 0.337 | 0.018 | 130 | 28 | 0.757 | 0.035 | Nd ii |
| 4763.290 | 347 | 45 | 6.087 | 0.019 | 1.000 | 341 | 51 | 0.328 | 0.024 | 173 | 51 | 0.716 | 0.048 | Nd ii |
| 4797.139 | 290 | 18 | 6.125 | 0.010 | 1.000 | 286 | 16 | 0.380 | 0.009 | 141 | 16 | 0.777 | 0.018 | Nd ii |
| 4799.412 | 290 | 17 | 6.123 | 0.009 | 1.000 | 283 | 16 | 0.357 | 0.009 | 124 | 16 | 0.762 | 0.022 | Nd ii |
| 4811.342 | 374 | 21 | 6.126 | 0.008 | 1.000 | 373 | 17 | 0.404 | 0.007 | 173 | 17 | 0.795 | 0.016 | Nd ii |
| 4818.968 | 336 | 36 | 6.083 | 0.016 | 1.000 | 360 | 41 | 0.328 | 0.018 | 159 | 41 | 0.655 | 0.041 | Nd ii |
| 4828.566 | 338 | 27 | 6.126 | 0.012 | 1.000 | 325 | 29 | 0.353 | 0.014 | 127 | 29 | 0.775 | 0.037 | Nd ii |
| 4947.010 | 291 | 21 | 6.131 | 0.011 | 1.000 | 280 | 22 | 0.346 | 0.013 | 116 | 22 | 0.765 | 0.031 | Nd ii |
| 4948.996 | 171 | 16 | 6.126 | 0.014 | 1.000 | 168 | 17 | 0.328 | 0.016 | 84 | 17 | 0.726 | 0.032 | Nd ii |
| 4959.120 | 351 | 19 | 6.133 | 0.008 | 1.000 | 345 | 14 | 0.397 | 0.007 | 168 | 14 | 0.795 | 0.014 | Nd ii |
| 4989.932 | 370 | 18 | 6.139 | 0.008 | 1.000 | 352 | 12 | 0.368 | 0.006 | 175 | 12 | 0.785 | 0.011 | Nd ii |
| 5033.499 | 310 | 19 | 6.121 | 0.009 | 1.000 | 313 | 17 | 0.369 | 0.009 | 139 | 17 | 0.752 | 0.020 | Nd ii |
| 5077.143 | 284 | 18 | 6.129 | 0.010 | 1.000 | 277 | 19 | 0.329 | 0.011 | 110 | 19 | 0.739 | 0.028 | Nd ii |
| 5089.818 | 279 | 17 | 6.102 | 0.009 | 1.000 | 289 | 17 | 0.372 | 0.010 | 117 | 17 | 0.730 | 0.024 | Nd ii |
| 5092.790 | 316 | 18 | 6.130 | 0.009 | 1.000 | 308 | 15 | 0.383 | 0.008 | 154 | 15 | 0.786 | 0.016 | Nd ii |
| 5096.509 | 274 | 17 | 6.139 | 0.010 | 1.000 | 261 | 16 | 0.327 | 0.010 | 129 | 16 | 0.742 | 0.020 | Nd ii |
| 5130.586 | 322 | 17 | 6.135 | 0.008 | 1.000 | 315 | 11 | 0.418 | 0.006 | 169 | 10 | 0.816 | 0.010 | Nd ii |
| 5132.324 | 341 | 20 | 6.136 | 0.009 | 1.000 | 332 | 15 | 0.389 | 0.007 | 180 | 15 | 0.789 | 0.014 | Nd ii |
| 5143.324 | 267 | 19 | 6.122 | 0.011 | 1.000 | 266 | 19 | 0.347 | 0.012 | 112 | 19 | 0.741 | 0.027 | Nd ii |
| 5176.765 | 280 | 21 | 6.132 | 0.012 | 1.000 | 283 | 20 | 0.357 | 0.012 | 148 | 20 | 0.739 | 0.023 | Nd ii |
| 5182.597 | 290 | 17 | 6.110 | 0.009 | 1.000 | 303 | 16 | 0.346 | 0.009 | 129 | 16 | 0.707 | 0.020 | Nd ii |
| 5212.346 | 309 | 19 | 6.121 | 0.009 | 1.000 | 311 | 16 | 0.393 | 0.008 | 152 | 15 | 0.778 | 0.017 | Nd ii |
| 5234.198 | 261 | 14 | 6.125 | 0.008 | 1.000 | 264 | 9 | 0.384 | 0.006 | 131 | 9 | 0.764 | 0.012 | Nd ii |
| 5255.504 | 363 | 19 | 6.123 | 0.008 | 1.000 | 363 | 15 | 0.400 | 0.007 | 158 | 14 | 0.789 | 0.015 | Nd ii |
| 5276.861 | 313 | 17 | 6.112 | 0.008 | 1.000 | 190 | 6 | 0.423 | 0.006 | 95 | 6 | 0.816 | 0.012 | Nd ii |
| 5356.959 | 332 | 19 | 6.141 | 0.009 | 1.000 | 321 | 15 | 0.371 | 0.008 | 132 | 15 | 0.743 | 0.019 | Nd ii |
| 5361.158 | 197 | 20 | 6.115 | 0.015 | 1.000 | 322 | 16 | 0.359 | 0.008 | 158 | 16 | 0.763 | 0.017 | Nd ii |
| 5361.469 | 267 | 14 | 6.123 | 0.008 | 1.000 | 269 | 9 | 0.407 | 0.006 | 133 | 9 | 0.789 | 0.012 | Nd ii |
| 5385.884 | 272 | 20 | 6.120 | 0.011 | 1.000 | 191 | 23 | 0.327 | 0.019 | 68 | 23 | 0.746 | 0.055 | Nd ii |
| 5399.084 | 381 | 42 | 6.162 | 0.016 | 1.000 | 279 | 19 | 0.365 | 0.011 | 147 | 19 | 0.735 | 0.021 | Nd ii |
| 5416.363 | 294 | 26 | 6.112 | 0.013 | 1.000 | 332 | 48 | 0.285 | 0.023 | 175 | 48 | 0.740 | 0.044 | Nd ii |
| 5431.514 | 304 | 19 | 6.129 | 0.010 | 1.000 | 307 | 27 | 0.360 | 0.014 | 153 | 27 | 0.721 | 0.029 | Nd ii |
| 5485.692 | 299 | 19 | 6.130 | 0.010 | 1.000 | 293 | 19 | 0.376 | 0.011 | 122 | 19 | 0.794 | 0.026 | Nd ii |
| 5533.817 | 276 | 25 | 6.126 | 0.014 | 1.000 | 255 | 28 | 0.331 | 0.017 | 115 | 27 | 0.777 | 0.039 | Nd ii |
| 5618.984 | 244 | 32 | 6.137 | 0.020 | 1.000 | 229 | 35 | 0.350 | 0.024 | 150 | 35 | 0.759 | 0.038 | Nd ii |
| 5702.247 | 296 | 21 | 6.117 | 0.011 | 1.000 | 304 | 22 | 0.347 | 0.012 | 129 | 22 | 0.721 | 0.028 | Nd ii |
| 5734.535 | 345 | 36 | 6.150 | 0.015 | 1.000 | 343 | 35 | 0.343 | 0.016 | 234 | 35 | 0.722 | 0.024 | Nd ii |
| 5804.004 | 286 | 17 | 6.132 | 0.009 | 1.000 | 279 | 15 | 0.371 | 0.009 | 133 | 15 | 0.774 | 0.019 | Nd ii |
| 5811.564 | 255 | 17 | 6.112 | 0.010 | 1.000 | 263 | 16 | 0.357 | 0.010 | 113 | 16 | 0.723 | 0.024 | Nd ii |
| 5825.838 | 296 | 17 | 6.137 | 0.009 | 1.000 | 280 | 18 | 0.324 | 0.010 | 108 | 17 | 0.758 | 0.027 | Nd ii |
| 5842.358 | 240 | 16 | 6.140 | 0.010 | 1.000 | 224 | 16 | 0.357 | 0.012 | 100 | 16 | 0.791 | 0.027 | Nd ii |
| 5865.018 | 235 | 21 | 6.129 | 0.014 | 1.000 | 227 | 24 | 0.334 | 0.017 | 67 | 24 | 0.766 | 0.059 | Nd ii |
| 6248.259 | 335 | 43 | 6.170 | 0.019 | 1.000 | 304 | 45 | 0.337 | 0.024 | 249 | 45 | 0.738 | 0.029 | Nd ii |
| 6341.460 | 266 | 28 | 6.142 | 0.016 | 1.000 | 255 | 31 | 0.329 | 0.020 | 112 | 31 | 0.744 | 0.045 | Nd ii |
| 6365.524 | 281 | 32 | 6.105 | 0.017 | 1.000 | 286 | 36 | 0.329 | 0.020 | 139 | 35 | 0.704 | 0.041 | Nd ii |
| 6637.170 | 321 | 36 | 6.120 | 0.017 | 1.000 | 335 | 35 | 0.375 | 0.017 | 238 | 35 | 0.735 | 0.024 | Nd ii |
| 6637.942 | 357 | 27 | 6.137 | 0.012 | 1.000 | 346 | 26 | 0.357 | 0.012 | 183 | 26 | 0.761 | 0.023 | Nd ii |
| 6650.499 | 340 | 27 | 6.108 | 0.012 | 1.000 | 355 | 28 | 0.366 | 0.012 | 168 | 27 | 0.726 | 0.026 | Nd ii |
| 6680.125 | 235 | 39 | 6.129 | 0.025 | 0.999 | 242 | 46 | 0.300 | 0.031 | 66 | 46 | 0.667 | 0.112 | Nd ii |
| 4445.010 | 274 | 16 | 6.127 | 0.009 | 1.000 | 274 | 13 | 0.442 | 0.008 | 133 | 12 | 0.830 | 0.016 | Nd iii + Co i |
| 4473.290 | 292 | 15 | 6.124 | 0.008 | 1.000 | 292 | 9 | 0.456 | 0.005 | 139 | 9 | 0.843 | 0.011 | Nd iii |
| 4514.140 | 247 | 15 | 6.129 | 0.009 | 1.000 | 247 | 10 | 0.461 | 0.006 | 143 | 9 | 0.845 | 0.011 | Nd iii |
| 4627.260 | 236 | 13 | 6.120 | 0.008 | 1.000 | 239 | 9 | 0.426 | 0.007 | 115 | 9 | 0.808 | 0.014 | Nd iii |
| 4651.618 | 308 | 14 | 6.126 | 0.007 | 1.000 | 306 | 7 | 0.448 | 0.004 | 141 | 7 | 0.840 | 0.009 | Nd iii |
| 4654.312 | 304 | 15 | 6.125 | 0.008 | 1.000 | 305 | 8 | 0.475 | 0.004 | 155 | 8 | 0.859 | 0.009 | Nd iii |
| 4689.053 | 308 | 16 | 6.127 | 0.008 | 1.000 | 303 | 10 | 0.449 | 0.006 | 151 | 10 | 0.845 | 0.011 | Nd iii |
| 4711.331 | 314 | 15 | 6.120 | 0.007 | 1.000 | 315 | 9 | 0.458 | 0.005 | 145 | 9 | 0.842 | 0.011 | Nd iii |
| 4759.536 | 227 | 12 | 6.134 | 0.008 | 1.000 | 223 | 6 | 0.477 | 0.005 | 126 | 6 | 0.869 | 0.009 | Nd iii |
| 4769.622 | 330 | 35 | 6.183 | 0.016 | 1.000 | 290 | 9 | 0.461 | 0.005 | 156 | 9 | 0.861 | 0.010 | Nd iii |
| 4788.459 | 312 | 17 | 6.133 | 0.008 | 1.000 | 305 | 12 | 0.459 | 0.006 | 160 | 11 | 0.856 | 0.012 | Nd iii |
| 4796.499 | 277 | 14 | 6.128 | 0.008 | 1.000 | 272 | 8 | 0.469 | 0.005 | 135 | 8 | 0.865 | 0.010 | Nd iii |
| 4821.990 | 287 | 19 | 6.128 | 0.010 | 1.000 | 289 | 13 | 0.427 | 0.008 | 158 | 13 | 0.805 | 0.014 | Nd iii |
| 4911.651 | 298 | 14 | 6.128 | 0.007 | 1.000 | 294 | 8 | 0.472 | 0.004 | 138 | 8 | 0.867 | 0.010 | Nd iii |
| 4912.941 | 330 | 16 | 6.132 | 0.008 | 1.000 | 323 | 9 | 0.458 | 0.005 | 159 | 9 | 0.858 | 0.010 | Nd iii |
| 4914.090 | 299 | 15 | 6.126 | 0.008 | 1.000 | 296 | 9 | 0.491 | 0.005 | 149 | 9 | 0.883 | 0.010 | Nd iii |
| 4927.480 | 254 | 12 | 6.123 | 0.007 | 1.000 | 257 | 6 | 0.515 | 0.004 | 125 | 6 | 0.894 | 0.009 | Nd iii |
| 4942.638 | 277 | 14 | 6.130 | 0.008 | 1.000 | 270 | 8 | 0.450 | 0.005 | 145 | 8 | 0.849 | 0.010 | Nd iii |
| 5050.693 | 247 | 13 | 6.129 | 0.008 | 1.000 | 240 | 8 | 0.502 | 0.006 | 121 | 8 | 0.906 | 0.011 | Nd iii |
| 5084.656 | 240 | 18 | 6.126 | 0.012 | 1.000 | 242 | 16 | 0.458 | 0.011 | 139 | 16 | 0.839 | 0.019 | Nd iii |
| 5084.987 | 297 | 17 | 6.128 | 0.009 | 1.000 | 298 | 13 | 0.420 | 0.007 | 151 | 12 | 0.806 | 0.014 | Nd iii |
| 5127.047 | 229 | 12 | 6.124 | 0.008 | 1.000 | 227 | 8 | 0.538 | 0.006 | 119 | 8 | 0.927 | 0.011 | Nd iii |
| 5151.746 | 240 | 13 | 6.127 | 0.008 | 1.000 | 238 | 8 | 0.449 | 0.006 | 125 | 8 | 0.839 | 0.011 | Nd iii |
| 5193.031 | 227 | 11 | 6.121 | 0.008 | 1.000 | 231 | 7 | 0.520 | 0.005 | 112 | 7 | 0.897 | 0.011 | Nd iii |
| 5203.923 | 217 | 11 | 6.131 | 0.008 | 1.000 | 213 | 5 | 0.540 | 0.004 | 113 | 5 | 0.934 | 0.007 | Nd iii |
| 5286.724 | 322 | 16 | 6.125 | 0.008 | 1.000 | 312 | 13 | 0.399 | 0.007 | 140 | 13 | 0.809 | 0.015 | Nd iii |
| 5294.109 | 254 | 13 | 6.126 | 0.008 | 1.000 | 253 | 8 | 0.558 | 0.005 | 125 | 8 | 0.947 | 0.010 | Nd iii |
| 5410.094 | 278 | 15 | 6.117 | 0.008 | 1.000 | 281 | 10 | 0.496 | 0.006 | 144 | 10 | 0.875 | 0.012 | Nd iii |
| 5429.756 | 161 | 10 | 6.139 | 0.010 | 1.000 | 155 | 8 | 0.522 | 0.009 | 89 | 8 | 0.925 | 0.016 | Nd iii + Fe i |
| 5566.012 | 272 | 17 | 6.123 | 0.009 | 1.000 | 273 | 12 | 0.444 | 0.007 | 149 | 11 | 0.827 | 0.013 | Nd iii |
| 5633.549 | 315 | 19 | 6.119 | 0.009 | 1.000 | 318 | 15 | 0.444 | 0.008 | 166 | 15 | 0.825 | 0.015 | Nd iii |
| 5677.174 | 340 | 23 | 6.135 | 0.010 | 1.000 | 329 | 20 | 0.483 | 0.010 | 179 | 19 | 0.886 | 0.018 | Nd iii |
| 5802.532 | 327 | 18 | 6.137 | 0.009 | 1.000 | 315 | 12 | 0.460 | 0.006 | 172 | 12 | 0.864 | 0.012 | Nd iii |
| 5845.017 | 277 | 15 | 6.126 | 0.008 | 1.000 | 276 | 9 | 0.493 | 0.005 | 143 | 9 | 0.881 | 0.011 | Nd iii |
| 5851.529 | 274 | 14 | 6.122 | 0.008 | 1.000 | 278 | 8 | 0.458 | 0.005 | 145 | 8 | 0.837 | 0.009 | Nd iii |
| 5987.677 | 317 | 18 | 6.138 | 0.009 | 1.000 | 306 | 13 | 0.500 | 0.007 | 164 | 13 | 0.902 | 0.013 | Nd iii |
| 6145.062 | 271 | 14 | 6.132 | 0.008 | 1.000 | 263 | 9 | 0.506 | 0.006 | 138 | 9 | 0.908 | 0.011 | Nd iii |
| 6327.265 | 266 | 14 | 6.118 | 0.008 | 1.000 | 271 | 9 | 0.515 | 0.006 | 141 | 9 | 0.890 | 0.011 | Nd iii |
| 6526.638 | 88 | 8 | 6.110 | 0.015 | 1.000 | 94 | 9 | 0.450 | 0.016 | 46 | 9 | 0.795 | 0.033 | Nd iii |
| 6550.228 | 325 | 20 | 6.132 | 0.009 | 1.000 | 291 | 12 | 0.515 | 0.007 | 151 | 12 | 0.905 | 0.013 | Nd iii |
| 6690.821 | 327 | 24 | 6.133 | 0.011 | 1.000 | 307 | 26 | 0.412 | 0.014 | 125 | 26 | 0.851 | 0.034 | Nd iii |
| Sm | ||||||||||||||
| UVES1 | ||||||||||||||
| 3414.471 | 198 | 10 | 6.111 | 0.009 | 1.000 | 208 | 12 | 0.460 | 0.009 | 54 | 21 | 0.764 | 0.036 | Sm iii |
| 3444.543 | 211 | 15 | 6.110 | 0.012 | 1.000 | 223 | 19 | 0.473 | 0.014 | 55 | 19 | 0.787 | 0.055 | Sm iii |
| HARPS | ||||||||||||||
| 4499.464 | 339 | 20 | 6.127 | 0.009 | 1.000 | 334 | 16 | 0.369 | 0.008 | 162 | 16 | 0.765 | 0.017 | Sm ii |
| 4505.029 | 305 | 26 | 6.151 | 0.013 | 1.000 | 258 | 28 | 0.320 | 0.017 | 130 | 28 | 0.815 | 0.035 | Sm ii |
| 4515.082 | 387 | 23 | 6.130 | 0.009 | 1.000 | 384 | 16 | 0.404 | 0.007 | 211 | 16 | 0.793 | 0.013 | Sm ii |
| 4523.902 | 338 | 19 | 6.129 | 0.009 | 1.000 | 340 | 14 | 0.405 | 0.007 | 173 | 14 | 0.790 | 0.013 | Sm ii |
| 4542.037 | 359 | 73 | 6.063 | 0.029 | 0.994 | 375 | 88 | 0.339 | 0.037 | 112 | 89 | 0.632 | 0.124 | Sm ii |
| 4566.196 | 330 | 17 | 6.135 | 0.008 | 1.000 | 313 | 14 | 0.380 | 0.007 | 146 | 13 | 0.803 | 0.016 | Sm ii |
| 4577.688 | 337 | 17 | 6.138 | 0.008 | 1.000 | 322 | 13 | 0.391 | 0.006 | 159 | 13 | 0.804 | 0.013 | Sm ii |
| 4674.579 | 290 | 14 | 6.129 | 0.008 | 1.000 | 284 | 10 | 0.402 | 0.006 | 135 | 10 | 0.804 | 0.012 | Sm ii |
| 4676.904 | 329 | 17 | 6.136 | 0.008 | 1.000 | 322 | 14 | 0.375 | 0.007 | 148 | 14 | 0.778 | 0.015 | Sm ii |
| 4693.624 | 233 | 25 | 6.099 | 0.016 | 1.000 | 250 | 29 | 0.331 | 0.018 | 92 | 29 | 0.661 | 0.050 | Sm ii |
| 4781.815 | 191 | 30 | 6.146 | 0.023 | 1.000 | 192 | 34 | 0.321 | 0.028 | 112 | 34 | 0.700 | 0.048 | Sm ii |
| 4791.560 | 293 | 31 | 6.141 | 0.016 | 1.000 | 266 | 35 | 0.339 | 0.021 | 119 | 35 | 0.798 | 0.048 | Sm ii |
| 4952.362 | 267 | 23 | 6.131 | 0.013 | 1.000 | 263 | 25 | 0.328 | 0.015 | 115 | 25 | 0.727 | 0.036 | Sm ii |
| 5052.740 | 224 | 15 | 6.126 | 0.011 | 1.000 | 232 | 12 | 0.364 | 0.009 | 131 | 12 | 0.731 | 0.016 | Sm ii |
| 5103.079 | 280 | 19 | 6.118 | 0.010 | 1.000 | 280 | 20 | 0.350 | 0.011 | 115 | 19 | 0.739 | 0.028 | Sm ii |
| 6426.573 | 206 | 43 | 6.089 | 0.031 | 0.989 | 230 | 51 | 0.312 | 0.036 | 64 | 52 | 0.553 | 0.127 | Sm ii |
| 6589.695 | 507 | 76 | 6.105 | 0.022 | 1.000 | 484 | 88 | 0.291 | 0.029 | 225 | 88 | 0.708 | 0.063 | Sm ii |
| Eu | ||||||||||||||
| HARPS | ||||||||||||||
| 6049.502 | 93 | 22 | 6.127 | 0.036 | 0.891 | 97 | 26 | 0.276 | 0.044 | 56 | 26 | 0.641 | 0.075 | Eu ii |
| 6173.050 | 136 | 21 | 6.088 | 0.023 | 1.000 | 141 | 25 | 0.261 | 0.028 | 41 | 25 | 0.595 | 0.096 | Eu ii |
| 6437.636 | 149 | 14 | 6.093 | 0.015 | 1.000 | 154 | 16 | 0.271 | 0.017 | 74 | 16 | 0.628 | 0.035 | Eu ii |
| 6645.102 | 175 | 15 | 6.161 | 0.013 | 1.000 | 149 | 13 | 0.256 | 0.015 | 101 | 14 | 0.669 | 0.022 | Eu ii |
| Gd | ||||||||||||||
| UVES1 | ||||||||||||||
| 3418.714 | 268 | 20 | 6.134 | 0.013 | 1.000 | 258 | 24 | 0.606 | 0.016 | 106 | 25 | 0.854 | 0.037 | Gd ii |
| 3451.223 | 238 | 25 | 6.128 | 0.018 | 1.000 | 232 | 30 | 0.543 | 0.021 | 121 | 30 | 0.805 | 0.040 | Gd ii |
| 3473.216 | 209 | 14 | 6.123 | 0.012 | 1.000 | 213 | 15 | 0.581 | 0.012 | 96 | 15 | 0.864 | 0.026 | Gd ii |
| 3481.771 | 186 | 11 | 6.135 | 0.011 | 1.000 | 180 | 13 | 0.581 | 0.012 | 76 | 13 | 0.834 | 0.027 | Gd ii |
| 3512.199 | 138 | 12 | 6.144 | 0.015 | 1.000 | 130 | 14 | 0.583 | 0.018 | 62 | 14 | 0.824 | 0.037 | Gd ii |
| 3528.508 | 188 | 18 | 6.141 | 0.013 | 1.000 | 172 | 23 | 0.525 | 0.022 | 49 | 23 | 0.701 | 0.077 | Gd ii |
| 3622.791 | 320 | 30 | 6.111 | 0.013 | 1.000 | 336 | 38 | 0.447 | 0.018 | 112 | 38 | 0.748 | 0.053 | Gd ii |
| HARPS | ||||||||||||||
| 4498.285 | 193 | 21 | 6.083 | 0.016 | 1.000 | 209 | 22 | 0.490 | 0.017 | 120 | 22 | 0.822 | 0.030 | Gd ii |
| 4732.597 | 240 | 23 | 6.160 | 0.015 | 1.000 | 235 | 21 | 0.506 | 0.014 | 182 | 21 | 0.882 | 0.019 | Gd ii |
| 5092.228 | 270 | 29 | 6.138 | 0.016 | 1.000 | 262 | 31 | 0.438 | 0.019 | 137 | 30 | 0.840 | 0.036 | Gd ii |
| 5186.893 | 140 | 31 | 6.146 | 0.034 | 0.983 | 132 | 36 | 0.461 | 0.044 | 84 | 36 | 0.864 | 0.069 | Gd ii |
| 5560.666 | 291 | 54 | 6.188 | 0.028 | 0.999 | 245 | 61 | 0.460 | 0.040 | 203 | 61 | 0.879 | 0.048 | Gd ii |
| Tb | ||||||||||||||
| HARPS | ||||||||||||||
| 5505.391 | 427 | 26 | 6.140 | 0.009 | 1.000 | 413 | 16 | 0.940 | 0.006 | 251 | 16 | 0.338 | 0.010 | Tb iii |
| 5847.213 | 416 | 34 | 6.152 | 0.013 | 1.000 | 405 | 29 | 0.929 | 0.012 | 277 | 29 | 0.316 | 0.017 | Tb iii |
| 6092.916 | 258 | 23 | 6.133 | 0.013 | 1.000 | 252 | 23 | 0.952 | 0.015 | 144 | 22 | 0.349 | 0.026 | Tb iii |
| 6323.570 | 340 | 24 | 6.163 | 0.011 | 1.000 | 304 | 22 | 0.851 | 0.012 | 190 | 22 | 0.277 | 0.019 | Tb iii |
| 6511.043 | 261 | 34 | 6.125 | 0.019 | 1.000 | 246 | 39 | 0.881 | 0.025 | 113 | 38 | 0.309 | 0.055 | Tb iii |
| 6537.786 | 275 | 51 | 6.134 | 0.028 | 0.999 | 261 | 60 | 0.846 | 0.037 | 107 | 59 | 0.275 | 0.090 | Tb iii |
| 6687.701 | 342 | 59 | 6.125 | 0.026 | 0.999 | 324 | 70 | 0.902 | 0.035 | 128 | 70 | 0.335 | 0.088 | Tb iii |
| Dy | ||||||||||||||
| UVES1 | ||||||||||||||
| 3407.780 | 213 | 12 | 6.103 | 0.010 | 1.000 | 230 | 14 | 0.485 | 0.010 | 78 | 14 | 0.809 | 0.010 | Dy ii |
| 3429.413 | 356 | 20 | 6.103 | 0.010 | 1.000 | 382 | 24 | 0.406 | 0.010 | 114 | 24 | 0.732 | 0.010 | Dy ii |
| 3434.349 | 289 | 16 | 6.136 | 0.009 | 1.000 | 283 | 14 | 0.449 | 0.008 | 142 | 14 | 0.712 | 0.009 | Dy ii |
| 3534.927 | 222 | 12 | 6.118 | 0.009 | 1.000 | 227 | 13 | 0.470 | 0.009 | 85 | 13 | 0.751 | 0.009 | Dy ii |
| 3538.492 | 284 | 14 | 6.120 | 0.009 | 1.000 | 292 | 14 | 0.467 | 0.008 | 114 | 15 | 0.752 | 0.009 | Dy ii |
| 3550.198 | 312 | 17 | 6.126 | 0.009 | 1.000 | 315 | 19 | 0.453 | 0.010 | 109 | 19 | 0.724 | 0.009 | Dy ii |
| 3563.131 | 307 | 18 | 6.124 | 0.010 | 1.000 | 317 | 18 | 0.443 | 0.009 | 136 | 18 | 0.729 | 0.010 | Dy ii |
| 3602.797 | 144 | 33 | 6.352 | 0.042 | 0.976 | 178 | 39 | 0.315 | 0.035 | 190 | 39 | 0.687 | 0.042 | Dy ii |
| 3619.127 | 224 | 11 | 6.124 | 0.009 | 1.000 | 228 | 12 | 0.482 | 0.009 | 78 | 12 | 0.757 | 0.009 | Dy iii |
| 3919.415 | 287 | 13 | 6.129 | 0.008 | 1.000 | 278 | 14 | 0.490 | 0.008 | 95 | 14 | 0.728 | 0.008 | Dy iii |
| HARPS | ||||||||||||||
| 4468.127 | 298 | 23 | 6.135 | 0.012 | 1.000 | 288 | 23 | 0.417 | 0.013 | 143 | 23 | 0.823 | 0.026 | Dy ii |
| 4503.232 | 243 | 28 | 6.132 | 0.017 | 1.000 | 254 | 27 | 0.449 | 0.017 | 183 | 26 | 0.807 | 0.024 | Dy ii |
| 4573.834 | 268 | 29 | 6.110 | 0.016 | 1.000 | 272 | 33 | 0.367 | 0.019 | 120 | 33 | 0.746 | 0.044 | Dy ii |
| 4731.843 | 318 | 22 | 6.127 | 0.011 | 1.000 | 314 | 22 | 0.393 | 0.011 | 139 | 22 | 0.792 | 0.026 | Dy ii |
| 4923.162 | 287 | 27 | 6.172 | 0.014 | 1.000 | 234 | 30 | 0.356 | 0.021 | 146 | 30 | 0.833 | 0.033 | Dy ii |
| 4409.880 | 367 | 20 | 6.131 | 0.008 | 1.000 | 355 | 14 | 0.452 | 0.006 | 183 | 13 | 0.859 | 0.012 | Dy iii |
| 4502.903 | 376 | 27 | 6.135 | 0.011 | 1.000 | 367 | 22 | 0.432 | 0.010 | 212 | 22 | 0.828 | 0.017 | Dy iii |
| 4572.891 | 325 | 18 | 6.125 | 0.009 | 1.000 | 326 | 12 | 0.505 | 0.006 | 171 | 12 | 0.889 | 0.012 | Dy iii |
| 5730.329 | 354 | 25 | 6.119 | 0.011 | 1.000 | 360 | 21 | 0.464 | 0.010 | 193 | 21 | 0.839 | 0.018 | Dy iii |
| 6655.463 | 289 | 53 | 6.203 | 0.028 | 0.999 | 254 | 59 | 0.517 | 0.037 | 249 | 59 | 0.908 | 0.038 | Dy iii 6655.375 |
| + C i 6655.517 | ||||||||||||||
| Ho | ||||||||||||||
| UVES1 | ||||||||||||||
| 3398.913 | 181 | 13 | 6.097 | 0.013 | 1.000 | 195 | 16 | 0.608 | 0.013 | 72 | 16 | 0.934 | 0.036 | Ho ii |
| 3416.431 | 283 | 22 | 6.114 | 0.013 | 1.000 | 292 | 26 | 0.618 | 0.015 | 112 | 26 | 0.911 | 0.038 | Ho ii |
| 3456.007 | 354 | 21 | 6.116 | 0.010 | 1.000 | 349 | 20 | 0.657 | 0.010 | 178 | 21 | 0.929 | 0.019 | Ho ii |
| 3581.420 | 291 | 23 | 6.116 | 0.013 | 1.000 | 291 | 25 | 0.686 | 0.014 | 143 | 26 | 0.966 | 0.029 | Ho iii |
| Er | ||||||||||||||
| UVES1 | ||||||||||||||
| 3307.460 | 122 | 28 | 6.068 | 0.038 | 0.960 | 138 | 36 | 0.418 | 0.041 | 55 | 36 | 0.790 | 0.104 | Er ii |
| 3486.795 | 146 | 13 | 6.119 | 0.016 | 1.000 | 156 | 16 | 0.476 | 0.017 | 67 | 16 | 0.781 | 0.038 | Er ii |
| 3559.885 | 253 | 18 | 6.132 | 0.013 | 1.000 | 256 | 20 | 0.529 | 0.013 | 132 | 20 | 0.812 | 0.024 | Er ii |
| 3633.527 | 224 | 19 | 6.137 | 0.015 | 1.000 | 220 | 21 | 0.481 | 0.015 | 127 | 21 | 0.752 | 0.026 | Er ii |
| HARPS | ||||||||||||||
| 4630.867 | 209 | 18 | 6.126 | 0.013 | 1.000 | 209 | 19 | 0.465 | 0.015 | 97 | 19 | 0.852 | 0.032 | Er ii |
| 4675.634 | 187 | 14 | 6.117 | 0.012 | 1.000 | 191 | 12 | 0.564 | 0.011 | 114 | 12 | 0.934 | 0.018 | Er ii |
| 5028.892 | 218 | 37 | 6.024 | 0.024 | 0.999 | 186 | 46 | 0.466 | 0.039 | 51 | 45 | 0.904 | 0.143 | Er ii |
| 6015.724 | 88 | 20 | 6.055 | 0.038 | 0.938 | 99 | 26 | 0.266 | 0.041 | 78 | 26 | 0.603 | 0.053 | Er ii |
| 4421.962 | 102 | 5 | 6.137 | 0.008 | 1.000 | 97 | 4 | 0.723 | 0.007 | 51 | 4 | 0.136 | 0.014 | Er iii bl. |
| 4735.548 | 351 | 23 | 6.136 | 0.010 | 1.000 | 343 | 17 | 0.639 | 0.008 | 209 | 17 | 0.031 | 0.013 | Er iii |
| Tm | ||||||||||||||
| UVES1 | ||||||||||||||
| 3462.182 | 230 | 14 | 6.121 | 0.011 | 1.000 | 236 | 14 | 0.550 | 0.010 | 109 | 14 | 0.837 | 0.021 | Tm ii |
| Lu | ||||||||||||||
| HARPS | ||||||||||||||
| 4785.408 | 83 | 30 | 2.928 | 0.012 | 0.105 | 52 | 36 | 0.358 | 0.110 | 31 | 35 | 0.790 | 0.028 | Lu ii |
| 4994.141 | 35 | 12 | 4.860 | 0.033 | 0.133 | 18 | 15 | 0.310 | 0.132 | 20 | 14 | 0.949 | 0.118 | Lu ii |
| 6199.640 | 80 | 30 | 7.996 | 0.095 | 0.037 | 62 | 37 | 0.289 | 0.094 | 18 | 37 | 0.979 | 0.005 | Lu ii |
| 6221.844 | 93 | 29 | 6.212 | 0.047 | 0.496 | 49 | 34 | 0.502 | 0.112 | 60 | 34 | 0.232 | 0.093 | Lu ii |
| Th | ||||||||||||||
| HARPS | ||||||||||||||
| 5376.120 | 86 | 30 | 4.145 | 0.024 | 0.097 | 61 | 32 | 0.416 | 0.084 | 19 | 31 | 0.834 | 0.106 | Th iii |
| 6599.473 | 111 | 47 | 4.432 | 0.034 | 0.002 | 132 | 56 | 0.787 | 0.067 | 162 | 56 | 0.957 | 0.055 | Th iii |
| Unidentified lines | ||||||||||||||
| UVES1 | ||||||||||||||
| 3469.888 | 140 | 23 | 6.116 | 0.027 | 0.999 | 245 | 19 | 0.472 | 0.013 | 62 | 19 | 0.773 | 0.050 | |
| 3538.886 | 163 | 10 | 6.125 | 0.011 | 1.000 | 171 | 12 | 0.425 | 0.011 | 50 | 12 | 0.719 | 0.038 | |
| 3555.348 | 237 | 16 | 6.102 | 0.011 | 1.000 | 262 | 18 | 0.419 | 0.011 | 111 | 18 | 0.749 | 0.026 | Nd iii 3555.356 |
| 3638.758 | 170 | 14 | 6.095 | 0.014 | 1.000 | 198 | 16 | 0.328 | 0.013 | 87 | 16 | 0.697 | 0.030 | |
| 4211.014 | 173 | 15 | 6.105 | 0.011 | 1.000 | 193 | 6 | 0.380 | 0.006 | 76 | 6 | 0.715 | 0.014 | Nd iii 4211.003 |
| HARPS | ||||||||||||||
| 4406.138 | 289 | 18 | 6.116 | 0.010 | 1.000 | 289 | 19 | 0.393 | 0.011 | 105 | 19 | 0.784 | 0.030 | Nd iii 4406.146 |
| 4499.179 | 110 | 15 | 6.111 | 0.020 | 1.000 | 113 | 18 | 0.387 | 0.025 | 32 | 17 | 0.757 | 0.088 | |
| 4507.522 | 275 | 15 | 6.131 | 0.008 | 1.000 | 269 | 13 | 0.392 | 0.008 | 116 | 12 | 0.797 | 0.018 | Nd iii 4507.522 |
| 4532.095 | 285 | 15 | 6.126 | 0.008 | 1.000 | 285 | 11 | 0.400 | 0.007 | 133 | 11 | 0.788 | 0.014 | |
| 4534.935 | 223 | 10 | 6.123 | 0.007 | 1.000 | 223 | 7 | 0.413 | 0.005 | 97 | 7 | 0.802 | 0.013 | Nd iii 4534.941 |
| 4544.236 | 215 | 14 | 6.105 | 0.010 | 1.000 | 228 | 14 | 0.333 | 0.010 | 86 | 14 | 0.678 | 0.027 | |
| 4546.628 | 257 | 16 | 6.115 | 0.009 | 1.000 | 268 | 12 | 0.465 | 0.008 | 135 | 12 | 0.826 | 0.015 | |
| 4570.637 | 363 | 18 | 6.128 | 0.008 | 1.000 | 361 | 11 | 0.453 | 0.005 | 177 | 11 | 0.842 | 0.010 | Nd iii 4570.660 |
| 4584.509 | 341 | 25 | 6.129 | 0.011 | 1.000 | 339 | 25 | 0.403 | 0.012 | 164 | 24 | 0.794 | 0.025 | Nd iii 4584.512 |
| 4603.791 | 257 | 15 | 6.133 | 0.009 | 1.000 | 250 | 10 | 0.423 | 0.007 | 135 | 10 | 0.822 | 0.013 | |
| 4604.590 | 124 | 10 | 6.123 | 0.012 | 1.000 | 128 | 9 | 0.363 | 0.012 | 65 | 9 | 0.735 | 0.024 | Nd iii 4604.606 |
| 4621.174 | 356 | 28 | 6.151 | 0.012 | 1.000 | 332 | 26 | 0.431 | 0.013 | 202 | 26 | 0.844 | 0.021 | |
| 4631.875 | 250 | 20 | 6.131 | 0.012 | 1.000 | 251 | 20 | 0.362 | 0.013 | 119 | 20 | 0.746 | 0.028 | |
| 4642.979 | 242 | 16 | 6.126 | 0.010 | 1.000 | 240 | 13 | 0.421 | 0.009 | 135 | 13 | 0.810 | 0.016 | Nd iii 4642.973 |
| 4650.210 | 273 | 25 | 6.143 | 0.014 | 1.000 | 247 | 28 | 0.323 | 0.018 | 102 | 28 | 0.788 | 0.045 | |
| 4654.039 | 304 | 15 | 6.125 | 0.008 | 1.000 | 229 | 8 | 0.455 | 0.006 | 122 | 8 | 0.860 | 0.012 | Nd iii 4654.014 |
| 4683.683 | 195 | 19 | 6.114 | 0.015 | 1.000 | 189 | 22 | 0.368 | 0.019 | 75 | 22 | 0.781 | 0.047 | |
| 4685.816 | 344 | 38 | 6.137 | 0.017 | 1.000 | 338 | 42 | 0.415 | 0.020 | 171 | 41 | 0.811 | 0.039 | |
| 4688.177 | 83 | 24 | 6.178 | 0.045 | 0.628 | 88 | 23 | 0.358 | 0.043 | 81 | 23 | 0.769 | 0.047 | Nd iii 4688.134 |
| 4688.632 | 104 | 20 | 6.195 | 0.030 | 0.996 | 61 | 29 | 0.408 | 0.076 | 32 | 29 | 0.012 | 0.146 | Nd iii 4688.690 + Tb ii |
| 4693.286 | 219 | 11 | 6.129 | 0.008 | 1.000 | 216 | 9 | 0.430 | 0.007 | 101 | 9 | 0.825 | 0.014 | |
| 4713.531 | 269 | 14 | 6.136 | 0.008 | 1.000 | 262 | 9 | 0.459 | 0.005 | 144 | 8 | 0.856 | 0.010 | Nd iii 4713.495 |
| 4720.752 | 229 | 16 | 6.150 | 0.011 | 1.000 | 209 | 16 | 0.415 | 0.013 | 110 | 16 | 0.850 | 0.024 | Nd iii 4720.740 |
| 4722.845 | 282 | 18 | 6.136 | 0.010 | 1.000 | 272 | 17 | 0.370 | 0.010 | 133 | 17 | 0.779 | 0.021 | Nd iii 4722.846 |
| 4723.710 | 253 | 41 | 6.071 | 0.023 | 0.999 | 280 | 48 | 0.366 | 0.027 | 122 | 48 | 0.654 | 0.063 | |
| 4734.757 | 237 | 25 | 6.144 | 0.016 | 1.000 | 220 | 27 | 0.443 | 0.020 | 127 | 26 | 0.865 | 0.034 | Nd iii 4734.731 |
| 4746.003 | 244 | 12 | 6.125 | 0.008 | 1.000 | 245 | 8 | 0.431 | 0.005 | 113 | 8 | 0.817 | 0.012 | Nd iii 4745.983 |
| 4748.168 | 29 | 9 | 6.566 | 0.054 | 0.375 | 17 | 11 | 0.642 | 0.103 | 11 | 11 | 0.465 | 0.004 | |
| 4769.314 | 330 | 35 | 6.183 | 0.016 | 1.000 | 251 | 40 | 0.309 | 0.026 | 180 | 40 | 0.803 | 0.036 | |
| 4770.899 | 150 | 8 | 6.124 | 0.008 | 1.000 | 152 | 6 | 0.420 | 0.007 | 70 | 6 | 0.801 | 0.015 | Nd iii 4770.884 |
| 4787.429 | 184 | 43 | 6.095 | 0.034 | 0.967 | 222 | 50 | 0.353 | 0.036 | 138 | 50 | 0.646 | 0.057 | |
| 4794.247 | 329 | 19 | 6.117 | 0.009 | 1.000 | 333 | 15 | 0.409 | 0.007 | 160 | 14 | 0.787 | 0.015 | Nd iii 4794.224 |
| 4799.910 | 201 | 10 | 6.135 | 0.008 | 1.000 | 192 | 8 | 0.419 | 0.007 | 95 | 8 | 0.835 | 0.014 | Nd iii 4799.887 |
| 4804.717 | 245 | 20 | 6.092 | 0.012 | 1.000 | 255 | 20 | 0.401 | 0.013 | 134 | 20 | 0.756 | 0.025 | Nd iii 4804.719 |
| 4810.374 | 338 | 18 | 6.128 | 0.008 | 1.000 | 324 | 13 | 0.404 | 0.006 | 158 | 13 | 0.818 | 0.013 | Nd iii 4810.369 |
| 4821.110 | 287 | 19 | 6.128 | 0.010 | 1.000 | 290 | 16 | 0.414 | 0.009 | 155 | 16 | 0.794 | 0.017 | Nd iii 4821.112 |
| 4853.382 | 406 | 43 | 6.134 | 0.016 | 1.000 | 395 | 49 | 0.376 | 0.020 | 156 | 49 | 0.788 | 0.051 | |
| 4866.715 | 344 | 30 | 6.136 | 0.013 | 1.000 | 339 | 27 | 0.399 | 0.013 | 225 | 26 | 0.785 | 0.019 | |
| 4904.666 | 195 | 15 | 6.118 | 0.012 | 1.000 | 190 | 16 | 0.391 | 0.014 | 87 | 16 | 0.797 | 0.030 | |
| 4951.944 | 220 | 12 | 6.134 | 0.008 | 1.000 | 212 | 10 | 0.412 | 0.008 | 95 | 10 | 0.824 | 0.018 | Nd iii 4951.948 |
| 4956.202 | 181 | 13 | 6.143 | 0.011 | 1.000 | 176 | 11 | 0.388 | 0.011 | 107 | 11 | 0.781 | 0.018 | |
| 4972.842 | 153 | 12 | 6.105 | 0.012 | 1.000 | 159 | 15 | 0.349 | 0.015 | 43 | 14 | 0.695 | 0.054 | |
| 4976.801 | 282 | 20 | 6.094 | 0.011 | 1.000 | 305 | 23 | 0.370 | 0.012 | 100 | 23 | 0.680 | 0.037 | |
| 5012.933 | 324 | 16 | 6.127 | 0.008 | 1.000 | 324 | 10 | 0.430 | 0.005 | 154 | 10 | 0.817 | 0.011 | |
| 5064.040 | 282 | 18 | 6.118 | 0.010 | 1.000 | 284 | 15 | 0.416 | 0.009 | 145 | 15 | 0.799 | 0.017 | |
| 5078.332 | 212 | 22 | 6.109 | 0.015 | 1.000 | 223 | 23 | 0.437 | 0.017 | 110 | 23 | 0.791 | 0.035 | |
| 5083.846 | 291 | 21 | 6.105 | 0.011 | 1.000 | 301 | 21 | 0.410 | 0.011 | 133 | 21 | 0.772 | 0.026 | Nd iii 5083.860 |
| 5091.671 | 294 | 23 | 6.134 | 0.012 | 1.000 | 289 | 24 | 0.391 | 0.013 | 137 | 23 | 0.790 | 0.028 | |
| 5106.609 | 298 | 18 | 6.122 | 0.009 | 1.000 | 293 | 17 | 0.356 | 0.009 | 124 | 17 | 0.758 | 0.022 | |
| 5140.498 | 282 | 27 | 6.127 | 0.014 | 1.000 | 299 | 27 | 0.396 | 0.015 | 163 | 27 | 0.751 | 0.027 | |
| 5190.311 | 204 | 23 | 6.133 | 0.017 | 1.000 | 189 | 25 | 0.389 | 0.021 | 108 | 25 | 0.817 | 0.038 | |
| 5213.243 | 363 | 32 | 6.168 | 0.013 | 1.000 | 289 | 35 | 0.307 | 0.020 | 170 | 35 | 0.819 | 0.034 | |
| 5213.727 | 280 | 37 | 6.145 | 0.020 | 1.000 | 267 | 40 | 0.397 | 0.024 | 196 | 39 | 0.791 | 0.033 | |
| 5277.200 | 222 | 17 | 6.106 | 0.012 | 1.000 | 227 | 19 | 0.384 | 0.013 | 91 | 19 | 0.753 | 0.034 | |
| 5342.398 | 229 | 21 | 6.107 | 0.014 | 1.000 | 236 | 21 | 0.429 | 0.014 | 142 | 20 | 0.796 | 0.024 | |
| 5368.583 | 238 | 26 | 6.181 | 0.017 | 1.000 | 194 | 29 | 0.375 | 0.024 | 146 | 28 | 0.822 | 0.032 | Nd iii 5368.581 |
| 5373.005 | 398 | 35 | 6.108 | 0.013 | 1.000 | 404 | 34 | 0.447 | 0.014 | 226 | 34 | 0.821 | 0.024 | |
| 5397.851 | 309 | 23 | 6.116 | 0.011 | 1.000 | 313 | 22 | 0.402 | 0.011 | 154 | 21 | 0.781 | 0.023 | |
| 5432.638 | 202 | 14 | 6.143 | 0.011 | 1.000 | 186 | 15 | 0.400 | 0.013 | 90 | 14 | 0.838 | 0.026 | |
| 5441.654 | 281 | 25 | 6.154 | 0.014 | 1.000 | 275 | 22 | 0.428 | 0.013 | 202 | 21 | 0.809 | 0.018 | Nd iii 5441.630 |
| 5467.324 | 300 | 30 | 6.114 | 0.015 | 1.000 | 313 | 34 | 0.355 | 0.017 | 130 | 34 | 0.715 | 0.042 | |
| 5471.402 | 377 | 26 | 6.126 | 0.011 | 1.000 | 374 | 26 | 0.423 | 0.011 | 163 | 26 | 0.818 | 0.026 | |
| 5502.872 | 275 | 16 | 6.137 | 0.009 | 1.000 | 268 | 12 | 0.417 | 0.008 | 136 | 12 | 0.819 | 0.015 | |
| 5521.469 | 170 | 16 | 6.125 | 0.014 | 1.000 | 173 | 16 | 0.434 | 0.015 | 102 | 16 | 0.810 | 0.026 | |
| 5527.936 | 217 | 43 | 6.127 | 0.030 | 0.997 | 234 | 51 | 0.466 | 0.035 | 63 | 51 | 0.785 | 0.130 | |
| 5530.826 | 238 | 16 | 6.129 | 0.010 | 1.000 | 234 | 15 | 0.429 | 0.010 | 119 | 15 | 0.825 | 0.021 | Nd iii 5530.860 |
| 5533.381 | 281 | 32 | 6.108 | 0.017 | 1.000 | 275 | 37 | 0.282 | 0.021 | 104 | 37 | 0.690 | 0.057 | |
| 5536.510 | 341 | 27 | 6.130 | 0.012 | 1.000 | 339 | 28 | 0.370 | 0.013 | 165 | 28 | 0.762 | 0.028 | |
| 5555.726 | 194 | 46 | 6.231 | 0.037 | 0.955 | 89 | 55 | 0.317 | 0.098 | 147 | 54 | 0.845 | 0.060 | |
| 5556.114 | 395 | 44 | 6.105 | 0.016 | 1.000 | 403 | 48 | 0.464 | 0.019 | 205 | 48 | 0.835 | 0.038 | |
| 5604.916 | 253 | 34 | 6.145 | 0.025 | 1.000 | 220 | 40 | 0.316 | 0.029 | 68 | 40 | 0.879 | 0.094 | + Ca i 5604.939 |
| 5617.674 | 242 | 38 | 6.131 | 0.023 | 1.000 | 242 | 42 | 0.350 | 0.027 | 171 | 41 | 0.728 | 0.039 | |
| 5623.569 | 335 | 45 | 6.101 | 0.020 | 1.000 | 375 | 52 | 0.313 | 0.022 | 150 | 52 | 0.617 | 0.055 | |
| 5654.979 | 174 | 10 | 6.123 | 0.009 | 1.000 | 178 | 7 | 0.422 | 0.007 | 88 | 7 | 0.797 | 0.014 | Nd iii 5654.965 |
| 5673.185 | 302 | 37 | 6.117 | 0.018 | 1.000 | 312 | 41 | 0.420 | 0.021 | 160 | 41 | 0.788 | 0.042 | |
| 5680.682 | 339 | 39 | 6.136 | 0.017 | 1.000 | 367 | 39 | 0.406 | 0.017 | 234 | 39 | 0.751 | 0.027 | |
| 5705.229 | 263 | 20 | 6.133 | 0.011 | 1.000 | 254 | 18 | 0.409 | 0.011 | 146 | 17 | 0.811 | 0.020 | Nd iii 5705.238 |
| 5713.777 | 194 | 36 | 6.173 | 0.028 | 0.999 | 173 | 41 | 0.414 | 0.038 | 136 | 40 | 0.823 | 0.048 | |
| 5714.329 | 265 | 35 | 6.104 | 0.019 | 1.000 | 271 | 39 | 0.366 | 0.023 | 136 | 39 | 0.735 | 0.047 | Nd iii 5714.366 |
| 5796.994 | 287 | 28 | 6.121 | 0.015 | 1.000 | 291 | 30 | 0.412 | 0.017 | 142 | 30 | 0.790 | 0.034 | |
| 5852.421 | 253 | 14 | 6.142 | 0.009 | 1.000 | 238 | 12 | 0.398 | 0.008 | 121 | 12 | 0.820 | 0.017 | |
| 5920.707 | 306 | 25 | 6.140 | 0.012 | 1.000 | 287 | 26 | 0.401 | 0.014 | 141 | 25 | 0.828 | 0.030 | |
| 5926.403 | 253 | 25 | 6.103 | 0.015 | 1.000 | 272 | 27 | 0.408 | 0.016 | 128 | 27 | 0.747 | 0.034 | |
| 5960.612 | 277 | 23 | 6.131 | 0.013 | 1.000 | 275 | 25 | 0.381 | 0.015 | 114 | 24 | 0.778 | 0.035 | |
| 5993.170 | 266 | 46 | 6.135 | 0.026 | 0.999 | 270 | 52 | 0.392 | 0.031 | 174 | 51 | 0.767 | 0.048 | |
| 5998.263 | 257 | 31 | 6.137 | 0.018 | 1.000 | 237 | 35 | 0.397 | 0.024 | 120 | 35 | 0.834 | 0.047 | |
| 6012.286 | 340 | 21 | 6.116 | 0.009 | 1.000 | 351 | 18 | 0.397 | 0.008 | 163 | 17 | 0.763 | 0.018 | |
| 6014.550 | 327 | 20 | 6.123 | 0.009 | 1.000 | 333 | 15 | 0.431 | 0.007 | 174 | 15 | 0.806 | 0.014 | |
| 6023.314 | 174 | 40 | 6.137 | 0.034 | 0.974 | 156 | 47 | 0.287 | 0.049 | 51 | 47 | 0.796 | 0.149 | |
| 6038.492 | 278 | 26 | 6.103 | 0.014 | 1.000 | 299 | 29 | 0.384 | 0.016 | 104 | 29 | 0.708 | 0.045 | |
| 6044.651 | 264 | 24 | 6.110 | 0.014 | 1.000 | 269 | 26 | 0.374 | 0.016 | 115 | 26 | 0.747 | 0.037 | |
| 6093.852 | 295 | 21 | 6.116 | 0.011 | 1.000 | 301 | 22 | 0.401 | 0.012 | 131 | 21 | 0.776 | 0.027 | |
| 6105.792 | 272 | 28 | 6.117 | 0.016 | 1.000 | 276 | 29 | 0.392 | 0.017 | 163 | 29 | 0.767 | 0.029 | |
| 6148.852 | 220 | 17 | 6.139 | 0.012 | 1.000 | 214 | 16 | 0.430 | 0.012 | 112 | 16 | 0.830 | 0.024 | |
| 6172.552 | 217 | 25 | 6.133 | 0.018 | 1.000 | 219 | 29 | 0.320 | 0.021 | 103 | 28 | 0.702 | 0.045 | |
| 6193.598 | 190 | 38 | 6.197 | 0.031 | 0.995 | 140 | 45 | 0.361 | 0.051 | 116 | 45 | 0.837 | 0.063 | |
| 6201.765 | 260 | 43 | 6.097 | 0.024 | 0.999 | 293 | 51 | 0.286 | 0.028 | 103 | 51 | 0.568 | 0.078 | |
| 6206.097 | 214 | 39 | 6.031 | 0.026 | 0.999 | 240 | 45 | 0.394 | 0.030 | 169 | 45 | 0.679 | 0.042 | |
| 6251.136 | 321 | 28 | 6.140 | 0.013 | 1.000 | 300 | 31 | 0.373 | 0.017 | 138 | 31 | 0.806 | 0.037 | |
| 6254.676 | 231 | 19 | 6.134 | 0.012 | 1.000 | 215 | 21 | 0.364 | 0.016 | 89 | 20 | 0.810 | 0.038 | |
| 6273.707 | 271 | 23 | 6.121 | 0.013 | 1.000 | 280 | 22 | 0.422 | 0.013 | 156 | 22 | 0.790 | 0.023 | Nd iii 6273.673 |
| 6286.059 | 172 | 48 | 6.025 | 0.040 | 0.718 | 194 | 57 | 0.291 | 0.047 | 138 | 58 | 0.567 | 0.065 | |
| 6328.438 | 152 | 25 | 6.131 | 0.025 | 0.999 | 151 | 30 | 0.352 | 0.032 | 69 | 29 | 0.745 | 0.069 | |
| 6351.919 | 154 | 17 | 6.070 | 0.017 | 0.743 | 163 | 51 | 0.299 | 0.050 | 87 | 52 | 0.632 | 0.093 | |
| 6417.128 | 242 | 14 | 6.118 | 0.009 | 1.000 | 239 | 11 | 0.416 | 0.008 | 114 | 11 | 0.810 | 0.016 | |
| 6434.946 | 221 | 41 | 6.104 | 0.028 | 0.998 | 237 | 49 | 0.293 | 0.033 | 80 | 49 | 0.621 | 0.097 | |
| 6524.464 | 353 | 27 | 6.127 | 0.012 | 1.000 | 348 | 26 | 0.412 | 0.012 | 175 | 26 | 0.809 | 0.024 | |
| 6579.551 | 273 | 47 | 6.121 | 0.026 | 0.999 | 273 | 54 | 0.383 | 0.032 | 143 | 53 | 0.770 | 0.061 | |
| 6667.494 | 226 | 62 | 6.097 | 0.040 | 0.714 | 286 | 73 | 0.344 | 0.040 | 166 | 73 | 0.612 | 0.069 | |
| WL | 2001 | 2003 | 2004 | 2004 | |||||||||||||
|---|---|---|---|---|---|---|---|---|---|---|---|---|---|---|---|---|---|
| Å | phase=0.872 | phase=0.083 | phase=0.867 | phase=0.944 | |||||||||||||
| 5284.690 | 319 | 37 | 0.678 | 0.017 | 338 | 11 | 0.685 | 0.006 | 259 | 11 | 0.642 | 0.007 | Pr iii | ||||
| 5299.986 | 291 | 31 | 0.702 | 0.016 | 327 | 12 | 0.678 | 0.006 | 246 | 10 | 0.641 | 0.007 | Pr iii | ||||
| 5844.406 | 301 | 38 | 0.571 | 0.020 | 305 | 14 | 0.603 | 0.008 | 299 | 15 | 0.576 | 0.008 | Pr iii | ||||
| 5998.935 | 254 | 30 | 0.571 | 0.019 | 382 | 18 | 0.606 | 0.008 | 329 | 15 | 0.587 | 0.008 | Pr iii | ||||
| 6160.238 | 195 | 19 | 0.610 | 0.016 | 342 | 12 | 0.657 | 0.006 | 251 | 10 | 0.624 | 0.006 | Pr iii | ||||
| 6692.225 | 315 | 41 | 0.519 | 0.021 | 245 | 61 | 0.547 | 0.040 | 317 | 27 | 0.501 | 0.014 | Pr iii | ||||
| 6706.708 | 307 | 17 | 0.594 | 0.009 | 294 | 65 | 0.497 | 0.037 | 371 | 27 | 0.601 | 0.012 | 359 | 15 | 0.569 | 0.007 | Pr iii |
| 4959.120 | 224 | 30 | 0.381 | 0.023 | 345 | 14 | 0.397 | 0.007 | 254 | 9 | 0.383 | 0.006 | Nd ii | ||||
| 5182.597 | 197 | 34 | 0.331 | 0.028 | 303 | 16 | 0.346 | 0.009 | 251 | 11 | 0.336 | 0.007 | Nd ii | ||||
| 5319.81 | 234 | 36 | 0.394 | 0.027 | 262 | 9 | 0.398 | 0.005 | Nd ii | ||||||||
| 6637.942 | 264 | 16 | 0.348 | 0.010 | 346 | 26 | 0.357 | 0.012 | 244 | 13 | 0.346 | 0.009 | Nd ii | ||||
| 6650.499 | 286 | 21 | 0.348 | 0.012 | 355 | 28 | 0.366 | 0.012 | 241 | 12 | 0.358 | 0.008 | Nd ii | ||||
| 6680.125 | 199 | 90 | 0.251 | 0.069 | 242 | 46 | 0.300 | 0.031 | 157 | 19 | 0.327 | 0.019 | Nd ii | ||||
| 5286.724 | 250 | 31 | 0.353 | 0.021 | 312 | 13 | 0.399 | 0.007 | 267 | 9 | 0.381 | 0.006 | Nd iii | ||||
| 5294.109 | 180 | 23 | 0.520 | 0.022 | 253 | 8 | 0.558 | 0.005 | 188 | 8 | 0.540 | 0.007 | Nd iii | ||||
| 5566.012 | 182 | 23 | 0.430 | 0.022 | 273 | 12 | 0.444 | 0.007 | 198 | 7 | 0.400 | 0.006 | Nd iii | ||||
| 5677.174 | 229 | 34 | 0.458 | 0.025 | 329 | 20 | 0.483 | 0.010 | 236 | 9 | 0.431 | 0.006 | Nd iii | ||||
| 5845.017 | 239 | 27 | 0.464 | 0.019 | 276 | 9 | 0.493 | 0.005 | 227 | 8 | 0.466 | 0.006 | Nd iii | ||||
| 5851.529 | 292 | 34 | 0.447 | 0.020 | 278 | 8 | 0.458 | 0.005 | 261 | 9 | 0.431 | 0.006 | Nd iii | ||||
| 5987.677 | 264 | 26 | 0.480 | 0.017 | 306 | 13 | 0.500 | 0.007 | 245 | 8 | 0.464 | 0.006 | Nd iii | ||||
| 6145.062 | 232 | 28 | 0.472 | 0.021 | 263 | 9 | 0.506 | 0.006 | 194 | 9 | 0.482 | 0.008 | Nd iii | ||||
| 6690.821 | 311 | 14 | 0.415 | 0.007 | 221 | 51 | 0.412 | 0.039 | 307 | 26 | 0.412 | 0.014 | 235 | 11 | 0.399 | 0.008 | Nd iii |
| 6173.050 | 213 | 58 | 0.331 | 0.041 | 141 | 25 | 0.261 | 0.028 | 79 | 10 | 0.248 | 0.021 | Eu ii | ||||
| 6645.102 | 142 | 8 | 0.232 | 0.010 | 149 | 13 | 0.256 | 0.015 | 110 | 8 | 0.252 | 0.012 | Eu ii | ||||
| 5847.213 | 394 | 63 | 0.914 | 0.027 | 405 | 29 | 0.929 | 0.012 | 359 | 23 | 0.869 | 0.010 | Tb iii | ||||
| 6511.043 | 223 | 76 | 0.846 | 0.056 | 246 | 39 | 0.881 | 0.025 | 329 | 23 | 0.824 | 0.011 | Tb iii | ||||
| 6687.701 | 296 | 34 | 0.869 | 0.018 | 324 | 70 | 0.902 | 0.035 | 197 | 23 | 0.846 | 0.018 | Tb iii | ||||