Detecting cold gas at intermediate redshifts: GMRT survey using Mg II systems.
Abstract
Intervening H i 21-cm absorption systems at are very rare and only 4 confirmed detections have been reported in the literature. Despite their scarcity, they provide interesting and unique insights into the physical conditions in the interstellar medium of high- galaxies. Moreover, they can provide independent constraints on the variation of fundamental constants. We report 3 new detections based on our ongoing Giant Metrewave Radio Telescope (GMRT) survey for 21-cm absorbers at from candidate damped Lyman- systems. The 21-cm lines are narrow for the = 1.3710 system towards SDSS J01080037 and = 1.1726 system toward SDSS J23581020. Based on line full-width at half maximum, the kinetic temperatures are K and K, respectively. The 21-cm absorption profile of the third system, =1.1908 system towards SDSS J0804+3012, is shallow, broad and complex, extending up to 100 km s-1. The centroids of the 21-cm lines are found to be shifted with respect to the corresponding centroids of the metal lines derived from SDSS spectra. This may mean that the 21-cm absorption is not associated with the strongest metal line component.
1 Introduction
The diffuse interstellar medium exhibits a wide range of physical conditions such as temperature, density and radiation field that are influenced by in-situ star-formation, cosmic ray energy density, photoelectric heating by dust as well as mechanical energy input from both impulsive disturbances such as supernova explosions and steady injection of energy in the form of stellar winds. Therefore, understanding the physical conditions in the gas and the processes that maintain these is important for understanding galaxies and their evolution. The damped Lyman- systems (DLAs), with log (H i)20.3, are a major reservoir of H i at high and possibly the progenitors of present-day galaxies (see Wolfe et al. 2005). At high , despite many attempts, only a handful of DLA galaxies have been detected based on line and/or continuum emission (see Møller et al. 2004).
Our understanding of physical conditions in DLAs at is based primarily on the absorption lines of H2 molecules and atomic fine-structure lines. A systematic search for H2 in DLAs at () has resulted in a detection in 15% of the cases (see Ledoux et al. 2003). Usually, the DLAs with H2 absorption also show absorption lines of C i, C i∗, C i∗∗ and C ii∗. Detailed investigations show that H2 components have properties similar to that of the cold neutral medium (CNM) in a radiation field of moderate intensity originating from local star formation activity (Srianand et al. 2005). Using C ii∗ absorption lines Wolfe et al. (2004) have concluded that most of the DLAs at high consist of CNM gas. However, above techniques cannot be used to probe nature of the gas at low and intermediate redshifts. In this case detecting 21-cm absorption line is one complementary way to probe the nature of absorbing gas. There have been several systematic searches for 21-cm absorption in DLAs undertaken by various groups (Briggs & Wolfe 1983; Lane 2000; Kanekar & Chengalur 2003, Curran et al. 2005) with limited success. To date, in the literature 38 DLAs have been searched for 21-cm absorption, resulting in 17 detections most of which occur (see Fig. 1). The column density of H i for an optically thin cloud that covers a fraction of the background source is related to the optical depth in a velocity interval and d and to the spin temperature () by
| (1) |
The low detection rate at high can therefore be attributed either to the gas being warm (high ) or to a low value of the covering factor () through high geometry effects (see Kanekar & Chengalur, 2003 and Curran & Webb, 2006, respectively). However, the redshift coverage is sparse and measurements are available only for a few systems at (Fig. 1). To improve the statistics we have started a systematic survey of 21-cm absorption at 1.101.45 using the 610-MHz receiver at GMRT. Here, we report the results from the first phase of this survey that has resulted in 3 new detections.
Obtaining a new DLA sample at is virtually impossible in the absence of UV-spectrographs in space as the redshifted wavelength of Lyman- line falls below the atmospheric cutoff. However, Rao & Turnshek (2000) have shown that the DLAs can be preselected on the basis of equivalent widths of Mg ii, Fe ii and Mg i absorption lines. Specifically, they found that 50% of the absorbers with rest frame W(Fe ii2600) and W(Mg ii2796) greater than 0.5 Å were confirmed DLAs. The detection rate becomes 100% when W(Mg i) 0.5 Å. It is also clear from Fig. 3.4 of Lane (2000) that such a selection will also ensure that 50% of these candidates are detected in 21-cm absorption. Motivated by this, we have begun a GMRT 21-cm survey of DLA candidates selected on the basis of W(Mg ii) in the redshift range 1.10. Our complete sample is drawn from the catalog of 7421 Mg ii systems with W(Mg ii)Å and 0.31.9, detected along the line of sight toward 45,023 QSOs in SDSS DR3 (Prochter, Prochaska & Burles, 2006). There are 2857 systems at 1.10. Out of these, we have selected all the 26 systems that have an estimated 610 MHz flux density in excess of 100 mJy from NVSS and First catalog. These form our main sample. In addition to this we have also observed three other sources [J01080037 (York et al. 2006), J02402309 and J16040019 (Lanzetta, Wolfe & Turnshek, 1987)] that have total flux density at 610 MHz in excess of 1 Jy and have strong Mg ii systems.
2 Observations and Results
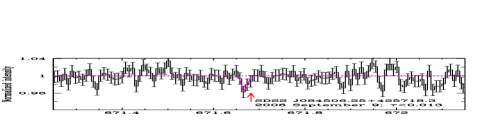
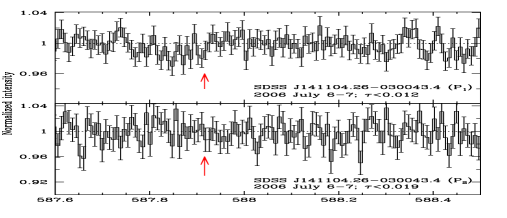
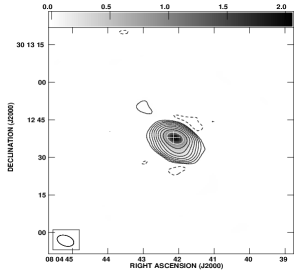
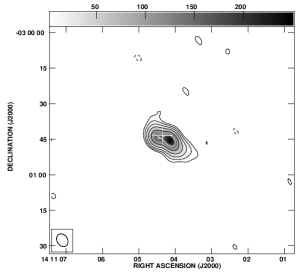
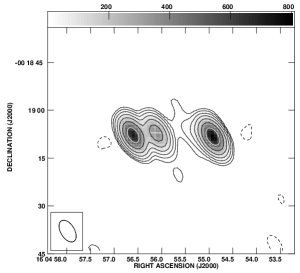
In the first phase of our GMRT survey we have observed 10 systems (Table 1) from our sample. Usually, a 1 MHz bandwidth split into 128 frequency channels was used to acquire data in the two circular polarization channels RR and LL. Broader (2 MHz for J0804+3012) or narrower (0.5 MHz for J23581020) bandwidths were used in the subsequent observing runs that were carried out for confirming the detected absorption. The data were reduced using the Astronomical Image Processing System (NRAO AIPS package) following standard procedures as described in Gupta et al. (2006). Final spectra for the three new detections and six non-detections are presented in Figs. 2 and 3 respectively. Analysis of = 1.3647 towards J02402309 is presented in Srianand, Gupta & Petitjean (2006). In most of the cases the background quasar is unresolved for the typical 55′′ synthesized beam achieved in our observations. However, for J08043012, J14110300 and J16040019 the radio sources are extended (see Fig. 4). For J0804+3012, 21-cm absorption is detected in the spectrum extracted towards the radio peak (Fig. 2). Higher spatial resolution as well as S/N observations will be required to investigate its variation across the source. In the case of J14110300, the radio peak is not consistent with the location of the optical source. 21-cm absorption is not detected towards either the strongest radio peak (P1) or another peak (P2) northeast to P1 (Figs. 3 and 4). No 21-cm absorption is detected towards any of the three prominent radio peaks seen in J16040019. Fig. 3 shows the spectrum towards the central component. A narrow absorption is present with 0.040.01 and FWHM=6.12.3 km s-1 near the expected frequency towards J08454257 (see Fig. 3). The feature is present in both the polarizations and in the spectra extracted using different baselines and time ranges. At this stage we consider this as a tentative detection.
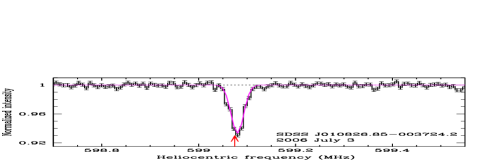
2.1 =1.3710 system towards J01080037
The 21-cm absorption profile is well fitted with a single Gaussian having = 0.0680.002 and FWHM = 15.40.6 km s-1. From the observed optical depth we get the integrated column density, (H i) = 2.11018() cm-2. High frequency VLBA observations suggest structures extending over 60 mas ( pc; Ho=71 km s-1 Mpc-1, =0.27, =0.73) with significant flux density in extended emission (Beasley et al. 2002). Thus is uncertain. Assuming thermal broadening, gives a gas kinetic temperature 5200 K. This is an upper limit as various other effects also could contribute to the line width. Now we can assume as is the case for thermodynamic equilibrium. If the gas is a typical CNM (say K) then log [(H i)] = 20.30. Thus, (H i) in the 21-cm component is consistent with it being a DLA. The 21-cm centroid is within 4 km s-1 to that expected from the metal lines detected in the SDSS spectrum. The Zn ii+Cr ii blend at = 2062 Å, the Si ii1808 and the Mn ii lines are clearly detected even in the low-dispersion SDSS spectrum.
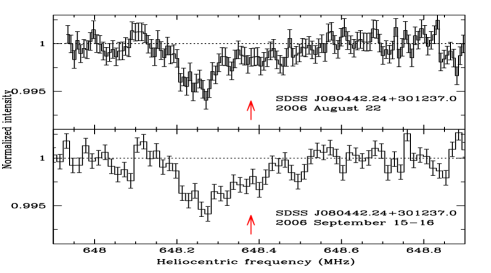
2.2 =1.1908 system towards J0804+3012
21-cm absorption is clearly detected towards J0804+3012 which is partially resolved in our observations (Fig. 4). The absorption profile is consistent with a main component (with FWHM km s-1and ) and a broad wing (extending up to km s-1) towards higher frequency. Our two-epoch observations with different spectral resolution confirm the main component which also shows the expected Doppler shift. However, deeper observations are required to ascertain the strength of the wing.It is interesting to note that the expected position of 21-cm absorption based on the SDSS spectrum coincides with the wing of the 21-cm absorption and not the stronger main component. Based on the profile obtained on 1516 September 2006, we get an integrated column density of (H i)=6.51017 (/) cm-2. Unlike the other two 21-cm absorbers, we do not detect Si ii1808 (with W0.3Å) and Zn ii2026 lines (with W0.2Å) in the SDSS spectrum.
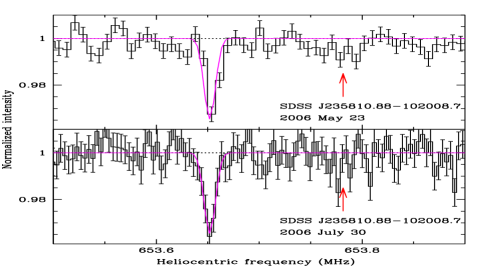
2.3 =1.1726 system towards J23581020
Relatively weak 21-cm absorption is clearly detected and the profile can be well fitted with a single Gaussian component with = 0.0350.004 and FWHM = 6.00.8 km s-1(Fig 2). This implies 800 K and log [ (H i)] 20.5 in the 21-cm absorbing component. If the absorbing gas happens to be a CNM then log [ (H i)] = 19.6. The value of could be close to unity as VLBA observations at 5 GHz by Fomalont et al. (2000) show the source to be mas, which corresponds to a projected size of pc at =1.1726. Thus the inferred range in (H i) is consistent with the 21-cm absorbing gas being a sub-DLA. Like the previous system, the 21-cm absorption is shifted by 70 km s-1 with respect to the optical redshift based on the SDSS data. The Zn ii+Cr ii blend at = 2062 Å is clearly detected in the SDSS spectrum. The compactness of the background radio source and the simplicity of the 21-cm absorption profile make this system an ideal case for probing the variation of fundamental constants.
3 Discussion
In this letter we have reported the detection of 21-cm absorption in three systems. This has substantially increased the number of 21-cm absorption systems at , as prior to this only four systems were known. In two of our systems (= 1.1908 towards J08043012 and = 1.1726 towards J23581020) the centroid of the strongest 21-cm absorption component is shifted with respect to the centroid of metal lines derived from SDSS spectra. This may mean that the strongest 21-cm absorption component is not associated with the strongest metal absorption component. Such shifts have already been observed in other systems (see Srianand et al. 2005; Kanekar et al. 2006; Heinmüller et al. 2006). It is also known that H2 carrying components in DLAs, that are believed to trace the CNM gas, often show similar shifts (although less pronounced) with respect to the strong metal line components (Ledoux et al. 2003. H2 components often distinguish themselves with respect to the rest of the velocity components by the presence of excited fine-structure lines of C i and C ii and in some cases by large depletion factors (e.g. Rodríguez et al. 2006). It would be very important to obtain high resolution optical spectra of our sources to see if this is also true in the case of the 21-cm absorption systems.
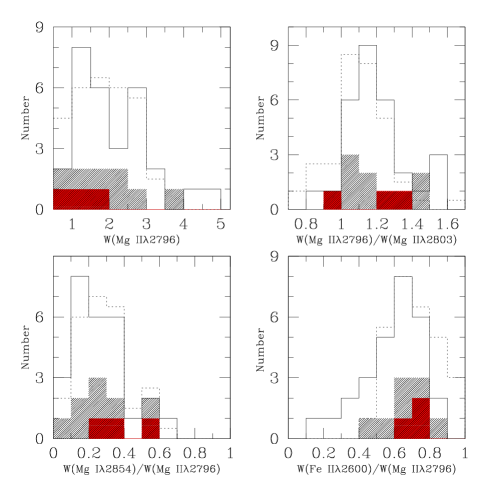
We also report upper limits on 7 systems with one of them being a tentative detection. We find a detection rate of 21-cm absorption of roughly 30% in our survey so far. This is much higher than that achieved earlier (see for example Lane, 2000), mainly because we have restricted ourselves to the stronger Mg ii systems. Since the objects observed during the first-phase of the survey are drawn randomly from the parent sample, most probably the detection rate of our whole survey will be close to what we have achieved so far. In Fig. 5 we compare the properties of our systems with those of DLAs in the sample of Rao & Turnshek (2000). The distribution of different equivalent width ratios together with the distribution of W(Mg ii) in our sample is consistent with what is observed in the DLA population.
It is important to obtain independent constraints on the time variation of fundamental constants in order to resolve the controversy regarding the variation of (Murphy et al. 2003; Srianand et al. 2004). As the energy of the 21-cm transition depends on the electron-to-proton mass ratio (), the fine-structure constant () and the proton G-factor (Gp), high resolution optical spectra in conjunction with high resolution 21-cm spectra can be used to probe the variation of these constants (Tzanavaris et al. 2005). However, it is important first to understand the origin of the relative shifts that we observe between the redshifts of the atomic heavy element lines and the 21-cm absorption. This needs detailed modeling of the absorption systems taking into account all transitions simultaneously. This is what we plan to do in the near future.
References
- (1) Beasley, A. J., Gordon, D., Peck, A. B., Petrov, L., MacMillan, D. S., Fomalont, E. B., & Ma, C., 2002, ApJS, 141, 13
- (2) Briggs, F. H., & Wolfe, A.M., 1983, ApJ, 268, 76
- (3) Curran, S.J., Murphy, M. T., Pihlström, V. M., Webb, J. K, & Purcell, C. R. 2005, MNRAS, 356, 1509
- (4) Curran, S. J., & Webb, J. 2006, MNRAS, 371, 356.
- (5) Fomalont, E. B., Frey, S., Paragi, Z., Gurvits, L. I., Scott, W. K., Taylor, A. R., Edward, P. G., & Hirabayashi, H, 2000, ApJS, 131, 95
- (6) Gupta, N., Salter, C.J., Saikia, D.J., Ghosh, T., & Jeyakumar, S., 2006, MNRAS, in press (astro-ph/0605423)
- (7) Heinmüller, J., Petitjean, P., Ledoux, C., Caucci, S., & Srianand, R., 2006, A&A, 449, 33
- (8) Kanekar, N., & Chengalur, J.N., 2003, A&A, 399, 857
- (9) Kanekar, N., Subrahmanyan, R., Ellison, S.L., Lane, W.M., & Chengalur, J.N., 2006, MNRAS, 370, L46
- (10) Lane W., 2000, PhD Thesis, University of Groningen
- (11) Lanzetta, K. M., Wolfe, A. M., & Turnshek, D. A, 1987, ApJ, 322, 739
- (12) Ledoux, C., Petitjean, P., & Srianand, R., 2003, MNRAS, 346, 209
- (13) Möller, P., Fynbo, J. P. U., & Fall, S. M., 2004, A&A, 422, 33
- (14) Murphy, M. T., Webb, J. K.,& Flambaum, V. V., 2003, MNRAS, 345, 609
- (15) Prochter, G. E., Prochaska, J. X., Burles, S. M., 2006, ApJ, 639, 766
- (16) Rao, S.M., Turnshek, D.A., 2000, ApJS, 130, 1
- (17) Rodríguez, E., Petitjean, P., Aracil, B., Ledoux, C., & Srianand, R. 2006, A&A, 446, 791
- (18) Srianand, R., Chand, H., Petitjean, P., & Aracil, B, 2004, PRL, 92, 121302
- (19) Srianand, R., Gupta, N., & Petitjean, P., 2006, MNRAS, in press (astro-ph/0611327)
- (20) Srianand, R., Petitjean, P., Ledoux, C., Ferland, G., & Shaw, G., 2005, MNRAS, 362, 549
- (21) Tzanavaris, P., Webb, J. K., Murphy, M. T., Flambaum, V. V., & Curran, S. J., 2005, PRL, 95, 1301
- (22) Wolfe, A.M., Howk, J.C., Gawiser, E., Prochaska, J.X., & Lopez, S., 2004, ApJ, 615, 625
- (23) Wolfe, A.M., Gawiser, E., Prochaska, J.X., 2005, ARA&A, 43, 861
- (24) York, D. G., et al. 2006, MNRAS, 367, 945.
| Name | Time | Peak | rmsb | ||
| (hr) | fluxa | ||||
| J01080037 | 1.3710 | 4.4 | 1276 | 2.9 | 0.070 |
| J02141405 | 1.4463 | 4.4 | 220 | 2.7 | 0.012 |
| J02402309 | 1.3647 | 8.0 | 5100 | 5.2 | 0.001 |
| J07483006 | 1.4470 | 5.5 | 347 | 3.5 | 0.010 |
| J08043012 | 1.1908 | 6.0 | 2050 | 1.9 | 0.006 |
| 6.2d | 2087 | 1.6 | 0.006 | ||
| J08454257 | 1.1147 | 5.0 | 224 | 3.0 | 0.013 |
| J10175356 | 1.3055 | 4.4 | 127 | 2.3 | 0.018 |
| J14110300e | 1.4160 | 3.9 | 244 | 3.0 | 0.012 |
| 161 | 3.0 | 0.019 | |||
| J16040019 | 1.3245 | 3.3d,f | 375 | 3.9 | 0.010 |
| J23581020 | 1.1726 | 3.9d,f | 443 | 1.4 | 0.033 |
| 5.5g | 420 | 2.5 | 0.035 | ||
| a peak flux (mJy/beam); b spectral rms (mJy/beam/channel) | |||||
| c peak optical depth or 1- limit per channel; | |||||
| d 2 MHz band width. | |||||
| e The two spectra correspond to peaks P1 and P2. | |||||
| f 256 channels used; g 0.5 MHz bandwidth | |||||