Discovery of thirteen novae candidates in M8711affiliation: Based on observations made with the NASA/ESA Hubble Space Telescope, obtained at the Space Telescope Science Institute, which is operated by the Association of Universities for Research in Astronomy, Inc., under NASA contract NAS 5-26555. These observations are associated with program 9474.
Abstract
We have made thirteen positive identifications of near-ultraviolet (NUV) transient sources in the giant elliptical galaxy M87 using the Space Telescope Imaging Spectrograph (STIS) on board the Hubble Space Telescope (HST). We give a representative sample of the light curves that we derive for these transients, and based on their characteristics we identify them as classical novae candidates. We obtain a hard lower limit for the nova rate in M87 of 64 novae per year. Our results suggest an enhancement on the frequency of nova events towards the nucleus of the galaxy. No correlation is found with either jet activity or the position of present day globular clusters.
1 Introduction
The giant elliptical galaxy M87, located in the core of the Virgo cluster, is well known for featuring one of the most spectacular and best studied extragalactic jets. M87’s close proximity, 16.1 Mpc (Tonry et al. 2001), has enabled HST observations at very high spatial resolution of the prominent jet, the nucleus, and the host galaxy. M87 has thus played a central role in the modern understanding of jets and radio loud active galaxies (see e.g. Junor, Biretta, & Livio 1999, and references therein).
During the M87 jet monitoring program with the HST Faint Object Camera, Sparks et al. (2000), serendepitously discovered at least eleven transient sources in the host galaxy. Based on the temporal variability and their apparent luminosities, Livio, Riess, & Sparks (2002), postulated that these transients were classical novae. Even though Edwin Hubble reported two probable novae in this particular galaxy (Bowen, 1952, Pritchet & van den Bergh, 1987), until the era of large ground based telescopes and HST, few novae have been observed as far as Virgo (Ferrarese, et al. 1996, 2003).
Previous studies with HST have found novae candidates near the center of M87. Shara et al. (2004) claimed the discovery of an erupting classical nova in a globular cluster of M87 based on observations with HST’s Wide Field Planetary Camera 2. Using STIS, Sohn et al. (2006), published a catalogue of NUV-only sources, where eleven of them are detected in only one epoch and are likely to be novae.
Here we report thirteen NUV transient sources present in observations made with STIS in 2003 and not found in the epochs analysed by Sohn et al. (2006). The transients described here are also different from those discovered by Sparks et al. (2000). We show that these are most likely classical novae close to the nucleus of M87.
2 Observations
The STIS observations of M87 that we report were taken under HST GO program 9474 (PI: Sparks). These observations were acquired within 51 days and were strategically divided into three epochs to maximize the likelihood of finding new novae candidates and to obtain information on their light curves. The first observation epoch starts on 2003 June 7, the second epoch on 2003 July 12, and the third epoch on 2003 July 24. Each epoch comprises four visits obtained one day apart. Each visit is divided into four exposures. This amounts to a total of 512 minutes of STIS observations divided into 48 images of 640 seconds each.
All observations were taken with the NUV-MAMA detector of STIS; a detailed description of the instrument can be found in Kimble et al. (1998), and Kim Quijano et. al. (2003). The MAMA detector yields images free of cosmic rays, a critical asset when searching for transient sources with rapid variability. We use the ACCUM operating mode to obtain a time-integrated image. The filter in use is the F25QTZ with a pivot wavelength of 2364.8 Å. The detector has a field of view of and a plate scale of per pixel. At the distance of M87, corresponds to 77 pc.
This project was aimed in part at finding transient sources along the jet. The detector covers the jet entirely but provides only partial coverage for the galaxy. Jets were suspected of potentially enhancing the rate of classical novae in their vicinity through a jet-induced accretion process (Livio, Riess, & Sparks, 2002).
3 Data Reduction
We obtain the flatfielded science files from the Multimission Archive at Space Telescope (MAST). These files are calibrated using the code version 2.17b of the STScI CALSTIS. This version of the pipeline applies the geometrical distortion correction for STIS. We use the one-step pyraf task Multidrizzle of the Space Telescope Science Data Analysis System (STSDAS) to combine and rotate the images. The output data has units of counts per second (Koekemoer et al. 2002).
Before generating a catalogue of NUV point sources using SExtractor (Bertin & Arnouts, 1996) we execute the following two steps to avoid spurious detections. The first step is to obtain a galaxy subtracted residual of each image. For this purpose we fit elliptical isophotes to the STIS images using the STSDAS task ellipse (Jedrzejewski, 1987). We construct a model of M87 with the task bmodel and we subtract the model of the galaxy from each exposure. The second step consists of masking the borders of the detector and the jet.
When we run SExtractor, the parameters best suited to create our catalogue of NUV point sources are: six pixels above threshold to trigger detection and a detection threshold of 2.2 . We also perform photometry using SExtractor with an aperture diameter of ten pixels, i.e. .
The magnitudes discussed throughout this paper are determined in the Space Telescope system derived with the expression:
The photflam keyword is found on the header of the STIS images and it is equal to
| photflam=5.8455952 10-18 erg s-1 cm-2 Å-1 [counts s-1]-1. |
Details are given in the HST Data Handbook for STIS (Brown et al. 2002).
We adopt the values of extinction used by Sohn et al. (2006), namely, mag, and an aperture correction of -0.230 mag (Proffitt et al. 2003).
4 Results
With the parameters we set for SExtractor we obtain a total of thirteen transient sources that are unequivocal identifications. A number of dubious detections were eliminated by individual inspection of the images. With SExtractor we generate a catalogue of NUV point sources for each exposure allowing us to derive the light curves. We also perform photometry with SExtractor. These point sources span a range of 5.3 magnitudes in the STMAG system from to , our detection limit. Within this catalogue we find point sources with roughly three distinct types of light curves, only one example of each category is published given the size constraints of this letter. Table 1 gives the position of the transients and maximum magnitude they reach.
The first category consists of sources detected in all epochs with constant brightness. This category recovers the sources of constant brightness detected by Sohn et al. (2006) which are thought to be background galaxies. In Figure 1 we plot the constant “light curve” of one of these point sources: NUV-04. This light curve is in good agreement with the brightness published by Sohn et al. (2006), i.e. . The sources of variable brightness are of more interest for the present study and are described below.
The second category is composed of the sources with overall declining flux. These sources are present in all, or most, frames and grow fainter with time. Figure 2 shows the light curve for such a point source. This source declines slowly at a rate of about half a magnitude in 50 days.
A third category consists of sources that flare during the length of our observations. The light curve of such a source is shown in Figure 3. This source is particularly intriguing because of its rapid variability. As this source flared it was measured in four different frames at a magnitude of 23.8. Within two days the source fell below our detection limit and three days after flaring it has a magnitude of 25.1. This peculiar source was observed towards the end of our survey and consequently it only had a few days of coverage.
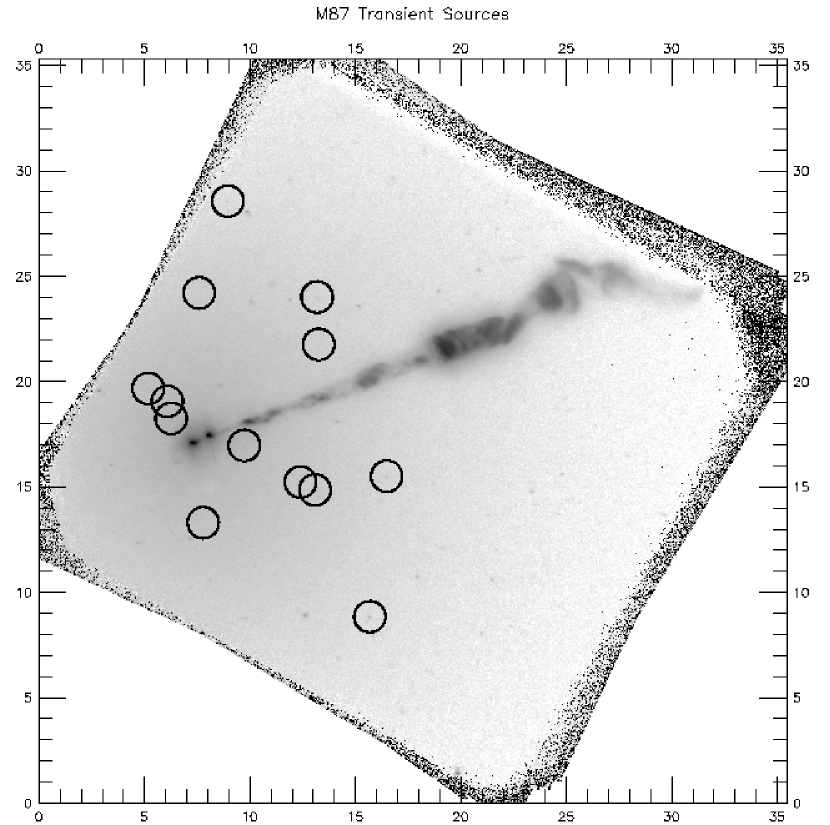
In Figure 4 we plot the positions of the thirteen positive identifications of transient sources. None of these sources appear in other epochs, such as the ones studied by Sohn et al. (2006). These sources also have light curves with variable brightness, as shown in Figures 2 & 3.
5 Discussion
5.1 Are these transients novae?
Are the variables we detect classical novae indeed? Previous studies discuss the possible different origins of variable sources in elliptical galaxies of the Virgo cluster (Livio, Riess & Sparks, 2002, Shara et al. 2004 for M87; Ferrarese et al. 2003 for M49). All of these studies agree that the variable sources they find are classical novae. They rule out other possible origins such as GRBs, or background supernovae given the rarity of these events and the small portion of the sky covered by HST detectors.
The thirteen transients we discovered clearly belong to M87 given their spatial distribution which overlaps the central starlight of the galaxy leaving the western section of the field of view free of detections (see Figure 4).
The light curves of these transients show a slow rate of decline in the NUV consistent with extensive multiwavelength observations of other novae (e.g. Nova Cygni 1978; Stickland et al. 1981). Generally in the optical the light curve of a nova declines rapidly and monotonically, in the infrared it has large variations, while in the UV after a small initial oscillation the measured flux increases and declines smoothly (see e.g. Warner (1995) for a discussion).
We identified these transient sources as novae based on their variable brightness, their rate of decline, and the eruptive characteristics of their light curves.
5.2 Nova rate and spatial distribution
Ciardullo et al. (1990) and Shafter, Ciardullo, & Prichet (2000) define the nova rate for a region of a galaxy using the mean nova lifetime approach with the following relation:
where
In this relation is the number of observed novae brighter than the critical magnitude . is the time sampled by an individual frame taken at time . is a function of the time when the preceeding frame was taken and of , the length of time a nova remains brighter than .
Given the small number of light curves we were able to obtain, we define an empirical, not a modeled, mean nova lifetime for our survey based on the length of time the thirteen detected novae were above our detection threshold. We find on average = 28.07 days, and days. The observed nova rate of this survey is therefore
This is the equivalent of 64 novae per year.
This observed nova rate is really a lower limit since it needs to be corrected for the fraction of novae present in the section of the galaxy not surveyed, novae lost because of extinction, and novae with brightness below our detection limit. Table 2 summarizes the different nova rates for M87 found in the literature, and ranging from 70 to 300 events per year.
The field of view of STIS covers of the total K-band luminosity of M87. Using the K-band luminosity as a scale to obtain the global novae rate of the galaxy we would find the very large value of 1067 events per year.
This result suggests that the frequency of nova events near the nucleus of M87 is considerably higher than in the rest of the galaxy. Crowding in the inner regions of M87 (Pritchet & van den Bergh, 1987) causes major incompleteness in the detection of novae within 25″of the nucleus with ground-based data (Shafter et al. 2000) and within 5″of the nucleus with HST/WFPC2 data (Shara & Zurek, 2002). Near-ultraviolet imaging with HST, allows detection of novae within 1.5″of the nucleus of M87.
Moreover, 11 out of 13 of our detections are located within a radius of of the nucleus. It is at from the nucleus that the light distribution changes from a shallow power-law inside to a steep power-law outside (Lauer et al. 1992). In Table 1 we give the positions of the transients as the offset and radial distance from the center of M87. In Figure 5 we show the cumulative distribution of novae events and the cumulative distribution of V-band (F555W) light versus radius. As noted by Ferrarese et al. (2003) for M49, the novae are more concentrated towards the center than the galaxy light.
Our findings indicate that the novae rates of the inner and outer parts of the galaxy may be different and one should use care when scaling to a global novae rate using the K-band luminosity (see Williams & Shafter (2004) for a discussion). An enhanced novae rate towards the nucleus may be due to massive white dwarfs being over-represented towards the center of the galaxy as a result of mass segregation. Also, a release of energy related to AGN activity might play a role in enhancing the accretion rate of novae. In fact, Sparks et al. (1993) showed the presence of outflowing dust and gas filaments near the nucleus of M87.
A comparison between the positions of the transients and the catalogue of globular clusters of M87 made by Kundu et al. (1999) shows no coincidence of their positions, indicating that the transients do not originate in present day globulars.
Unlike Livio, Riess, & Sparks (2002), who found an indication for an enhanced rate of novae in the vicinity of the jet (see also Shafter, Ciardullo &Prichet 2000), we do not find any particular orientation or alignement with respect to the jet in the thirteen transients we detect. The spatial distribution that we determine matches well with the findings of Sohn et al. (2006) and Shara et al. (2002), the transient sources described by these authors are not conspicuously oriented or aligned along the jet.
References
- Bertin (1996) Bertin, E., & Arnouts, S. 1996, A&AS, 117, 393
- Bowen (1952) Bowen, I.S. 1952, in Ann. Rep. Director Mt. Wilson and Palomar Obs., No. 51, p. 19
- Brown (2002) Brown, T. et al. 2002, HST STIS Data Handbook, version 4.0, ed. B. Mobasher, Baltimore, STScI
- Ciardullo (1990) Ciardullo, R., Shafter, A. W., Ford, H. C., Neill, J. D., Shara, M. M., & Tomaney, A. B. 1990, ApJ, 356, 472
- Ferrarese (1996) Ferrarese, L. et al. 1996, ApJ, 468, L95
- Ferrarese (2003) Ferrarese, L., Côté, P., & Jordán, A. 2003, ApJ, 599, 1302
- Jedrzejewski (1987) Jedrzejewski, R. 1987, MNRAS, 226, 747
- Junor (1999) Junor, W., Biretta, J. A., Livio, M. 1999, Nature, 401, 891
- Kim (2003) Kim Quijano, J., et al. 2003, STIS Instrument Handbook, version 7.0, Baltimore, STScI
- Kimble (1998) Kimble, R. A., et al. 1998, ApJ, 492, L83
- Koekemoer (2002) Koekemoer, A. M., Fruchter, A. S., Hook, R. N., & Hack,W. 2002, in The 2002 HST Calibration Workshop: Hubble after the Installation of the ACS and the NICMOS Cooling System, ed. S. Arribas, A. Koekemoer, & B. Whitmore, Baltimore, STScI, 339
- Kundu (1999) Kundu, A., Whitmore, B. C., Sparks, W. B., Macchetto, F. D., Zepf, S. E., & Ashman, K. M. 1999, ApJ, 513, 733
- Lauer (1992) Lauer, T. R., et al. 1992, AJ, 103, 703
- Livio (2002) Livio, M., Riess, A., & Sparks, W. 2002, ApJ, 571, L99
- Matteucci (2003) Matteucci, F., Renda, A., Pipino, A., & Della Valle, M. 2003, A&A, 405, 23
- (16) Pritchet, C. J. & van den Bergh 1987, ApJ, 318, 507
- Proffitt (2003) Proffitt, C. R., Brown., T. M., Mobasher, B., & Davies, J. 2003 Instrument Science Report, STIS 2003-01, (Baltimore: STScI)
- Shafter (2000) Shafter, A. W., Ciardullo, R., & Pritchet, C.J. 2000, ApJ, 530, 193
- Shara (2002) Shara, M. M., & Zurek, D. R. 2002, in Classical Nova Explosions, ed. M. Hernanz, & J. José, AIP Conf. Proc., 457
- Shara (2004) Shara, M. M., Zurek, D. R., Baltz, E. A., Lauer, T. R., & Silk, J. 2004, ApJL, 604, L117
- Sohn (2006) Sohn, S. T., O’Connell, R. W., Kundu, A., Landsman, W. B., Burstein, D., Bohlin, R. C., Frogel, J. A., & Rose, J. A. 2006, AJ, 131, 866
- Sparks (1993) Sparks, W. B., Ford, H. C., & Kinney, A. L. 1993, ApJ, 413, 531
- Sparks (2000) Sparks, W. B., Ferguson, H., Jedrzejewski, R., Macchetto, F. D., Biretta, J., & Livio, M. 2000, BAAS, 32, 1523
- Stickland (1981) Stickland, D. J., Penn, C. J., Seaton, M. J., Sniders, M. A. J., & Storey, P. J. 1981, MNRAS, 197, 107
- Tonry (2001) Tonry, J. L. et al. 2001, ApJ, 546, 681
- Warner (1995) Warner, B. 1995, Cataclysmic Variable Stars, (Cambridge: Cambridge University Press)
- Williams & Shafter (2004) Williams, S. J. & Shafter A. W. 2004, ApJ, 612, 867
| ID | R.A.aaRight ascension and declination offset in arcseconds from the center of M87 at R.A. = , decl = | Decl.aaRight ascension and declination offset in arcseconds from the center of M87 at R.A. = , decl = | rbbRadial distance of the nova candidate from the center of M87 in arcseconds. | Maximum Magnitude |
|---|---|---|---|---|
| HST-uvnova1 | 1.13 | 1.03 | 1.52 | 23.84 0.07 |
| HST-uvnova2 | 1.31 | 1.82 | 2.23 | 23.94 0.08 |
| HST-uvnova3 | -2.29 | -0.20 | 2.27 | 24.13 0.11 |
| HST-uvnova4 | 2.20 | 2.41 | 3.25 | 24.10 0.09 |
| HST-uvnova5 | -0.35 | -3.76 | 3.77 | 23.97 0.09 |
| HST-uvnova6 | -4.91 | -1.87 | 5.20 | 24.10 0.09 |
| HST-uvnova7 | 5.58 | -2.23 | 5.96 | 23.08 0.04 |
| HST-uvnova8 | -0.20 | 6.82 | 6.82 | 23.70 0.07 |
| HST-uvnova9 | -5.79 | 4.47 | 7.26 | 24.34 0.13 |
| HST-uvnova10 | -5.72 | 6.65 | 8.74 | 24.19 0.11 |
| HST-uvnova11 | -8.94 | -1.57 | 9.00 | 23.78 0.07 |
| HST-uvnova12 | -1.57 | 11.05 | 11.15 | 23.46 0.12 |
| HST-uvnova13 | -8.12 | -8.04 | 11.37 | 23.78 0.07 |
| Reference | yr-1 | Method |
|---|---|---|
| Shafter et al. 2000 | 91 34 | KPNO observations |
| Shara & Zurek 2002 | 300 | HST/WFPC2 observations |
| Matteucci et al. 2003 | 100-300 | Simulations |
| Ferrarese et al. 2003 | 70 23 | Simulations |