Photometric Selection of QSO Candidates From GALEX Sources
Abstract
We present a catalog of QSO candidates from the GALaxy Evolution EXplorer (GALEX) Release Two (GR2) UV catalog and the USNO-A2.0 optical catalog. The selection criteria are established using known quasars from the Sloan Digital Sky Survey (SDSS). The SDSS sample is then used to assign individual probabilities to our GALEX-USNO candidates. The mean probability is , and would rise to if better morphological information than that from USNO were available to eliminate galaxies. The sample is complete for . Candidates are cross-identified in 2MASS, FIRST, SDSS, and XMM-Newton Slewing Survey (XMMSL1), whenever such counterparts exist. The present catalog covers the 8000 deg2 of GR2 lying above , but can be extended to all 24 000 deg2 that satisfy this criterion as new GALEX data become available.
1 Introduction
One of our most important observational tools is a well-determined system of coordinates against which to measure the position of any given target. QSOs provide a natural means to establish an absolute frame of reference. The major drawback of using such a system today is the strong variation in the density of known QSOs across the sky: the great majority of known QSOs (Veron-Cetty, 2006) come from the Sloan Digital Sky Survey (SDSS), which is spectroscopically identifying quasars with with unprecedented completeness over the 10 000 deg2 of the north Galactic cap (Richards et al., 2002). The remaining 75 of the sky has a much lower density of known quasars.
There has also been recent interest in the spatial correlation function of QSOs (see, for example, Yang et al. 2006). While the SDSS sample covers a sufficiently large area on the sky to avoid biases due to cosmic variance, its limited coverage of the south Galactic sky means that it could miss potentially interesting features, while a catalog of QSOs constructed from our candidate set would not suffer from this drawback. Furthermore, a magnitude selected subset of a QSO catalog from the complete Galaxy Evolution Explorer (GALEX) All-sky Imaging Survey (AIS) could provide uniform coverage of the entire sky away from the Galactic disk.
In this paper, we develop selection criteria to identify QSO candidates using UV and optical photometry of sources drawn from GALEX Release Two (GR2) and USNO-A2.0 (Monet, 1998), respectively. Our use of optical photometry from USNO means that our selection criteria can be applied to sources in future GALEX releases, eventually extending our sky coverage to the 24 000 deg2 above , significantly larger than the area covered by SDSS. We tune our selection criteria by comparing to the colors of known quasars from SDSS Data Release Four (DR4); we also evaluate our selection efficiency and completeness using DR4. (For details concerning the procedures used by SDSS to select and verify candidate QSOs, see Schneider et al. 2005.)
Bianchi et al. (2005) have previously identified QSO candidates by matching GALEX and SDSS sources over a small area of the sky (92 ). Because their fields overlap SDSS with its superior photometry and morphological information, their efficiency and completeness are much better than ours, but at the cost of restricting their sample to regions of the sky that already have the densest quasar coverage. In a subsequent paper (Bianchi et al. 2006), the area considered has been expanded to 353 , examining sources from GALEX GR1 and SDSS DR3.
2 Input Catalogs
GALEX records magnitudes in two bandpasses, the Far UV (FUV) and Near UV (NUV) filters. The FUV filter is characterized by Å, with a range of Å; the NUV filter has Å, with a range of Å (Morrissey et al., 2005).
We select QSO candidates from GALEX GR2, which includes 7077 GALEX AIS pointings covering approximately square degrees on the sky111http://galex.stsci.edu/GR2/ as well as Medium Imaging Survey (MIS) and Deep Imaging Survey (DIS) pointings222http://galex.stsci.edu/GR2/. GR2 also contains targets from the Nearby Galaxy Survey, which represent possible contaminants in our catalog. The GR2 pointings are broadly distributed over the sky, except regions within 10∘ of the Galactic disk. The AIS pointings, constituting the bulk of those available, have limiting magnitudes of and in the AB magnitude system. The MIS pointings have limiting magnitudes of and , and the DIS pointings have limiting magnitudes of and (Morrissey et al., 2005).
We do not place any restrictions on the magnitude errors of our candidates in order to allow greater freedom for follow-up studies to set their own limits; the typical error on the NUV magnitudes is mag, while the typical error on the FUV magnitudes is mag. The distribution of errors in both bands has a long tail stretching to 0.6 magnitudes. Also, we assume that the internal processing performed to generate the GR2 catalog of sources successfully eliminates artifacts and other edge effects, and we do not consider contamination from these sources.
We match GALEX sources to the USNO-A2.0 catalog, which contains positions as well as and photometry for sources from the entire sky (Monet, 1998). The Palomar Optical Sky Survey (POSS) plates, from which the USNO-A2.0 catalog is derived, are complete down to (Monet, 2003). The R magnitude limit that we impose on our candidates is 1.5 magnitudes brighter than this limit, so we should approach the plate limits only for the bluest objects in our input sample. We find empirically that objects bluer than are so extraordinarily rare as to be negligible.
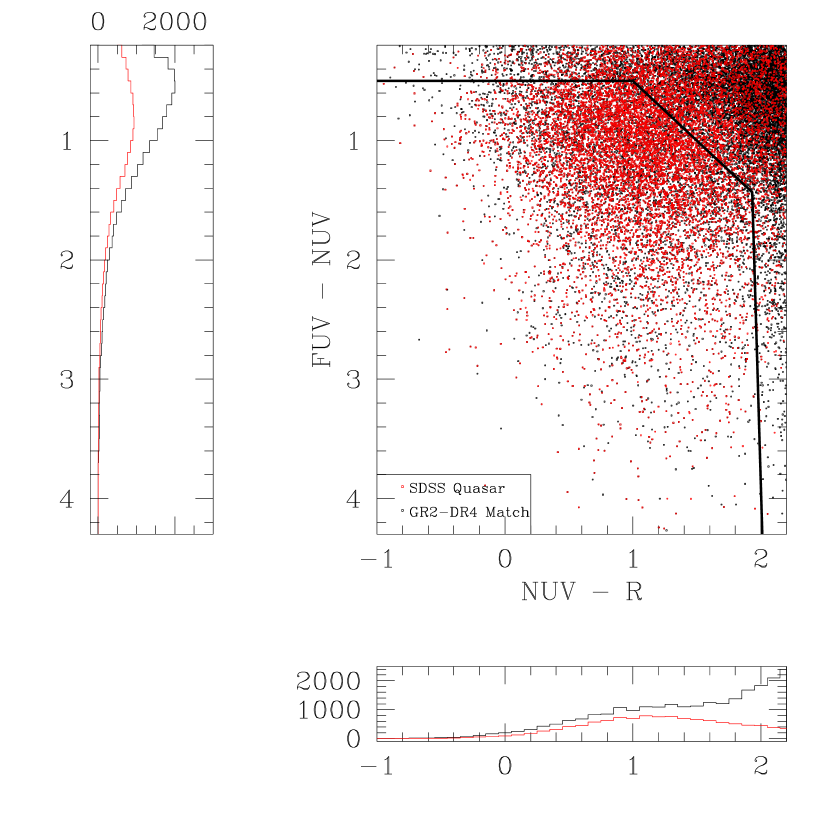
In order to examine the quality of the USNO band photometry, we took from the GR2 sources confirmed to be QSOs by SDSS those sources with and plotted a histogram of , shown in Figure 1. The additive term of on the x-axis is an (empirically) estimated correction to equate and band magnitudes. We assume that the dispersion about the mean is entirely due to the uncertainties in the USNO photometry, and find that the uncertainty in the USNO band photometry is approximately 0.35 magnitudes. This result is similar to the result of Salim & Gould (2003), who find the USNO band photometry has an uncertainty of 0.25 magnitudes, but suggests that the quality of the USNO photometry deteriorates at fainter magnitudes.
The GALEX team has matched GR2 to SDSS DR4, and we tune our selection criteria using this data set. We match GALEX sources to USNO-A2.0 by submitting coordinates for all GALEX sources with detections in both FUV and NUV bandpasses to the VizieR search engine, requesting matches within of each GALEX source. In order to fix a limiting match radius, we assume that the distribution of match distances should follow a 2-d Gaussian with contamination from uniformly distributed false matches. On the axes in Figure 2, a 2-d Gaussian projected into the radial direction yields a straight line; in order to find the underlying Gaussian, we subtract a 2% contamination from the distribution of match distances. The false-subtracted distribution begins to diverge significantly from the total distribution near 10 arcseconds squared. This suggests that we should choose a search radius near .
Using a search radius, we translate 15 000 GR2 sources south and find 145 false matches, indicating a 1% contamination by false matches at this radius. This suggests that is an ideal search radius, including a lower fraction of contaminants than the total set of matches, but still including of the GALEX astrometric uncertainty. Since we expect from the precision of our input photometry to have selection efficiency less than 90%, 1% contamination of our candidates via mismatches is acceptable.
From the GALEX-USNO matches selected by our search, we eliminate those with the USNO “bad-magnitude” flag set. The resulting list of matches contains 1 664 229 total sources; this constitutes the input used to develop our photometric selection criteria.
The USNO PSF is much smaller than either the FUV or NUV PSF, so we occasionally find multiple USNO counterparts for a single GALEX source; we keep the USNO counterpart closest to the GALEX position. Because we restrict our final candidate set to fields with , the contamination of our catalog due to blended stars producing apparently non-stellar GALEX colors should be minimal. Our catalog of matched sources initially contains numerous double-reported GALEX sources, since objects duplicated by repeated pointings at the same patch of sky have not been merged (S. Salim, 2006, private communication). We discuss the elimination of duplicated matches from our catalog in §4.
3 Photometric Limit Selection
We seek to develop criteria, using GALEX GR2 and USNO-A2.0 photometry, that select QSO candidates with a high probability of being real and retain as many candidates as possible. The high completeness (Richards et al., 2002) and excellent photometry of the SDSS quasars provide a superb calibration sample with which to tune these criteria.
We begin by identifying the subset of GALEX-USNO sources for which SDSS DR4 is essentially complete with regard to QSO selection. We demand that the source appears in GALEX’s set of SDSS matches and has , since SDSS systematically searched for quasars only down to this limit. Also, we require that there be at least one object within of the source with an SDSS DR4 spectrum. We select this radius by assuming an average density of 100 spectroscopic targets per square degree, and then requiring that there should be an average of five targets within our search radius. (We find by direct search that only 0.2% of spectroscopically observed targets have no additional target within the search radius.)
We display all sources satisfying these three criteria on an vs. (GALEX-USNO) color-color diagram, using red to mark SDSS QSOs and black for all other objects. We experiment with various polygons in the GALEX-USNO color-color plane to maximize the number genuine QSOs while minimizing the number of contaminants. Figure 3 shows our adopted polygon and the distributions of QSOs and non-QSOs within it, as well as just outside the selection area.
We place an additional constraint on the color of our candidates, in effect placing our selection criteria in a three-dimensional color space, in analogy with the procedure adopted by Richards et al. (2002) for SDSS. This additional cut provides only limited discrimination between QSOs and contaminants, due to the large uncertainties in USNO photometry, but it eliminates some outlying stars. We list our adopted color selection criteria in Table 1.
In addition to our color criteria, we find that the number of GALEX-USNO matches drops rapidly for , and we therefore limit our catalog to . Finally, by comparing the Galactic-latitude distribution of our QSO candidates to QSOs found in the Veron catalog (Veron-Cetty, 2006), we find that we have very little sensitivity for and therefore do not search for quasars below this limit. We believe this low sensitivity is due to heavy extinction in the -band.
4 QSO Candidates
After performing our photometric selection, we eliminate the duplicate candidates that entered the catalog through multiple GALEX exposures by looking for consecutive objects separated by less than . We selected this limit because Seibert et al. (2005) indicate that GALEX astrometry is accurate to within . We tested this radius by doubling it to and found that only eight additional GALEX objects were eliminated, so we deem a limiting radius sufficient for our purposes.
All candidates we determine to be associated with the same physical object are examined to determine whether the UV magnitudes changed between observations. Those candidates whose and magnitudes both changed by more than are flagged as variable. For these candidates, we compute average magnitudes using all available observations and record the averages in our catalog. For candidates that do not exhibit UV variability, we use the magnitude with the lowest listed uncertainty. Our initial sample of QSO candidates, selected as described in §3, includes 43 345 GALEX sources down to a limiting magnitude of . After eliminating duplicate GALEX sources, we retain 36 120 candidates, which comprise our final catalog.
4.1 Candidate Probability Assessment
We assess the probability that each candidate is a QSO by assuming that the ratio of QSOs to non-QSOs at fixed USNO-GALEX colors is independent of position on the sky, and only weakly dependent on apparent magnitude. In particular, we assume that the probability for a candidate with (for which we have substantially more data) is an accurate predictor of the probability for a fainter candidate with similar colors.
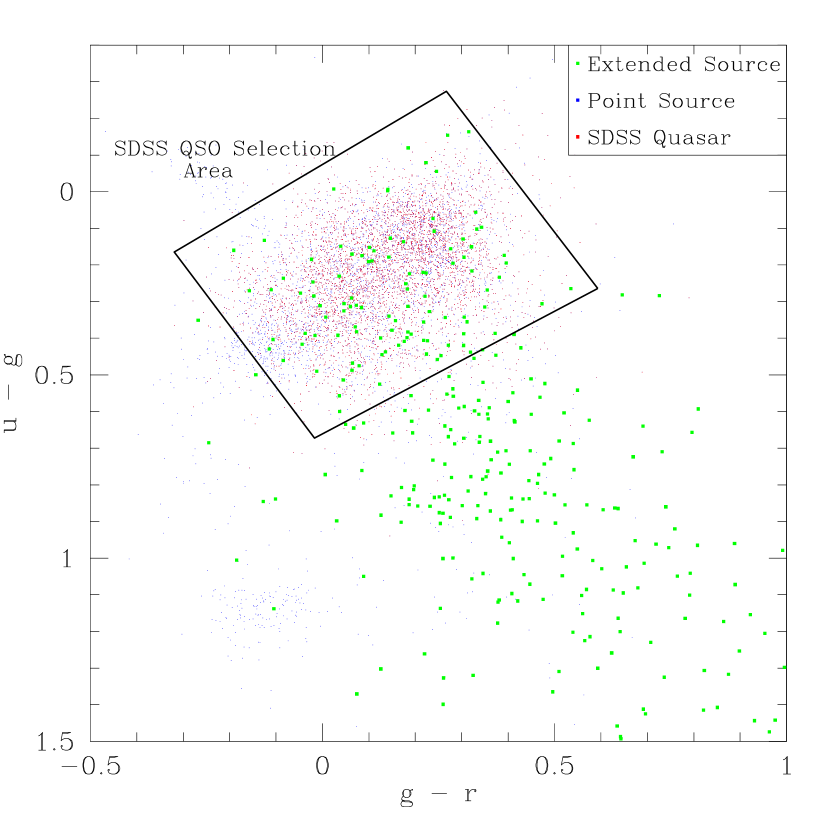
Bianchi et al. (2006) indicate that the fraction of QSOs at fainter magnitudes is enhanced with respect to stars, so this is a potential source of bias in our probability calculation. If we were strongly affected by this bias, we would under-predict the probability for faint candidates to be QSOs and over-predict the probability for bright candidates to be QSOs. We discuss this implication further in §4.3.1. Since Figure 4 shows that the fraction of selected point sources with SDSS colors similar to the SDSS QSOs is approximately constant with R magnitude, we believe that the effects on our probability calculation due to this bias are modest. The variation is stronger if extended sources are included as well, which is unsurprising if one considers the fact that QSO and galaxy colors show significant overlap even in SDSS colors. (See Fig. 5.) Nevertheless, the trend is still sufficiently regular that it should be correctable by the procedure we discuss below.
Most SDSS quasars occupy a relatively small region in color space, which we call the “SDSS QSO Selection Area”333The use of this name does not indicate any specific correlation with the SDSS spectroscopic target selection algorithm; it is simply a term of convenience. For details on the procedure SDSS uses to select quasar candidates for spectroscopy, see Richards et al. (2002).. Figure 5 shows where various types of sources fall within SDSS color space, and indicates the boundaries of the region we call the “SDSS QSO Selection Area.” Taking advantage of this correlation, we scale the probability according to the -magnitude of the candidate by accounting for the number of candidates that fall into our “SDSS QSO Selection Area” as a function of ,
| (1) |
where is the number of sources that fall within the region defined by the heavy lines in Figure 5, and is determined by dividing the number of SDSS QSOs within a circle of radius mag centered at by the total number of point sources in the same circle. The number of sources indicated by varies according to the parameter, and gives the total number of sources of magnitude ; for is the total number of sources with .
The first factor in equation (1) would give the probability that a candidate is a QSO if it were (somehow) known a priori to have . However, for many candidates there are no SDSS data. The second factor accounts for the fraction of sources at fixed that fall into the color-color region including most SDSS quasars. Its dependence on , both for all sources and for SDSS point sources only, is shown in Figure 4. Finally, the third factor is the correction accounting for the fact that not all SDSS quasars with actually fall into the “SDSS QSO Selection Area,” and that this missing fraction is already included when calculating .
For the candidates in our catalog, we calculate separate probabilities that the candidate will be an extended source, and therefore not a QSO (see §3), and that a given candidate will be a QSO, assuming that it is a point source. The extended-source probabilities are computed by using the density of SDSS extended sources relative to SDSS point sources in proximity to the candidate in USNO-GALEX color-color space,
| (2) |
where is the probability that a candidate with a given -magnitude will have , while and are the conditional probabilities that a candidate with a given color will be a point source for and , respectively. The conditional probabilities employed here are calculated in the same way as from equation (1).
The total probability that a given source is a QSO is obtained by multiplying the probability that a point source with given colors is a QSO () by the probability that the candidate is a point source, i.e.,
| (3) |
The distribution of total probabilities that we calculate using equation (3) is labeled “Total” in Figure 6.
Upon integrating the total probabilities, we find that of our candidates should be genuine QSOs, yielding a selection efficiency of for our catalog as a whole. This efficiency is reasonably good, in that only half the time of a spectroscopic follow-up study would be spent taking spectra of non-QSOs. The efficiency could be further improved by “pre-screening” the candidates with snapshot images to eliminate extended sources. This would require only 1 minute exposures on a 1m telescope, and would improve the overall efficiency to .
It should be noted that, while we have matched many of our candidates to various existing catalogs, we have not taken any such matches into account in our probability calculation, except insomuch as we have used SDSS quasars to determine and SDSS photometry to determine the conditional probabilities and . In particular, we have not elected to use the morphology indicator available from USNO-B to modify the probability of a candidate being extended or to eliminate candidates with apparently extended morphologies. See §4.2, below, for more information on our matching to USNO-B and a discussion of the USNO-B fields that we have included in our catalog.
Finally, our examination of matches between our catalog and sets of spectroscopically confirmed QSOs indicates that the probabilities we calculate provide a good statistical description of the candidates, but of course do not predict whether any given candidate will be a QSO.
4.2 Matching With USNO-B
It should be possible to reduce the fraction of telescope time spent observing poor candidates by including additional information available from the USNO-B catalog. Specifically, the contamination by foreground stars could be reduced by including the measured proper motions. In addition, the time spent observing extended sources, unlikely to be QSOs, could in principle be reduced by including star-galaxy separators. Thus, we match our catalog of candidates to USNO-B employing the same procedure described in §2 above, except allowing a search radius. We choose to allow an expanded search radius because the significantly smaller number of input objects reduces the number of spurious matches to an acceptable level.
Eliminating candidates with proper motions greater than twice the inherent uncertainty in the USNO-B proper motions leaves candidates out of with matches in the USNO-B catalog. (See Monet 2003 and Gould 2003 for discussion of the astrometric precision in USNO-B.) Application of this cut would reduce the number of SDSS quasars with proper motions measured by USNO-B from to , i.e. by , compared to a reduction in the total number of candidates. While the quoted proper motion cut would improve the fraction of genuine QSOs in the catalog, we have not eliminated the candidates with measurable proper motions from our catalog because a significant fraction of genuine QSOs would also be eliminated. We elect instead to list the proper motions and allow individual users to decide how to apply a proper motion cut.
We similarly choose not to eliminate candidates that do not appear point-like on the POSS plates. This is because there appears to be only a weak correlation between the star-galaxy indicators from USNO-B and the morphologies reported by SDSS. In Figure 7 the distribution of star-galaxy separators in the band is plotted for candidates with known SDSS morphologies. While there is a clear trend for galaxies to be less PSF-like than stars, the significant overlap between the two distributions belies the ability of the USNO star-galaxy separator to distinguish galaxies from stars at a level sufficient to improve our selection efficiency. As a result, we include the calculated probability for a candidate to be extended and the star-galaxy separators for both and bands in our catalog, but do not employ them to eliminate candidates.
4.3 Comparison With Sloan Digital Sky Survey
Of the QSO candidates selected by our algorithm, fall within the area covered by SDSS DR4, and are SDSS quasars. There are a total of candidates that have SDSS spectra, so at least candidates in DR4 are not SDSS quasars. Of the DR4 sources without SDSS spectra, have , and so were unlikely to have been selected for SDSS spectroscopy (Richards et al., 2002). Of the remaining candidates, fall more than from the nearest DR4 spectroscopic target, indicating that they lie in regions where spectroscopy is not yet available. (See §3.)
There are a total of SDSS QSOs with having counterparts in GR2, of which are identified as candidates by our criteria. This yields a total completeness of for our selection criteria with respect to the SDSS quasars. If we instead consider the number of SDSS quasars with USNO-A2.0 counterparts and detections in both the FUV and NUV bands, we find 11 321, yielding a completeness of . Of the remaining 7795 sources, most (6935) were excluded from our search because they had no detections.
Bianchi et al. (2005) develop a selection algorithm qualitatively similar to ours, and have sensitivity only to . The large number of SDSS QSOs lacking detections is due, at least in part, to the continuum flux of the higher- sources being redshifted out of the sensitivity range of the bandpass. As a result, we will preferentially miss high- QSOs. Most SDSS QSOs with extended morphologies appear redder than our selection boundary; this suggests that we also preferentially miss nearby, and thus low luminosity, SDSS QSOs. We know that there is also a significant population of point-like SDSS QSOs redder than the selection boundaries we have imposed. Some of these may be strongly reddened by intervening dust, suggesting that we will not be sensitive to highly absorbed QSOs. This is a natural consequence of searching for UV-excess QSOs; an IR survey like that of Barkhouse & Hall (2001) is preferred to find strongly absorbed QSOs.
In Figure 8, we compare the Galactic latitude distribution of DR4 QSOs with GR2 counterparts to that of the subset of our candidates with DR4 counterparts. Our candidates and the DR4 QSOs with GR2 counterparts follow roughly similar latitude distributions, indicating that our assumption in §4.1, that the probability for a given candidate to be a genuine QSO is independent of position on the sky, will provide a valid representation of candidate probabilities. This is not surprising, but its verification helps rule out strong influence by dust reddening in the Galactic disk. It is also worth noting that our selection procedure does fractionally better at very high Galactic latitude, due to larger sky coverage at very high latitude by GR2.
4.3.1 Candidates from the Kernel Density Estimate
Richards et al. (2004) select a set of UV-excess quasar candidates using SDSS photometry from DR1. The selection criteria they employ were subsequently applied to DR3 sources and the results published on the SDSS website444http://sdss.ncsa.uiuc.edu/qso/nbckde/. We have compared our candidate set to theirs and were thereby able to obtain another measure for the selection efficiency of our algorithm, independent of the limit imposed by SDSS for QSO candidates.
The kernel density estimate (KDE) candidate selection algorithm shows a 95.0% selection efficiency after correction for magnitude bias (Richards et al., 2004). We find 9119 unique candidates with matches in the KDE selected catalog, from a total of 15 860 candidates with DR3 matches. Assuming the quoted 95.0% efficiency of the Richards et al. (2004) candidate set, we estimate an efficiency of 55% for our selection criteria. This is essentially the same as the 52% we calculated in §4.1 above. The consistency of these two independent estimators indicates that our probability calculations are performing reasonably well.
As discussed in §4.1, the influence of a magnitude dependent bias would cause our probability assessment to differ from the “true” probability at both the bright and faint ends of our catalog. The much larger number of faint candidates relative to bright ones would result in a significant under-prediction in the number of total “good” candidates in our catalog, if we were strongly influenced by this effect. The confirmation of our probability calculation using the KDE-selected sample, which does not rely on the assumption that the probability for a bright candidate to be a QSO predicts the probability for a fainter object of similar colors to be a QSO, suggests that our probability calculation is not adversely impacted by the magnitude dependent variation in the fraction of QSOs with respect to hot stars, reported by Bianchi et al. (2006). This in turn implies that we successfully avoid the influence of magnitude dependent effects.
Our avoidance of such effects arises because we deliberately avoid selecting candidates from the stellar locus, insofar as is possible, in conjunction with our use of a magnitude dependent correction for the contaminant fraction. In addition, we do not include candidates significantly fainter than the limit for SDSS spectroscopy, thereby limiting the potential influence of magnitude dependent effects. It is, of course, possible that the dominant fraction of extended sources among the contaminants masks the effects of a magnitude dependent bias. The approximately constant fraction of point-like candidates with QSO colors, apparent in Figure 4, belies this interpretation, but we cannot absolutely exclude it without the results of an extensive spectroscopic follow-up beyond magnitude.
4.4 Comparison With Other Catalogs
In addition to SDSS, we compare our candidates to sources in the 2 Micron All-Sky Survey (2MASS), the Faint Images of the Radio Sky at Twenty cm (FIRST) survey, the XMM-Newton Slewing Survey (XMMSL1) (Freyberg et al., 2006) and the most recent Veron catalog of known QSOs (Veron-Cetty, 2006). We match our candidates to the Veron QSOs and 2MASS point sources via the VizieR search engine, requiring that the distance from the matched source to the candidate be less than . We find candidates with counterparts in the Veron catalog out of Veron QSOs with GR2 detections in both the FUV and NUV bandpasses. This corresponds to a completeness of 65%. The large difference between our completeness with respect to Veron and SDSS QSOs is somewhat surprising, given that the Veron-Cetty (2006) catalog includes DR4 QSOs. This higher completeness arises because we find a lower number of total matches between GR2 sources and Veron QSOs than GALEX found between GR2 and DR4. Seibert et al. (2005) indicate that a search radius was used in the original match between GALEX sources and SDSS DR1; however, Bianchi et al. (2006) indicate that the match performed between GR1 and DR3 used a search radius, which is smaller than ours. Depending on which search radius was employed for the matching between GR2 and DR4, it may be trivial to understand why we find fewer matches between GR2 and the Veron-Cetty (2006) catalog, or it may prove quite difficult to explain. Because we have been unable to determine the search radius used, we do not speculate further.
We also find candidates with 2MASS counterparts from a total of objects in the 2MASS All-Sky Catalog of Point Sources having GALEX detections in both the FUV and NUV bandpasses (Cutri et al., 2003). In their discussion of photometric selection of obscured QSO candidates using 2MASS colors, Barkhouse & Hall (2001) indicate that is characteristic of most optically-selected QSOs. While not necessarily indicating whether the selected candidates are genuine, the fact that of our candidates have is reassuring. Also useful is the fact that, because these 2MASS sources are members of the point source catalog, they are less likely to be galaxies than candidates in the general population. Specifically, we find that of candidates with SDSS counterparts exhibit extended morphology in SDSS photometry, while only of candidates with both SDSS and 2MASS counterparts are extended. However, this strong improvement is due largely to the relatively bright limiting magnitude of the 2MASS survey. If we restrict our examination to candidates with , beyond which point the number of candidates with 2MASS counterparts as a function of magnitude begins to decrease, we find that of candidates with SDSS counterparts are extended, compared to of those with both 2MASS and SDSS counterparts. Thus, bright candidates with 2MASS counterparts are somewhat less likely to exhibit extended morphology than other candidates, and would therefore yield a slight improvement in observational efficiency compared to the catalog as a whole.
The procedure we use to match our candidates with the FIRST catalog is similar, with the exception that we do not use the VizieR search engine but the web-based search tool provided by the FIRST collaboration555http://sundog.stsci.edu/cgi-bin/searchfirst. Again using a limiting search radius of , we find that of our candidates have counterparts in the FIRST catalog.
To match our candidates with the objects contained in XMMSL1, we acquire the complete catalog from the XMM-Newton Science Archive website and extract the columns of interest. We eliminate any source with a warning flag and search the remaining objects for positions within of our candidates. We take this approach, rather than using a fixed search radius, because of the large variation in astrometric uncertainty from one XMMSL1 object to the next. From the sources in XMMSL1 (Freyberg et al., 2006), we find that match our QSO candidates. The total probability of these matches predict that ten should be genuine QSOs; ten of these candidates appear in Veron-Cetty (2006), with little information for most of the others. One of candidates identified as a QSO in Veron-Cetty (2006) (USNO 1275-07898737) is unusual; it has an SDSS spectrum but cannot be classified by the automated pipeline.
In addition to our matching, we check the likelihood that spurious matches between our candidates and the various catalogs will cause significant contamination. For FIRST, Veron and 2MASS, we translate 15 000 candidates south by and repeat our matching procedure. For XMMSL1 we elect to translate the entire catalog of sources rather than doing a simple representative test because of the very small number of matches from XMMSL1. We find zero spurious matches in all four tests, indicating an exceedingly low probability for spurious matches between our candidates and the supplementary catalogs.
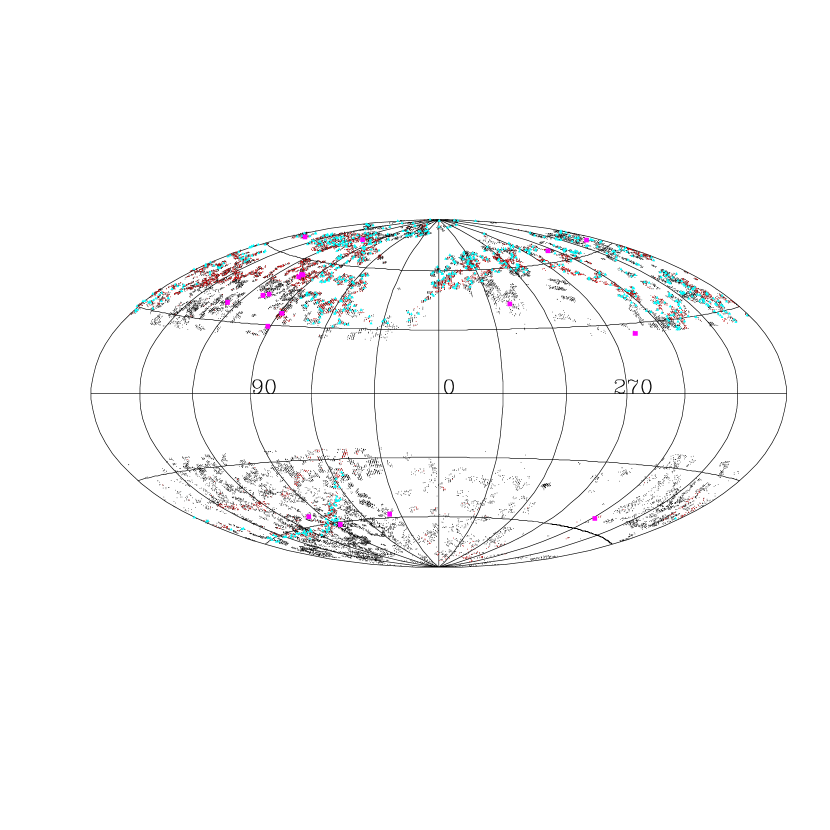
See Figure 9 for Galactic positions of our candidates, including indicators of matches to the Veron, FIRST and XMMSL1 catalogs.
5 Catalog Description
The catalog of candidates, which is organized by Right Ascension and appears in Table 2, includes candidates, after duplicated GALEX observations have been eliminated. It contains fields, including sky coordinates and identifiers from both the USNO-A2.0 and GALEX catalogs. Also included are two flags classifying the matches we have made to other catalogs. The first is the character flag indicating matches with Veron, 2MASS, XMMSL1 and FIRST. This flag consists of one or more characters that are added for matched candidates; ‘V’ indicating a match to Veron-Cetty (2006), ‘M’ to 2MASS, ‘X’ to XMMSL1 and ‘F’ to FIRST. In addition to these character flags, there is an integer flag indicating the nature of any SDSS counterpart. The allowed values of this flag and their meanings are summarized in Table 3.
As discussed in §4.2, we have included proper motions and mean star-galaxy separators from USNO-B for the great majority of our candidates. Proper motions are listed in the catalog in mas , as they are in the USNO-B catalog. Star-galaxy separators take a value from 0 to 11, with 11 indicating sources that are very similar to the POSS PSF and 0 those that are very dissimilar. USNO-B lists a star-galaxy separator for each detection on the POSS plates; we have averaged the star-galaxy separators for each magnitude where observations at multiple epochs are available. Monet (2003) indicates that this separator is approximately 85% accurate, but as mentioned above, it appears only weakly correlated with the SDSS morphology for our candidates. This difference may be due to the fact that we preferentially select candidates significantly fainter than the average magnitude of the USNO objects. A small number of candidates (30) have no identifiable counterpart in USNO-B, and so have no available proper motion. We have flagged these candidates by listing ‘’ in place of their proper motions.
6 Follow-Up
Following our candidate identification, we selected a group of targets without SDSS spectroscopy from DR4 that were visible from the MDM Observatory in Tucson, Arizona during early October. Using the CCDS spectrometer on the 2.4m Hiltner Telescope, we obtained low signal-to-noise spectra, sufficient for identification purposes, for seven candidates. We found three of these to be QSOs. Only one of the objects for which we obtained spectra falls into the SDSS area (0825-19933778), and while it was targeted as a QSO candidate by SDSS, our spectrum indicates it is probably a galaxy.
From the cumulative calculated probabilities, discussed in §4.1 above, we would expect of our targets to be quasars, so our finding three genuine QSOs is consistent with our calculated probabilities. A list of our spectroscopic targets and their identifications is given in Table 4. None of the three objects that we have identified as QSOs appear in the most recent Veron catalog (Veron-Cetty, 2006).
In addition to taking spectra, we also examine SDSS information for a number of the candidates we selected for spectroscopy, since more data have become available in DR5. We find SDSS information available for of our potential targets, of which are identified as quasars by SDSS. An additional were selected by SDSS as possible quasars, but have no public spectra in DR5. A list of these candidates, and the associated identifications, is found in Table 5. By again summing our calculated probabilities, we predict that candidates should be QSOs, which is again consistent with the number of targets and known QSOs. In conjunction with the results of our observations, this larger sample affirms that our probability calculation is performing reasonably well.
7 Conclusions
We have developed tight photometric selection criteria, allowing us to identify a large number of QSO candidates across 8000 deg2 of the sky. Since the GALEX AIS survey will cover the entire sky, it should be possible to apply our criteria to new data as they become available, identifying numerous additional QSO candidates, eventually covering the entire sky above . Candidates identified as QSOs in follow-up studies should fall in (Bianchi et al., 2005).
The contamination of our catalog by the presence of a significant number of galaxies, apparent from a cursory examination of Tables 4 and 5, should not come as a surprise given the purpose of the GALEX survey. The presence of a large number of galaxies means that a significant source of contamination can be eliminated using good-quality imaging, without even the need for precise photometry. This is advantageous, since many of the point-source contaminants appear to be white dwarfs, many of which could be eliminated using proper motions.
While the contamination of our catalog by galaxies and foreground stars is significant, and presents a challenge for follow-up observations, our algorithm selects numerous strong candidates. We have already identified some of these as QSOs. It is also possible that the contaminants (i.e., non-QSOs) in our sample may themselves be of considerable scientific interest. While we have not done extensive analysis, it appears that a combination of our selection criteria and good proper motions could allow the identification of a number of nearby white dwarfs.
It should be possible to select good targets for further study based on the calculated probabilities and other information available from our catalog, including the presence of matches to one or more additional catalogs and proper motions from USNO-B. The effort required to follow up any significant fraction of the candidates in the catalog will be considerable, but application of the available information should allow reasonable observational efficiency.
References
- Barkhouse & Hall (2001) Barkhouse, W.A. & P.B. Hall 2001, AJ, 121, 2843
- Becker et al. (2001) Becker, R.H. et al. 2001, ApJS, 135, 227
- Bianchi et al. (2005) Bianchi, L. et al. 2005, ApJ, 619, L27
- Bianchi et al. (2006) Bianchi, L. et al. 2006, astro-ph/0611926
- Cutri et al. (2003) Cutri R.M. et al. 2003, 2MASS All-Sky Catalog of Point Sources. NASA/IPAC Infrared Science Archive
- Freyberg et al. (2006) Freyberg, M.J. et al. 2006, in Proceedings of “The X-ray Universe 2005”, ESA Conference, edited by A. Wilson, (Noordwijk:ESA Publications Division), 913
- Gould (2003) Gould, A. 2003, AJ, 126, 472
- Henden et al. (1994) Henden, A.A. et al. 1994, in Astronomical data Analysis Software and Systems III, ASP Conf. Series 61, edited by D.R. Crabtree et al. (ASP, San Francisco), 223
- Monet (1998) Monet, D.G. 1998, AAS, 30, 1427
- Monet (2003) Monet, D.G. et al. 2003, ApJ, 125, 984
- Morrissey et al. (2005) Morrissey, P. et al. 2005, ApJ, 619, L7
- Richards et al. (2002) Richards, G.T. et al. 2002, ApJ, 123, 2945
- Richards et al. (2004) Richards, G.T. et al. 2004, ApJS, 155, 257
- Salim & Gould (2003) Salim, S. & Gould, A. 2003, ApJ, 582, 1011
- Schneider et al. (2005) Schneider, D.P. et al. 2005, AJ, 130, 367
- Seibert et al. (2005) Seibert, M. et al. 2005, ApJ, 619, L23
- Veron-Cetty (2003) Veron-Cetty, M.P. 2003, A&A, 412, 399
- Veron-Cetty (2006) Veron-Cetty, M.P. 2006, A&A, 455, 773
- Yang et al. (2006) Yang, Y. et al. 2006, ApJ, 645, 68
| Boundary Number | Boundary Criterion |
|---|---|
| 0 | |
| 1 | |
| 2 | |
| 3 | |
| 4 | |
| 5 | |
| 6 |


| UsnoA2 | GalexId | B | S/GB | R | S/GR | var | Flags | |||||||||||||
|---|---|---|---|---|---|---|---|---|---|---|---|---|---|---|---|---|---|---|---|---|
| 0675-00000126 | 2668921591511910656 | 000.00337 | -21.29793 | +00 | +00 | 18.5 | 4.5 | 18.0 | 7.5 | 20.16 | 0.22 | 18.77 | 0.09 | +000.0 | +000.0 | no | 0 | 0.0094 | 0.6901 | |
| 0750-00000123 | 2674128848516287376 | 000.00822 | -09.78075 | +01 | +01 | 18.0 | 8.0 | 18.2 | 2.5 | 21.51 | 0.36 | 19.90 | 0.13 | +000.0 | +000.0 | no | 3 | 0.2633 | 0.4545 | |
| 1125-00000322 | 2503018566919390734 | 000.01206 | +23.14655 | +00 | -01 | 18.9 | 7.5 | 19.4 | 9.0 | 23.15 | 0.40 | 20.25 | 0.04 | -016.0 | -018.0 | no | 0 | 0.0138 | 0.7117 | |
| 0975-00000292 | 2690067364777559570 | 000.01908 | +10.28768 | -01 | +00 | 19.4 | 9.0 | 19.2 | 3.0 | 21.98 | 0.46 | 20.10 | 0.16 | -038.0 | +016.0 | no | 0 | 0.2714 | 0.7159 | |
| 0450-00000669 | 2671243738594936409 | 000.02583 | -37.69187 | +00 | +00 | 17.0 | 8.0 | 17.1 | 2.5 | 20.78 | 0.25 | 18.97 | 0.07 | +000.0 | +000.0 | no | 0 | M | 0.1467 | 0.6356 |
| 0750-00000422 | 2667267895958962537 | 000.02755 | -07.86469 | -01 | +00 | 18.9 | 5.5 | 19.0 | 9.5 | 21.18 | 0.37 | 20.20 | 0.17 | +000.0 | +000.0 | no | 0 | 0.3096 | 0.7389 | |
| 0750-00000431 | 2434901622555410610 | 000.02801 | -09.70021 | +00 | -01 | 19.4 | 2.5 | 19.2 | 8.0 | 22.62 | 0.24 | 20.04 | 0.10 | -018.0 | -004.0 | no | 5 | 0.0191 | 0.7159 | |
| 0750-00000422 | 2667267891663998650 | 000.02815 | -07.86431 | +00 | +01 | 18.9 | 5.5 | 19.0 | 9.5 | 21.09 | 0.30 | 20.16 | 0.17 | +000.0 | +000.0 | no | 0 | 0.4035 | 0.5959 | |
| 0825-00000465 | 2667127184240411608 | 000.02816 | -00.78156 | +00 | +00 | 18.3 | 8.0 | 18.5 | 5.0 | 20.36 | 0.23 | 19.33 | 0.09 | -004.0 | +004.0 | no | 3 | 0.1159 | 0.6970 | |
| 0300-00000816 | 2671630758097980909 | 000.04020 | -54.94137 | +03 | +00 | 18.2 | 1.0 | 18.0 | 9.0 | 20.83 | 0.32 | 19.47 | 0.10 | +044.0 | -100.0 | no | 0 | 0.2032 | 0.7165 |
| SDSS Flag | Description |
|---|---|
| 0 | Candidate Not Matched to SDSS DR4 |
| 1 | SDSS Spectroscopic QSO |
| 2 | SDSS Spectroscopic Object, non QSO |
| 3 | SDSS Point Source in SDSS QSO Selection Area |
| 4 | SDSS Point Source Outside Selection Area |
| 5 | SDSS Extended Source |
| UsnoA2 | GalexId | B | R | FUV | NUV | identification | ||||
|---|---|---|---|---|---|---|---|---|---|---|
| 0900-00965406 | 2730529405564617292 | 063.531706 | +06.530249 | 16.8 | 17.4 | 20.0181 | 18.9442 | 0.2439 | 0.8747 | QSO |
| 0825-00917727 | 2692213620064913973 | 061.029129 | -04.323432 | 17.2 | 17.7 | 19.3757 | 18.2044 | 0.0000 | 0.6032 | white dwarf |
| 1350-07170209 | 2683171214963246695 | 114.759581 | +51.452008 | 17.0 | 17.1 | 19.2899 | 18.3432 | 0.1616 | 0.5998 | QSO |
| 0825-19933778 | 2417063145906373262 | 351.085003 | -00.106850 | 16.9 | 17.0 | 18.4359 | 17.8182 | 0.1152 | 0.5922 | galaxy |
| 0825-01094092 | 2732851565532546868 | 069.449286 | -00.558338 | 17.2 | 17.8 | 19.0123 | 18.2720 | 0.0449 | 0.5811 | QSO |
| 1200-00733002 | 2681904581863016067 | 026.357883 | +31.230357 | 14.3 | 14.4 | 16.2930 | 15.5469 | 0.0714 | 0.4184 | star |
| UsnoA2 | GalexId | B | R | FUV | NUV | note | ||||
|---|---|---|---|---|---|---|---|---|---|---|
| 1350-07258531 | 2419666789440952962 | 119.334475 | +46.140664 | 18.5 | 18.9 | 21.1635 | 19.6432 | 0.1361 | 0.8533 | galaxy |
| 1125-05419661 | 2734505226725757226 | 118.906600 | +28.797934 | 18.5 | 19.1 | 20.6899 | 19.2935 | 0.0000 | 0.8348 | target |
| 0750-21608063 | 2674128831336416631 | 359.907848 | -09.286531 | 17.6 | 17.8 | 21.5457 | 19.5283 | 0.0000 | 0.8277 | target |
| 1275-07063429 | 2419385314464241297 | 116.859656 | +38.071564 | 18.9 | 19.0 | 21.0233 | 20.0472 | 0.4028 | 0.8188 | target |
| 1350-07251808 | 2419842711301397137 | 118.974739 | +46.958306 | 18.5 | 19.2 | 21.8050 | 20.7278 | 0.5273 | 0.8019 | target |
| 1275-07063032 | 2683874910994960717 | 116.842331 | +42.259684 | 18.8 | 19.0 | 20.7258 | 20.0884 | 0.4387 | 0.7818 | galaxy |
| 0825-19928229 | 2417098330278467604 | 350.726370 | -00.306123 | 18.5 | 18.8 | 20.9769 | 20.0031 | 0.3180 | 0.7660 | target |
| 0825-19934300 | 2417133514650558073 | 351.118259 | -00.878914 | 18.9 | 19.3 | 20.7641 | 20.1369 | 0.1220 | 0.7653 | QSO |
| 0825-19939176 | 2417133514650558688 | 351.438406 | -00.719253 | 18.7 | 19.1 | 21.4841 | 20.2718 | 0.2730 | 0.7652 | target |
| 0825-00954157 | 2692213611474977784 | 063.038867 | -05.675050 | 18.3 | 18.9 | 21.5428 | 20.1445 | 0.2634 | 0.7568 | white dwarf |