Cold Gas in Cluster Cores
I review the literature’s census of the cold gas in clusters of galaxies. Cold gas here is defined as the gas that is cooler than X-ray emitting temperatures (K) and is not in stars. I present new Spitzer IRAC and MIPS observations of Abell 2597 that reveal significant amounts of warm dust and star formation at the level of 5 solar masses per year.
1 Introduction: Gas Census in the Core
Almost immediately following the discovery of clusters as X-ray sources came the realization that, as thermal X-ray sources, the gas in the cores of many of these systems is radiating energy at a prodigious rate. A simple calculation reveals that the enthalpy ( ) content in the gas in such systems would be expended many times during the lifetime of the system, unless replenished by source of energy over and above that of gravitational compression. Absent a distributed and significantly large heating source, the gas in this cooling flow picture should cool, lose pressure support, and thus gently settle deeper into the cluster potential (cf. Fabian, 1994).)
The rarity of cool gas and of recently formed stars in the cores of clusters of galaxies provided the main counter-evidence for the simple cooling flow model in the cores of clusters throughout the 1990s. The lack of X-ray coronal lines from species such as Fe XVII and O VII was the kiss of death for the simple cooling flow model (e.g., Peterson et al., 2001). But that discovery begged another question: what supplies the enthalpy radiated by these X-ray sources? The cold gas in cluster cores provides key clues about the processes occurring in the gas there.
Where applicable, I assume that the expansion of the universe can be described with km/s/Mpc. For ease of terminology, I will call these clusters ”cool core” clusters, although it is possible for the gas density to be high enough for the cluster to qualify as having a short central cooling time without a temperature gradient. (It is less awkward than referring to them as ”clusters formerly known as cooling flow clusters,” in any case.)
The core of a cluster of galaxies can usually be defined by the characteristic radius in a beta-model profile of the form density . is typically 100-200 kpc. Inside this region, the hot gas dominates with about M⊙, while stars provide M⊙ of the mass. The K ionized gas, emitting H, weighs in at about 10 M⊙, and as far as we know this gas seems to be always accompanied by collisionally-excited H2. There can be trace amounts of [OVI]-emitting gas at about K. Some systems may hold significant amounts of cold molecular hydrogen () M⊙. Recent Spitzer observations, reported here and by Egami et al. (2006) show that these systems also host star forming regions – not at the level to explain the old-fashined mass cooling rates, but enough to produce bright mid-IR Spitzer sources.
I have been invited to discuss the state of knowledge of each of these components in the ICM. I note that this area of observational astronomy is undergoing something of a re-awakening since 2000. The current field is not so much limited by technology, but by limited application of the technology we have to only a few sources. I am dubious as to the existence of a single prototypical cool core cluster. I will attempt to show where my conclusions are based on a detailed observation of a single object, or only on observations of the most extreme examples of the class.
2 Optical Emission Line Nebulae
Many of the cool core clusters host prominent optical emission line nebulae with characteristic radii of about 5-10 kpc. They were first discussed in context with the X-ray clusters by Cowie & Binney (1977) and Fabian & Nulsen (e.g., 1977). This field has been quite active (Ford & Butcher, 1979; Kent & Sargent, 1979; Heckman, 1981; Cowie et al., 1983; Hu et al., 1985; Johnstone et al., 1987; Romanishin & Hintzen, 1988; Johnstone & Fabian, 1988; Heckman et al., 1989; Sarazin et al., 1992; Voit & Donahue, 1990; Donahue & Voit, 1993; Allen, 1995; Crawford et al., 1995; Voit & Donahue, 1997; Crawford et al., 1999; Hatch et al., 2006; Wilman et al., 2006). For a review of the early studies (pre-2000), I have chosen to highlight the results in Heckman et al. (1989) and Voit & Donahue (1997) below.
The most famous of these nebula, the nebula in NGC1275, spans almost 100 kpc. They exhibit bright, low-ionization optical emission lines such as H, [OII]3727Å, [SII]6716/6730Å, [OI]6300 Å, and [NII]6548/6584Å. The total luminosities are around erg s-1. They are moderately broadened, at 100-200 km s-1. The [SII] lines can be used to derive typical electron densities of 100-300 cm-3 (e.g., Heckman et al., 1989), for a variety of sources. Voit & Donahue (1997) studied a single nebula in Abell 2597 with very deep optical spectra. With such specta, they could use a combination of the blue and red [OII] lines and the [SII] lines (the [OIII] triplet has only provided limits to date) (Voit & Donahue, 1997) indicate that the nebulae are surprisingly hot, K. These line ratios indicate a relatively low photoionization parameter (e.g. Heckman et al., 1989), where is the ratio of ionizing photon density to hydrogen particle density.
The line ratio analyses of many of the authors above tend to rule out strong shocks, at least in the high surface brightness nebulae near the center of the source. Most of the line ratios indicate a consistency with an ionization source with a black body temperature of greater than 100,000K, in addition to the expected ionization contributions from hot stars. The lack of He II recombination lines in a deep spectrum of Abell 2597 (Voit & Donahue, 1997) rules out photons with energies greater than 54 eV.
The radiative contribution of any AGN to the photoionization and heating is local at best. Near an AGN in these sources, one sees enhanced [OIII]/[OII] and prominent peaks in the surface brightness of [NII] and [SII]. Work by Crawford et al. (2005a, b) has shown that these filaments are not strongly turbulent. An interesting result from Hatch et al. (2006) regarding the filaments in NGC1275 that there is an insufficent number of stars to provide the excitation and heating of the nebular gas. (See Crawford, this proceedings.)
2.1 2A0335+096, a brief case study of a complicated system
We have observed the X-ray cluster 2A0335+096. We show here a new and deep narrow-band H image, taken during the early science phase of the SOAR telescope (a new 4-meter telescope located on Paranal, near Gemini South), together with re-reduced VLA data, optimizing the high spatial resolution information. We also present here a long-slit spectrum that was previously analyzed in only a single spectrum mode (Donahue & Voit, 1993). But because the slit was aligned along an interesting bar feature in the spectrum, and includes the light from a possibly interacting companion (with its own emission lines) and extended filament gas, it was worth reviewing the kinematic and excitation information (Donahue et al. 2007, submitted to AJ). The radio data show a clear lateral source, extending perpendicularly to the bar; the H image, while complex, show filaments arching around the radio source.
We identifed the two peaks in H intensity as A and B. These locations are the approximate peaks in the centers of the main galaxy (A) and the companion galaxy (B), separated by about 300 km/s and 4.6 kpc in projection. The peak B corresponds to the broadest lines ( km/s) in its region, and also to a region with enhanced [NII]/H ratios, indicating the presence of a small AGN in B. However, the story is different for A. The velocity peak and an abrupt change in the [NII]/H ratio occurs somewhat south of the surface brightness peak. This location (possibly the location of the AGN in galaxy A) is also blueshifted compared to A and B.
There is a gradient of gas velocity from A to B, which may be indicative of stripping. (The suggestion that it might be tidal is unlikely because of the lack of a similar feature in the stars.) From the relative velocities and projected distances, we have estimated that the companion galaxy/B last interacted with the brightest cluster galaxy (BCG, A) about 60 million years ago. The radio source timescale is approximately 50 million years. The estimated star formation rate, from XMM/Optical Monitor UV data and a dust-free H estimate is around 5 solar masses per year. We note that the velocity field is not turbulent along the axis of interaction between the two galaxies. The optical line emission is confined to the region of X-ray emitting gas that is less than about 2 keV, while the X-ray peak is well-separated from the BCG.
2A0335+096, while one of the more complex studied, is probably not all that unusual for its evidence of a dynamical interaction. What we find interesting here is that radio source showed evidence for blowing bubbles into the gas in this system and that the timescales for the interaction and the age of the radio source were quite similar. The complexity here may be induced by the rearrangement of injection sources while injection was occurring.
2.2 Integral Field Spectroscopy
2D optical (and IR) spectroscopy is clearly the best way to decompose the velocity fields in these systems. Wilman et al. (2006) have used the Visible Multiobject Spectrograph on the VLT, with 1600 optical fibers to obtain velocity and line ratio maps for 4 extreme cool-core clusters, Abell 1664, Abell 1835, Abell 2204, and Zw 8193. The relative velocites of the nebular features in these systems were low, around 100-300 km/sec. The biggest disturbances were in galaxies with companions. Remarkably, the [NII]/H ratio remains relatively constant across the system. It is possible that the AGN region may not have been well-sampled by the fibers.
3 Infrared Emission Line Nebulae
In the early 1990s, when the near-infrared spectroscopic capabilities were becoming available, Elston & Maloney (1994) began a ”cloudy night” project to observe the optical emission line nebulae of cooling flow clusters. They quickly discovered that these objects were bright H2 sources at 2 microns - nearly as luminous as the X-ray emission coming from the same region. The line ratios of the vibrationally-excited H2 lines indicated excitation temperatures of around 2000K. HST imaging with NICMOS revealed that the morphology of the vibrationally excited H2 emission was very similar to that of the optical emission line nebula (Donahue et al., 2000).
Near IR spectroscopy of these objects (Jaffe & Bremer, 1997; Falcke et al., 1998; Wilman et al., 2000; Krabbe et al., 2000; Jaffe et al., 2001; Edge et al., 2002; Wilman et al., 2002) showed that the spectrum was consistent with heating by a hot K stellar continuum, electron densities of over cm-3, and line ratios inconsistent with that of shocks. Therefore this gas is over-pressured by a factor of about 100-1000 compared to the pressures derived for the optical and X-ray gas.
Jaffe et al. (2005) detect near IR line emission out to 20 kpc from the centers of these systems, gas dynamics that are highly coupled with that of the optical emission-line gas, and also find evidence for an ionizing source consistent with a black body temperature of over 100,000 K.
I find it extremely interesting that the ”Mystery Ionization Sources” for both the optical filaments and the near infrared-emitting molecular gas have the similar property that both require EUV radiation, yet these photons must be less energetic than that required to produce He II recombination emission (Voit & Donahue, 1997). More He II searches are needed to see if that deficit in the optical spectrum is common.
4 Cold Molecular Hydrogen and CO
The decade of the 90s experienced many searches for the cold molecular gas associated with the putative cooling flow (Grabelsky & Ulmer, 1990; McNamara & Jaffe, 1994; O’Dea et al., 1994; Braine & Dupraz, 1994; O’Dea et al., 1995; Fujita et al., 2000). However, it wasn’t until the technology had progressed such that significant detections and maps were produced (Edge, 2001; Edge & Frayer, 2003; Salomé & Combes, 2003, 2004; Salomé et al., 2006) These detections were achieved with the JCMT and the IRAM. They saw between 300 million and 40 billion solar masses of cold (K) molecular hydrogen (inferred from the presence of CO) in the erg/s H-luminous systems that they targeted. Their successful detections were most likely in systems with the brightest H and 2-micron H2 lines.
5 Hot Gas - [OVI] Line Emission
The existence of the [OVI] emission line doublet at 1032/1035 ÅÅindicates the presence of million K gas. Non-primordial gas at this temperature cools extremely rapidly. It was found most commonly in our own Galaxy, first by the Copernicus satellite and more recently by FUSE. FUSE made long, night-time spectral observations of the central galaxies of several clusters. Oegerle et al. (2001) reported a detection in the cluster Abell 2597, but not Abell 1795. Later, Lecavelier des Etangs et al. (2004) reported only upper limits in Abell 2029 and Abell 3112, while most recently, Bregman et al. (2006) reported detections in the re-analyzed Abell 1795 data and in NGC1275, but not in the group AWM7.
So far, the detections are only in systems with known optical line emission. None of the reported detections are extremely strong. The Oegerle et al. (2001) Abell 2597 detection is of only one member of the doublet (the fainter one is obscured), while the Abell 1795 re-analysis by shows Bregman et al. (2006) excess in two locations, at the quoted level, but cut up by H2 and FeII Galactic absorption, and in the presence of significant continuum. It is a very difficult experiment on a small telescope, and appropriate caution should be applied. (The author can say there may be lessons learned from the Einsteint Observatory FPCS spectrum of NGC1275, (Canizares et al., 1988), a spectrum obtained with a 1 cm2 effective collecting area, reporting putative Fe XVII lines in the presence of X-ray continuum light.) That said, these limits and detections of [OVI] are consistent with a rather large cooling rate in the central region of the clusters, of about 30 solar masses per year in Abell 1795. Such a rate, if turned into stars would easily be visible to Spitzer observations.
6 Dust and PAHs: Spitzer’s Infrared Vision
While BCGs are not exactly know for their dust emission, even single-orbit HST images show that these systems have dust lane (e.g. A2052, A2597, PKS0745-191, 2A0335+096, A4059), as noted by Choi et al. (2004); Donahue et al. (2000); McNamara et al. (1996), this presentation. Older groundbased extinction maps of NGC4696 (Sparks et al., 1989) showed evidence for dust in that system that followed the emission-line gas. However, this detailed correspondence between dust and emission-line does not usually exist (e.g., Donahue et al. 2000).
Extinction towards the optical emission line filaments have been estimated from the decrement in a Balmer line series to be (Voit & Donahue, 1997). IUE-based Lyman- to ground-based H ratios (Hu, 1992) suggest .

Donahue & Voit (1993) showed that the emission-line gas itself is dusty, based on the intensity of calcium emission lines. The lack of calcium lines from the ionized gas shows that calcium has been strongly depleted into grains.
Dust emission was difficult to find, pre-Spitzer. IRAS had poor spatial resolution and low sensitivity, which resulted in only upper limits for dust in clusters. ISO had a scan mode, but here too the low spatial resolution and the low sensitivity limits the constraints. Stickel et al. (2002) found excesses and deficits of emission at 120 and 180 microns towards 6 nearby clusters. One promising lead may be the development of SCUBA, Edge et al. (1999) and, at resolution, Chapman et al. (2002), report 2 detections out of 7 clusters observed at 850 microns. NGC1275 has been detected by SCUBA (Irwin et al., 2001). They report about 60 million solar masses of extended, 20K, dust in NGC1275.
Egami et al. (2006) report Spitzer mid-IR (70 micron) detections of 3 clusters, Abell 2390, Zw 3146, and Abell 1835, in the course of their search for high-redshift lensed galaxies behind moderate redshift clusters of galaxies. They picked the 3 BCGs in their sample with the brightest MIPS 24-micron detections to follow up with longer wavelength observations.
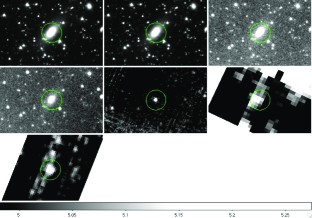
We present here new Spitzer data for Abell 2597 (Donahue & Sparks 2007, in prep). The BCG in Abell 2597 is well-detected in both IRAC (3.6, 4.5, 5.8, and 8 microns) and MIPS (24, 70, and 160 micron) observations. The total luminosity in the far infrared is approximately erg s-1. The broad-band spectral energy distribution shows an excess at 70 and 160 microns that well-exceeds the expected contribution from the Rayleigh-Jeans tail of the stellar contribution. (Figures 1 and 2.) Furthermore, the excesses at 5.8 and 8 microns indicate the presence of strong PAH emission, which should be confirmed by IRS spectroscopy once the extended source analysis is understood.
These observations consisted of 270 minutes in the IRAC band and only 36 minutes in the MIPS. The far infrared luminosity corresponds to about 4 solar masses per year (Kennicutt, 1998), which is inconsistent with the [OVI] cooling luminosity of M⊙ yr-1 (Oegerle et al., 2001). The inferred star formation rate is consistent with the UV star formation rate inferred from HST/STIS UV observations by O’Dea et al. (2004) and with the H star formation rate within about (Donahue et al., 2000) , about 2 solar masses per year based on the relations described in Kennicutt (1998).
7 Conclusions
We have reported a major Spitzer result for BCGs in cool core clusters of galaxies: a 70-160 micron excess well above the Rayleigh-Jeans tail of a stellar contribution. The luminosity and the spectrum are typical of a Luminous InfraRed Galaxy (LIRG) or a starburst. These spectra are consistent with UV and optical indicators of star formation in Abell 2597.
The various cold constituents of the clusters of galaxies reviewed here suggest a common excitation mechanism for all phases, at least for the brightest parts. The evidence for this includes: common hosts, similar photoionization and heating constraints, a relative lack of line ratio variation across the nebulae. However, these issues are far from settled, and may provide vital clues as to the mechanisms for cooling gas, feedback, and star formation in the local universe, in the largest galaxies known.
The questions remaining include: Are galaxy-galaxy interactions required to stimulate central optical / infrared nebulae? Are optical filaments trails of galaxies punching through a molecular hydrogen reservoir as suggested by Wilman et al. (2006), or are they lofted by buoyant radio plasma as suggested by Crawford and Fabian? What is the relationship between nebulae and star formation? Are the filaments farther from the stars excited by different mechanism from the filaments close in? What is this mysterious FUV (but not too FUV) ionization source for the optical and infrared filaments?
What next? I would like to see more Spitzer MIPS and MIPS-SED observations done before the cryocoolant is exhausted, at the end of April 2009 and the end of a short Cycle 5. These spectra and images are needed to get crtiical dust temperatures (see O’Dea cycle 3 program, with many co-Is in the community.) It would be very good to trace the velocity fields of the ICM using IFU and efficient (mapping mode) long-slit observations. Extremely deep optical spectra can provide emission-line diagnosticis to get nearly model-independent measures of T, Z, n, U (e.g. Voit & Donahue 1997). Deep X-ray observations should eventually reveal the faint coronal lines that ought to be present if some cooling gas is fueling the observed star formation. Finally, probing the relationship between the line-emitting gas, the dust emission, and the low-entropy X-ray emitting gas will require multi-wavelength imaging at somewhat similar spatial resolutions in order to test whether the morphologies of the emission regions really are similar.
References
- Allen (1995) Allen, S. W. 1995, MNRAS, 276, 947
- Braine & Dupraz (1994) Braine, J., & Dupraz, C. 1994, A&Ap, 283, 407
- Bregman et al. (2006) Bregman, J. N., Fabian, A. C., Miller, E. D., & Irwin, J. A. 2006, ApJ, 642, 746
- Canizares et al. (1988) Canizares, C. R., Markert, T. H., & Donahue, M. E. 1988, in NATO ASIC Proc. 229: Cooling Flows in Clusters and Galaxies, ed. A. C. Fabian, 63–72
- Chapman et al. (2002) Chapman, S. C., Scott, D., Borys, C., & Fahlman, G. G. 2002, MNRAS, 330, 92
- Choi et al. (2004) Choi, Y.-Y., Reynolds, C. S., Heinz, S., Rosenberg, J. L., Perlman, E. S., & Yang, J. 2004, ApJ, 606, 185
- Cowie & Binney (1977) Cowie, L. L., & Binney, J. 1977, ApJ, 215, 723
- Cowie et al. (1983) Cowie, L. L., Hu, E. M., Jenkins, E. B., & York, D. G. 1983, ApJ, 272, 29
- Crawford et al. (1999) Crawford, C. S., Allen, S. W., Ebeling, H., Edge, A. C., & Fabian, A. C. 1999, MNRAS, 306, 857
- Crawford et al. (1995) Crawford, C. S., Edge, A. C., Fabian, A. C., Allen, S. W., Bohringer, H., Ebeling, H., McMahon, R. G., & Voges, W. 1995, MNRAS, 274, 75
- Crawford et al. (2005a) Crawford, C. S., Hatch, N. A., Fabian, A. C., & Sanders, J. S. 2005a, MNRAS, 363, 216
- Crawford et al. (2005b) Crawford, C. S., Sanders, J. S., & Fabian, A. C. 2005b, MNRAS, 361, 17
- Donahue et al. (2000) Donahue, M., Mack, J., Voit, G. M., Sparks, W., Elston, R., & Maloney, P. R. 2000, ApJ, 545, 670
- Donahue & Voit (1993) Donahue, M., & Voit, G. M. 1993, ApJL, 414, L17
- Edge (2001) Edge, A. C. 2001, MNRAS, 328, 762
- Edge & Frayer (2003) Edge, A. C., & Frayer, D. T. 2003, ApJL, 594, L13
- Edge et al. (1999) Edge, A. C., Ivison, R. J., Smail, I., Blain, A. W., & Kneib, J.-P. 1999, MNRAS, 306, 599
- Edge et al. (2002) Edge, A. C., Wilman, R. J., Johnstone, R. M., Crawford, C. S., Fabian, A. C., & Allen, S. W. 2002, MNRAS, 337, 49
- Egami et al. (2006) Egami, E., Misselt, K. A., Rieke, G. H., Wise, M. W., Neugebauer, G., Kneib, J.-P., Le Floc’h, E., Smith, G. P., Blaylock, M., Dole, H., Frayer, D. T., Huang, J.-S., Krause, O., Papovich, C., Pérez-González, P. G., & Rigby, J. R. 2006, ApJ, 647, 922
- Elston & Maloney (1994) Elston, R., & Maloney, P. 1994, in ASSL Vol. 190: Astronomy with Arrays, The Next Generation, ed. I. S. McLean, 169–+
- Fabian (1994) Fabian, A. C. 1994, Ann. Rev. Astron. & Astrophysics, 32, 277
- Fabian & Nulsen (1977) Fabian, A. C., & Nulsen, P. E. J. 1977, MNRAS, 180, 479
- Falcke et al. (1998) Falcke, H., Rieke, M. J., Rieke, G. H., Simpson, C., & Wilson, A. S. 1998, ApJL, 494, L155+
- Ford & Butcher (1979) Ford, H. C., & Butcher, H. 1979, ApJS, 41, 147
- Fujita et al. (2000) Fujita, Y., Nagashima, M., & Gouda, N. 2000, PASJ, 52, 743
- Grabelsky & Ulmer (1990) Grabelsky, D. A., & Ulmer, M. P. 1990, ApJ, 355, 401
- Hatch et al. (2006) Hatch, N. A., Crawford, C. S., Johnstone, R. M., & Fabian, A. C. 2006, MNRAS, 367, 433
- Heckman (1981) Heckman, T. M. 1981, ApJL, 250, L59
- Heckman et al. (1989) Heckman, T. M., Baum, S. A., van Breugel, W. J. M., & McCarthy, P. 1989, ApJ, 338, 48
- Hu (1992) Hu, E. M. 1992, ApJ, 391, 608
- Hu et al. (1985) Hu, E. M., Cowie, L. L., & Wang, Z. 1985, ApJS, 59, 447
- Irwin et al. (2001) Irwin, J. A., Stil, J. M., & Bridges, T. J. 2001, MNRAS, 328, 359
- Jaffe & Bremer (1997) Jaffe, W., & Bremer, M. N. 1997, MNRAS, 284, L1
- Jaffe et al. (2005) Jaffe, W., Bremer, M. N., & Baker, K. 2005, MNRAS, 360, 748
- Jaffe et al. (2001) Jaffe, W., Bremer, M. N., & van der Werf, P. P. 2001, MNRAS, 324, 443
- Johnstone & Fabian (1988) Johnstone, R. M., & Fabian, A. C. 1988, MNRAS, 233, 581
- Johnstone et al. (1987) Johnstone, R. M., Fabian, A. C., & Nulsen, P. E. J. 1987, MNRAS, 224, 75
- Kennicutt (1998) Kennicutt, Jr., R. C. 1998, ApJ, 498, 541
- Kent & Sargent (1979) Kent, S. M., & Sargent, W. L. W. 1979, ApJ, 230, 667
- Krabbe et al. (2000) Krabbe, A., Sams, III, B. J., Genzel, R., Thatte, N., & Prada, F. 2000, A&Ap, 354, 439
- Lecavelier des Etangs et al. (2004) Lecavelier des Etangs, A., Gopal-Krishna, & Durret, F. 2004, A&Ap, 421, 503
- McNamara & Jaffe (1994) McNamara, B. R., & Jaffe, W. 1994, A&Ap, 281, 673
- McNamara et al. (1996) McNamara, B. R., Wise, M., Sarazin, C. L., Jannuzi, B. T., & Elston, R. 1996, ApJL, 466, L9+
- O’Dea et al. (1994) O’Dea, C. P., Baum, S. A., Maloney, P. R., Tacconi, L. J., & Sparks, W. B. 1994, ApJ, 422, 467
- O’Dea et al. (1995) O’Dea, C. P., Gallimore, J. F., & Baum, S. A. 1995, AJ, 109, 26
- Oegerle et al. (2001) Oegerle, W. R., Cowie, L., Davidsen, A., Hu, E., Hutchings, J., Murphy, E., Sembach, K., & Woodgate, B. 2001, ApJ, 560, 187
- Peterson et al. (2001) Peterson, J. R., Paerels, F. B. S., Kaastra, J. S., Arnaud, M., Reiprich, T. H., Fabian, A. C., Mushotzky, R. F., Jernigan, J. G., & Sakelliou, I. 2001, A&Ap, 365, L104
- Romanishin & Hintzen (1988) Romanishin, W., & Hintzen, P. 1988, ApJL, 324, L17
- Salomé & Combes (2003) Salomé, P., & Combes, F. 2003, A&Ap, 412, 657
- Salomé & Combes (2004) —. 2004, A&Ap, 415, L1
- Salomé et al. (2006) Salomé, P., Combes, F., Edge, A. C., Crawford, C., Erlund, M., Fabian, A. C., Hatch, N. A., Johnstone, R. M., Sanders, J. S., & Wilman, R. J. 2006, A&Ap, 454, 437
- Sarazin et al. (1992) Sarazin, C. L., O’Connell, R. W., & McNamara, B. R. 1992, ApJL, 397, L31
- Sparks et al. (1989) Sparks, W. B., Macchetto, F., & Golombek, D. 1989, ApJ, 345, 153
- Stickel et al. (2002) Stickel, M., Klaas, U., Lemke, D., & Mattila, K. 2002, A&Ap, 383, 367
- Voit & Donahue (1990) Voit, G. M., & Donahue, M. 1990, ApJL, 360, L15
- Voit & Donahue (1997) —. 1997, ApJ, 486, 242
- Wilman et al. (2000) Wilman, R. J., Edge, A. C., Johnstone, R. M., Crawford, C. S., & Fabian, A. C. 2000, MNRAS, 318, 1232
- Wilman et al. (2002) Wilman, R. J., Edge, A. C., Johnstone, R. M., Fabian, A. C., Allen, S. W., & Crawford, C. S. 2002, MNRAS, 337, 63
- Wilman et al. (2006) Wilman, R. J., Edge, A. C., & Swinbank, A. M. 2006, MNRAS, 371, 93