Magnetospheric accretion-ejection processes in the classical T Tauri star AA Tau††thanks: Based on observations obtained at ESO Obs., Chile, Maidanak Obs., Uzbekistan, Buryakan Obs., Armenia, Konkoly Obs., Hungary, and La Palma Obs., Spain.
Abstract
Context. Accretion and ejection are complex and related processes that vary on various timescales in young stars.
Aims. We intend to investigate the accretion and outflow dynamics and their interaction from observations of the classical T Tauri star AA Tau.
Methods. From a long time series of high resolution (R=115,000) HARPS spectra and simultaneous broad-band photometry, we report new evidence for magnetospheric accretion as well as ejection processes in the nearly edge-on classical T Tauri star AA Tau.
Results. AA Tau’s light curve is modulated with a period of 8.22d. The recurrent luminosity dips are due to the periodic occultation of the central star by the magnetically-warped inner disk edge located at about 9 R⋆. Balmer line profiles exhibit a clear rotational modulation of high-velocity redshifted absorption components with a period of 8.22 days as well, with a maximum strength when the main accretion funnel flow passes through the line of sight. At the same time, the luminosity of the system decreases by about 1 mag, indicative of circumstellar absorption of the stellar photosphere by the magnetically-warped, corotating inner disk edge. The photospheric and HeI radial velocities also exhibit periodic variations, and the veiling is modulated by the appearance of the accretion shock at the bottom of the accretion funnel. Diagnostics of hot winds and their temporal behaviour are also presented.
Conclusions. The peculiar geometry of the young AA Tau system (nearly edge-on) allows us to uniquely probe the acretion-ejection region close to the star. We find that most spectral and photometric diagnostics vary as expected from models of magnetically-channelled accretion in young stars, with a large scale magnetosphere tilted by 20 onto the star’s spin axis. We also find evidence for time variability of the magnetospheric accretion flow on a timescale of a few rotational periods.
Key Words.:
Accretion disks – Stars: pre-main sequence – Stars : magnetic fields – Stars: individual: AA Tau1 Introduction
For a few million years after their formation, young solar-type stars (T Tauri stars, TTS) continue to accrete material from their circumstellar disks. The accretion process has a profound and long lasting impact on early stellar evolution. It is thought to be the driving source of the powerful jets originating from young stars and to regulate their angular momentum before they reach the zero age main sequence. Accretion is also the central ingredient of disk evolution at a time when planets start to form, and accretion both into the disk and onto the star is held responsible for most of the peculiar properties of T Tauri stars (see, e.g., the review by Ménard & Bertout 1999). Understanding how accretion proceeds into the disk and onto the star is therefore a major issue for star and planet formation theories.
It is now commonly acknowledged that accretion from the inner disk onto the star is, at least in part, mediated by the stellar magnetic field. Recent Zeeman measurements indicate surface magnetic fields of a few kilogauss in T Tauri stars (e.g. Johns-Krull et al. 1999, 2004; Symington et al. 2005a), strong enough to disrupt the inner disk region and control the accretion flow. It is thus expected that the inner disk edge lies at a few stellar radii from the central star and that material is accreted onto the star along funnel flows which follow the topology of the large scale component of the stellar magnetosphere. As the free-falling material eventually reaches the star, the kinetic energy is dissipated in a shock at the stellar surface (see, e.g. Königl 1991).
Recent numerical simulations of the magnetic star-disk interface confirm most of these expectations. Assuming a dipolar magnetosphere on the large scale, whose axis can either be aligned with or inclined onto the stellar rotation axis, simulations show the development of the inner disk truncation by strong magnetic fields, leading to a magnetospheric cavity extending over a few stellar radii (e.g. Romanova et al. 2002, 2003). In this magnetically-controlled region, material is accreted onto the star through a complex and time variable network of funnel flows, whose structure and evolution depend on the accretion rate, on the topology of the magnetosphere and its inclination on the stellar axis (e.g. Romanova et al. 2003). As a result, the accretion shock at the stellar surface can take various shapes and be located at different latitudes (Romanova et al. 2004). Both numerical simulations and analytical models suggest that the inner disk structure is significantly modified by its interaction with the stellar magnetosphere (Lai 1999, Terquem & Papaloizou 2000).
The winds of classical T Tauri stars (CTTSs) have been primarily investigated through the observations and modelling of forbidden emission lines, whose high velocity component originates in spatially extended microjets (Hartigan et al. 1995, Shang et al. 2002). A few CTTSs had actually their microjets emission imaged. They arise in a region very close to the star and were observed with ground based adaptive optics (Dougados et al. 2000) and HST (Bacciotti et al. 2002), providing unprecedent information on the dynamics near the base of the jet, where the wind is formed. Other high velocity inner disk wind diagnostics include cooler outflowing gas that absorbs emission from the accreting material (Edwards 2003) and the observed hot helium gas in emission (Beristain et al. 2001) as well as P Cygni profiles with strong blueshifted absorptions reaching well into the stellar continuum over a broad velocity range (Edwards et al. 2003, Dupree et al. 2005). The above wind signatures are prominent in CTTSs with high mass accretion rates, indicating that these are actually accretion-powered winds.
With an extension of a few stellar radii up to the inner disk edge ( 0.05 AU), the magnetospheric cavity can hardly be resolved directly, even with the most powerful interferometers (e.g. Akeson et al. 2005). In addition, the magnetospheric cavity is filled with hot gas while dust particules are likely sublimated. Hence, diagnotics of hot plasma would have to be observed at this scale, which requires interferometric observations at high spectral resolution. For the time being, only indirect signatures of the structure of the star-disk interaction region and its physical properties can therefore be searched for.
As the magnetospheric cavity up to the disk inner edge is thought to corotate with the central star, a powerful approach to confront model predictions is to monitor the variations of suited photometric and spectral diagnostics over a few rotational periods. Synoptic studies may reveal periodic variability which can then be associated to physical structures in the rotating magnetosphere and the inner disk. A number of such studies have been performed in the last decade providing (sometimes conflicting) clues to the magnetospheric accretion process in young stars (see Bouvier et al. 2006 for a review).
Two of our previous monitoring campaigns (Bouvier et al. 1999, 2003, Paper I and Paper II hereafter) have focused on the classical T Tauri star AA Tau. Thanks to its high viewing angle ( 75), the line of sight to the stellar surface intercepts the star-disk interface close to the disk plane. This fortunate configuration maximizes the observational signatures of the magnetospheric accretion process. Furthermore, AA Tau is quite a typical classical T Tauri star, with a K7 spectral type, moderate accretion rate and Class II SED. Hence, it is likely that the results obtained for this otherwise unremarkable CTTS can be extended to the whole class of CTTSs.
From our previous campaigns on AA Tau we reported evidence for the modulation of photometric and spectroscopic diagnostics with a period of 8.2 days, the rotational period of the star. The modulation of the stellar flux was interpreted as resulting from the periodic occultation of the stellar photosphere by the optically thick, magnetically-warped inner disk edge located at 8.8 stellar radii (Bouvier et al. 1999). A second campaign allowed us to relate the recurrent eclipses of the star by the inner disk to accretion funnel flows and accretion shocks at the stellar surface (Bouvier et al. 2003). We also found evidence for large scale changes occurring in the accretion flow onto the star on a timescale of a few weeks, presumably resulting from a major disturbance of the underlying magnetospheric structure.
In this paper, we report the results of a new campaign on AA Tau aimed at further constraining the structure of the magnetically-dominated star-disk interaction region. We have monitored the photometric variations of the system over nearly 5 months in the fall of 2004, and during part of the photometric campaign, we simultaneously obtained a series of high resolution (R=115,000) spectra on the object. To our knowledge, this is the first time such a series of high resolution spectra have been obtained on a T Tauri star. In Section 2, we describe the photometric and spectroscopic observations obtained during this campaign. In Section 3, we present the results on the photometric and spectroscopic variability of AA Tau, which we find to be periodic with the same period as reported previously. In Section 4, we discuss the new evidence provided by these observations for magnetospheric accretion and ejection processes in this object.
2 Observations
2.1 Photometry
| Observatory | JD-2450000. | Filters | Observer | Country | Nobs(V) |
|---|---|---|---|---|---|
| Maidanak | 3260.-3311. | Tube BV | K. Grankin | Uzbekistan | 19 |
| Maidanak | 3307.-3346. | CCD BV | M. Ibrahimov | Uzbekistan | 32 |
| Buryakan | 3297.-3316 | CCD BV | T. Magakian | Armenia | 5 |
| Konkoly | 3334.-3382 | CCD BV | Z. Balog | Hungary | 32 |
| IAC | 3326.-3396 | CCD V | S. Hodgkin | Canarias | 28 |
The Journal of photometric observations is given in Table 1. Observations were carried out from several sites over a time span of nearly 140 days from September 2004 to January 2005, using either CCD detectors or photomultiplier tubes. Measurements were obtained in the B and V filters. Differential photometry was performed on CCD images and absolute photometry from photomultiplier observations, with an accuracy of the order of 0.01mag in both filters. Somewhat larger systematic errors ( 0.05 mag) might result from the relative calibration of the photometry between sites. All data reduction procedures were previously described in Bouvier et al. (2003).
2.2 Spectroscopy
The spectroscopic observations of AA Tau were carried out from October 10 to December 02, 2004, at ESO, La Silla. We obtained 22 high-resolution spectra, over 22 non consecutive nights spread between JD 3288 and JD 3341 at the 3.6 m telescope with the HARPS dual fiber echelle spectrograph (Mayor et al. 2003) covering the 3800 Å to 6900 Å spectral domain at a spectral resolution of . Integration times of 1800s yielded a S/N ratio between 10 and 30 at 600 nm depending on the object brightness. Quasi-simultaneous photometry was obtained over the period of the spectroscopic observations (JD 3288-3341, see Table 1). The Journal of spectroscopic observations is given in Table 2.
The data was automatically reduced by the HARPS Data Reduction Software. The reduction procedure includes optimal extraction of the orders and flat-fielding, achieved through a tungstene lamp exposure, wavelength calibration with a thorium lamp exposure and the removal of cosmic rays. Cross-correlation functions are also automatically computed. The background sky is not automatically subtracted but it can be done later by the observer.
| JD | Veiling | phot. | HeI | (H blue) | (H red) | H EW | HeI EW | H EW |
|---|---|---|---|---|---|---|---|---|
| -2450000. | (km s-1) | (km s-1) | (km s-1) | (km s-1) | (Å) | (Å) | (Å) | |
| 3288.82 | 0.17 | 0.8 | 5.4 | -42.5 | 5.2 | 15.6 | 0.3 | 1.7 |
| 3289.82 | 0.26 | 0.7 | 4.0 | -22.7 | 32.2 | 12.3 | 0.7 | 1.4 |
| 3291.80 | 0.54 | -3.1 | 5.8 | -24.5 | 30.9 | 21.9 | 1.1 | 2.2 |
| 3295.80 | 0.15 | -0.3 | 9.7 | -27.2 | 16.0 | 9.5 | 0.2 | 1.3 |
| 3296.81 | 0.15 | 0.7 | 9.6 | -37.3 | 4.9 | 15.1 | 0.3 | 2.2 |
| 3297.80 | 0.19 | 0.7 | 4.5 | -26.7 | 16.7 | 15.9 | 0.4 | 1.8 |
| 3298.84 | 0.22 | 0.9 | 5.3 | -30.9 | 26.9 | 11.8 | 0.7 | 1.2 |
| 3308.77 | 0.18 | -0.4 | 8.2 | — | — | 5.0 | 0.5 | 0.9 |
| 3309.81 | 0.31 | -1.0 | 5.2 | — | — | 8.9 | 0.3 | 0.8 |
| 3310.78 | 0.21 | -1.0 | 12.2 | -24.2 | 17.5 | 6.7 | 0.4 | 0.7 |
| 3311.76 | 0.14 | -1.0 | 6.1 | -27.7 | 17.2 | 7.3 | 0.2 | 0.9 |
| 3312.77 | 0.19 | -0.4 | — | -35.0 | 20.9 | 8.4 | 0.2 | — |
| 3314.75 | 0.15 | 0.5 | 7.2 | — | — | 63.7 | 0.5 | 4.0 |
| 3315.75 | 0.18 | 0.3 | 4.6 | — | — | 34.0 | 0.5 | 2.8 |
| 3320.79 | 0.13 | 0.5 | 11.0 | -33.8 | 22.5 | 13.9 | 0.3 | 0.8 |
| 3332.69 | 0.40 | 0.7 | 7.1 | -22.9 | 40.1 | 30.5 | 1.2 | 2.5 |
| 3335.71 | 0.24 | -2.0 | 11.7 | -12.9 | 44.4 | 19.5 | 0.5 | 2.0 |
| 3337.76 | 0.20 | 0.5 | 7.3 | -23.5 | 48.0 | 23.7 | 0.4 | 2.0 |
| 3338.73 | 0.27 | 1.2 | 3.2 | -18.9 | 47.2 | 23.6 | 0.7 | 1.7 |
| 3339.73 | 0.41 | 1.7 | 3.8 | -15.9 | 49.6 | 43.1 | 1.4 | 3.4 |
| 3340.72 | 0.68 | 3.7 | 7.7 | -12.6 | 52.4 | 44.1 | 1.6 | 2.6 |
| 3341.72 | 0.41 | 1.1 | 13.0 | -13.4 | 50.6 | 38.3 | 1.1 | 2.4 |
3 Results
3.1 Photometry
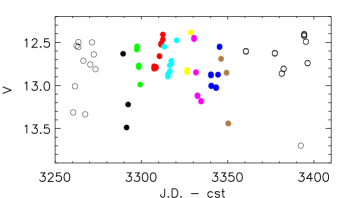

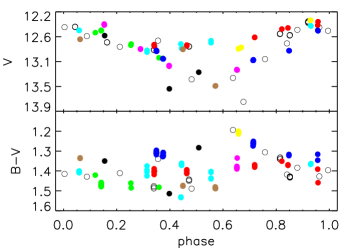
AA Tau’s V-band light curve is shown in Figure 1 over nearly 150 days. It is characterized by a nearly constant level of maximum brightness (V12.4) with luminosity drops reaching 1.2 magnitudes. The general photometric behaviour of AA Tau during this campaign is qualitatively similar to what we had previously reported for similar light curves obtained in 1995 and 1999 (see Bouvier et al. 1999, 2003). Periodogram (Horne & Baliunas 1986, Roberts et al. 1987) and string-length (Dworetsky 1983) analyses of the V and B-band light curves reveal a clear periodic signal with P=8.220.03 days, consistent with previous estimates (8.2-8.6d, see Vrba et al. 1989, Shevchenko et al. 1991, Bouvier et al. 1999, 2003). The CLEANed periodogram of the V-band light curve is shown in the bottom panel of Figure 1. The False Alarm Probability (FAP) was computed following the Monte Carlo method described in Herbst et al. (2002). The FAP of the highest periodogram peak was found to be less than 0.01%. The V-band light curve folded in phase with this period is shown in Figure 2. Similar results are obtained for the B-band light curve. The phased light curve exhibits a broad brightness minimum with an amplitude of about 1 mag. A large dispersion of the flux is seen to occur within the deep minimum.
In previous papers of this series, we argued that the 8.22-day period is the rotational period of the star. From the modelling of AA Tau’s spectral energy distribution, Basri & Bertout (1989) derived an inclination angle of 70 (see also O’Sullivan et al. 2005). This estimate combined with a of 11.3 km s-1 (Paper II) and a stellar radius of 1.85 R⊙ (Paper I), leads to an expected rotational period of 7.8d in rough agreement with the measured photometric period. In addition, we report below for the first time a period similar to the 8.2-day photometric period for the flux and radial velocity variations of emission lines as well as for veiling. This supports the 8.2-day period as being the stellar rotation period.
A closer examination of the phased light curve reveals that the amplitude of modulation varies from cycles to cycles, reaching about 1.2 mag from JD 3260 to JD 3300 (5 cycles) and again from JD 3330 to JD 3350 and perhaps later (2.5 cycles), but amounting to only 0.3 mag between JD 3305 and JD 3330 (3 cycles). Even though the amplitude changes, the phase of the modulation appears to be conserved over the whole 140 day-long observations.
B-V colours were computed from each quasi-simultaneous B and V measurements. The phased variations of the B-V colour are shown in Figure 2. The amplitude of B-V color variations amounts to 0.3 mag only, much shallower than the brightness variations. There is no clear evidence for a modulation of the B-V color within cycles, and most of the dispersion results from B-V color changes from one cycle to the next. It is noteworthy that both the bluest (1.3) and the reddest (1.5) B-V colors can occur during the brightness minimum.

In addition to the photometry reported here, we found a number of V-band measurements obtained for AA Tau at the same epoch by the All Sky Automated Survey (ASAS, Pojmanski et al. 2005). Adding these measurements to ours, we show the resulting phased light curve in Figure 3. A periodogram analysis of this dataset confirms the 8.2-day period at the 0.01% FAP level. ASAS measurements also confirm the stability of the phase of the photometric variations over a timescale of nearly half a year (170 days), while the depth of the photometric minima is much more variable.
3.2 Spectroscopy
3.2.1 Photospheric lines
The photospheric lines of CTTS often appear shallower than expected for their spectral types. This is due to an extra continuum, known as veiling, produced at the shock region where the infalling material hits the star, that is added to the stellar continuum. In order to use the veiling as a proxy for accretion onto the stellar surface (cf. Paper I), we computed the veiling using a fit, based on the method described by Hartigan et al. (1989), on six spectral intervals about 50 Å-wide located between 5400 Å and 6700 Å. We used as a reference for the veiling calculations a spectrum of the K7 weak T Tauri star V819 Tau obtained with HARPS with the same observing setting as AA Tau. This weak T Tauri star was shown in Paper II to be a very good match to the AA Tau photosphere. The spectrum of V819 Tau was rotationally broadened to the AA Tau value determined in Paper II (11.3 km s-1). The veiling standard deviation was computed for each night using the veiling values obtained in the 6 separate orders. The rms deviation ranges from 0.04 to 0.14, with a mean value of 0.07 over the 22 nights.
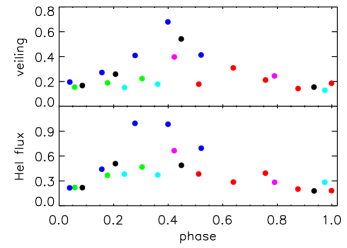
The derived veiling values are low, ranging from 0.2 to 0.7, but are considerably higher than in Paper II, where they were all below 0.3. A periodogram analysis suggests that the veiling varies periodically with a 8.20.3 day period (FAP=0.22), which is consistent with the stellar rotation period given the much poorer time sampling of the spectroscopic data (see Figure 4). The veiling is weak and almost constant in the photometric cycles where only a shallow brightness minimum is present, while it shows a strong peak near phase 0.4 in the deep minimum cycles. In Paper II, the veiling presented two maxima per photometric cycle, as if we were seeing 2 hot spots at the surface of the star, while in 2005 only one maximum per cycle is visible. We measured the equivalent width of the He I line by direct integration on the spectrum and computed line fluxes with the photometric measurements as , where is interpolated from the light curve on the time of the spectroscopic observations. The rms error on the normalized HeI flux is of order of 0.1 (cf. Fig. 4). We observe a strong correlation between the veiling and the He I line flux, as well as between veiling and EW(HeI) measured either on the veiled or on the deveiled spectra (correlation coefficient of 0.9, cf. Fig. 5), and a weaker correlation between the veiling and B-V. The B-V vs. veiling behavior is however still consistent with the 1999 results, lower B-V values corresponding to higher veiling values.

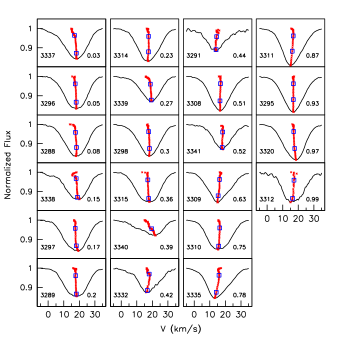
Cross-correlation functions (CCFs) of the photospheric spectrum were automatically computed by the HARPS spectrograph reduction pipeline using a binary mask corresponding to a K5 template spectrum. CCFs provide high signal-to-noise information about the features present in the star’s averaged photospheric spectrum. They were computed for each AA Tau’s spectrum and are shown in Figure 6. It is seen that the averaged photospheric line profiles are sometimes asymmetric and this could be the cause of the radial velocity variation noticed in Paper II.
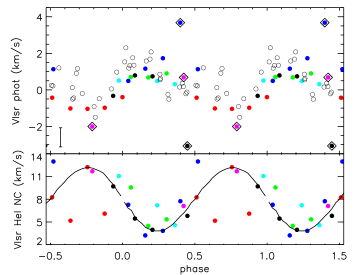
We measured the radial velocities adjusting a gaussian to the cross-correlation profiles in three different ways: fitting the profile centroid, the far wings, or an intermediate region between the minimum and the far wings. The mean radial velocity values obtained with the three different fitting procedures agree with each other ( km s-1) and are consistent with the value obtained in Paper II ( km s-1). Individual values can vary by as much as km s-1 between different fits, but the three radial velocity data sets presented the same periodicity of 8.5 0.4 days when submitted to a periodogram analysis (FAP=0.02), which is slightly but not significantly different from the photometric period. All radial velocities below are expressed in the stellar rest frame ().
In Figure 7 we show the radial velocities obtained fitting the wings of the cross-correlation profiles, overplotted with the values determined in Paper II. The radial velocity variations exhibit the same period and about the same amplitude as those reported in Paper II. We cannot tell whether the phase is conserved over the 5 year timescale between the 2 epochs. This time span corresponds to about 220 periods and phase conservation could be tested only if the period was derived to an accuracy of 0.1% or better. Nevertheless, the very good agreement between the two datasets suggests a similar origin for the observed radial velocity variations at the 2 epochs.
3.2.2 Survey of emission line profiles
A sample of AA Tau line profiles was presented in Paper II and the new observations show overall the same variety of emission profiles. For all lines except H, we computed residual profiles by subtracting the continuum normalized and veiled spectra of V819 Tau from the continuum normalized spectra of AA Tau. In this process, we used the veiling value measured between 5425 Åto 6660 Å, which exhibits no clear trend with wavelength. The veiling in the H region is probably higher but AA Tau’s veiling is in general small and the photospheric features are reasonably well removed from the H region when we use a single veiling value.
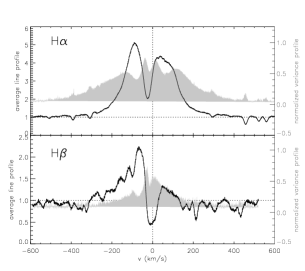
In Figure 8 we show the average H and H profiles as well as their variance (see Johns & Basri 1995). The average H profile and its variance observed during this new campaign are quite similar to those reported for the 1999 campaign (Paper II). This suggests that both the emission line region(s) and the intrinsic source(s) of variability remained the same over the years. The H average profile is reminiscent of the model H profile computed by Kurosawa et al. (2006) which assumes that the line is formed partly in an axisymmetric magnetospheric funnel flow and partly in a slowly accelerating disk wind both seen at a high inclination (see their Fig.A1). The mean H profile, with a triangular blue wing, a central absorption and a secondary peak in the red wing, closely ressembles the Pa profile computed by Kurosawa et al. (2005) as arising from an axisymmetric accretion funnel flow seen at high inclination (cf. their Fig.9). This is consistent with the high inclination viewing angle to AA Tau (75, Paper I). The variance H profile also shares some similarity with variance profiles computed from models in which the accretion flow is confined to azimuthal curtains instead of being axisymmetric (Symington et al. 2005b), specifically a primary peak of variance close to zero velocity and high velocity secondary maxima in the blue and red wings. We note however that the degree of variability observed in the red wing of AA Tau’s H profile is much larger than predicted by azimuthally confined curtain models.
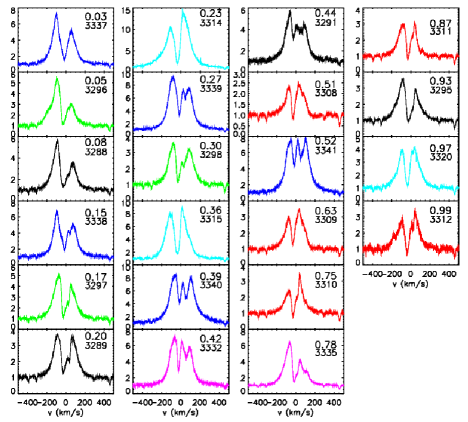
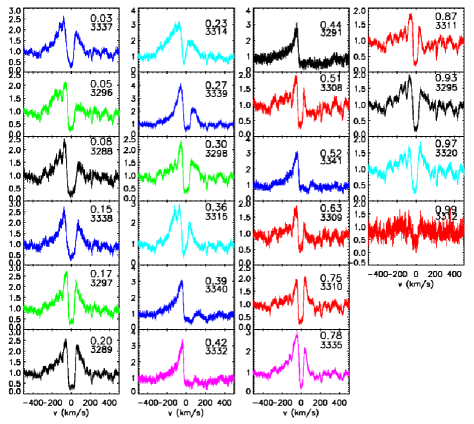
In Figures 9 and 10 we show the H and H emission lines as a function of rotational phase. The deep, blueshifted central absorption is seen at all times, which presumably arises from a cold axisymmetric inner disk wind. The broad emission wings are also always present, which suggests a globally axisymmetric accretion flow onto the star to first order. However, we notice that when a deep minimum occurs in the light curve and the photosphere is obscured by the inner disk warp, a high velocity redshifted absorption component of H is clearly seen, with maximum strength near phase 0.5. This suggests that we are observing downwards along the main accretion funnel flow at this phase. The redshifted absorption by the main accretion stream is even more dramatic in H where the entire red emission is suppressed at phases near the photometric minimum and the redshifted absorption is sometimes observed below the continuum (like JD 3291, 3332, 3340). The cycles that only present a shallow photometric minimum do not show such a pronounced redshifted absorption component in the H lines (e.g. JD 3308). This is consistent with the low veiling and low He I equivalent width values (Fig.4) in that case, all of which indicate that accretion is at a very low level when the obscuring circumstellar material is absent.
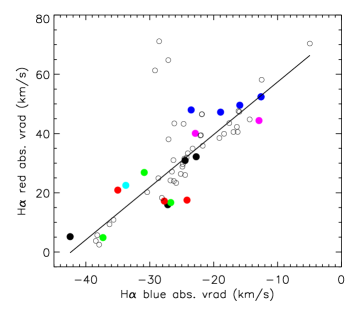
We decomposed the H profile using three Gaussians, corresponding to a centered emission, a blueshifted absorption and a redshifted absorption. The decomposition is not always straightforward (see Fig. 14 of Paper II) but the radial velocities of the three components are well determined by the Gaussian fits. We had noticed in Paper II a tight correlation between the radial velocity of the blueshifted (wind) and redshifted (accretion) absorption components in the H line that we interpreted as being due to the inflation of the stellar magnetosphere, caused by differential rotation between the stellar magnetic field lines and the inner disk. Such a correlation persists in the current data and the new values agree very well with the measurements of Paper II as can be seen in Figure 11.

The He I line presents a narrow emission component (NC) that dominates the profile and half of the time a broad emission component (BC) as well. We then decomposed the He I line using one or two gaussian emissions as shown in Figure 12. The NC is relatively stable kinematically, with radial velocity measurements going from km s-1 to km s-1 and a FWHM varying from 16 km s-1 to 20 km s-1. A periodogram analysis of the radial velocity variations suggests a possible period of 8.00.4 days (FAP=0.30), consistent with the 8.2-day photometric period (cf. Fig. 7). The equivalent width and the line flux of the NC vary considerably in the same period and are well correlated with the veiling variations. According to Beristain et al. (2001) the NC is formed near the accretion shock in the post-shock region, and should strongly correlate with the veiling, as observed in AA Tau. The BC is much more kinematically variable than the NC, with radial velocity values going from km s-1 to km s-1 and FWHM ranging from 30 km s-1 to 40 km s-1. It is most of the time redshifted but was observed blueshifted twice (JD 3314 and 3315, cf. Fig. 12). According to Beristain et al. (2001) the BC could be either formed in the accretion column (if redshifted in excess of 8 km s-1) or in an accretion-driven hot stellar wind (if blueshifted in excess of km s-1). Our results show that a single star can move from the accretion dominated BC (redshifted) to a wind dominated BC (blueshifted) and back in a short period of time (a couple of nights).
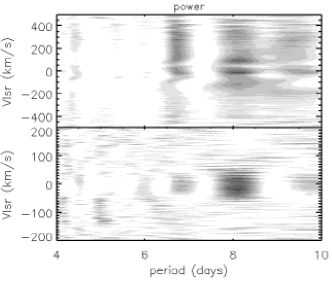
In Figure 13 we show our period search result for the H and He I lines. Periodograms were computed in each velocity channel on the intensity of the deveiled and normalized line profiles. Similar results are obtained from the analysis of veiled profiles. All the main emission lines show periodical intensity variations around 8.0 0.4 days, consistent with the more accurately defined photometric period of 8.2 days. The maximum power in the 2D periodogram of the H (resp. HeI) line occurs at -10 km s-1 (resp. 3 km s-1) and corresponds to a FAP of 0.15 (resp. 0.10). This is the first time we find clear evidence for the emission line flux being modulated with the same period as the stellar flux (see Paper II). Most of the emission lines also show more marginal evidence for periodicities at 6.7 days.
4 Discussion
The new dataset obtained on AA Tau provides new and clear evidence for magnetospheric accretion in this object. We thus discuss in this section the observed variability pattern of the various diagnostics in the framework of the magnetically-channelled accretion concept, starting form the inner disk edge down to the stellar surface. In the following discussion, the origin of rotational phases () is taken as being the epoch of maximum continuum flux in the V-band. This maximum brightness level has proved very stable over at least the last 10 years (see Papers I, II) and likely corresponds to the unobscured photosphere. In addition, the veiling is low at this phase, so that the observed continuum flux is probably close to the star’s photospheric flux (reddened by = 0.8 mag, cf. Paper I).
4.1 Characterizing the magnetospheric accretion/ejection region
As the system rotates with a period of 8.22d, the continuum flux decreases to reach a minimum around . This behaviour had already been reported in previous campaigns, and we argued that the dimming of the system results from the central star being partly occulted by circumstellar material (Papers I, II). A supporting argument comes from the measurement of an increased polarization level during the eclipses (Ménard et al. 2003, see also O’Sullivan et al. 2005). We further argued that the optically thick occulting screen corresponds to the magnetically-warped, dusty inner disk edge. As the periodicity of the eclipses is similar to the rotational period of the star, this locates the inner dust disk edge close to the corotation radius which, assuming keplerian rotation, is .
The new dataset confirms both the periodic nature of the eclipses and their changing amplitude on week timescales (see Paper II). This can be seen in Fig. 2 and 3. Over nearly 170 days, corresponding to more than 20 rotations, the phase of the brightness minimum is conserved. While the depth of most eclipses is of order of 1 mag, we observed shallower eclipses with an amplitude of only a few 0.1 mag during 3 consecutive rotation cycles, located in the middle of the observing campaign (see Fig. 1). We conclude that the shape of the occulting screen can change abrutply on a timescale of days, leading to shallower eclipses for a few rotations, and is thereafter restored with nearly the same structure. A similar behaviour had been reported in Paper II for one rotation.
AA Tau’s new light curve exhibits a hint of an asymmetric shape around the minimum, with a steeper egress than ingress (Fig. 3). At a given brightness level, the system also appears redder during ingress than during egress (Fig. 2). The shape of the eclipse reflects the azimuthal distribution of optically thick dust in the corotating inner disk warp. Such a slight light curve asymmetry, with a shallow decrease and a steep rise, may indicate a correspondingly asymmetric azimuthal distribution of dust at the inner disk edge, as qualitatively predicted by 3D numerical simulations of disk accretion onto an inclined dipole (Romanova et al. 2003).
If the warp of the inner disk edge results from its interaction with the stellar magnetosphere, as argued in Paper I, the dominant accretion funnel flows ought to face the observer close to the middle of the occultation. The analysis of the Balmer line profiles supports this view. Fig. 9 and 10 clearly reveal the development of high velocity redshifted components in the profiles of both lines (also seen in H) from to , i.e., around the center of the eclipse. High velocity redshifted components are expected to be seen when the observer looks downwards the accretion funnel flow against the accretion shock (Hartmann et al. 1994). The line profiles thus indicate that the center of the eclipse also corresponds to the time at which the accretion shock faces the observer. This strongly suggests that the inner disk warp is magnetically-driven indeed (Terquem & Papaloizou 2000, Lai 1999).
The line profiles observed during one of the shallower eclipses (JD 3308, ) exhibit a much shallower redshifted component than the profiles observed at similar phases during deep minima (e.g. JD 3341, , see Fig. 9 and 10). As the veiling was also measured to be weaker during shallow eclipses (see Fig. 4), this suggests that the accretion rate onto the star was smaller at that time. Hence, there seems to be a clear link between the structure of the occulting warp at the inner disk edge and the accretion rate onto the star, both presumably depending on the time variable magnetic configuration at the disk truncation radius. In addition, blueshifted HeI broad emission components were observed only during one of the shallower eclipses (JD 3314, 3315), which suggests that a hot wind develops as accretion is depressed onto the star. Finally, the H line profile reveals transient but significant redshited absorption components at phases opposite to the deep minima (e.g. JD 3295, ). We speculate that these transient absorptions may be related to the viewing of funnel flows against the accretion shock located at the opposite magnetic pole on the stellar surface (, see Fig.10 in Paper I).
The visibility of the hot spot at the stellar surface is measured by the variations of the HeI line flux originating in the accretion shock at the bottom of the accretion funnel (Beristain et al. 2001). The HeI line flux, usually dominated by a narrow component (Fig 12), is modulated with the same 8.2d period as the other diagnostics (Fig. 13) and shows a low level modulation of about a factor of 2, with a maximum around (Fig. 4). The veiling is modulated in the same way and also peaks slightly before the center of the eclipse (Fig. 4). The close temporal coincidence between the maximum intensity of accretion shock diagnostics (), the appearance of high velocity redshifted absorptions in Balmer line profiles (), and the occurence of photometric eclipses () strongly supports the view that material is being preferentially accreted from the warped inner disk edge along magnetic field lines down to the stellar surface.
In addition to the low level modulation, both the HeI line flux and the veiling exhibit intrinsic variations of larger amplitude on a shorter timescale. This is examplified by the 4 highest He I flux values in Fig. 4 and the corresponding measurements of veiling in Fig. 4. These episodes occur during the eclipses (. Whether these are transient episodes on a timescale of a few hours, such as accretion bursts or opacity changes in the occultation screen as previously reported in Paper I, or a slightly varying accretion rate onto the star from one cycle to the next cannot be easily decided from our dataset.
4.2 The origin of periodic radial velocity variations
One puzzling aspect of AA Tau’s behaviour is the periodic radial velocity variations of the photospheric spectrum. We had reported this result in Paper II and offered possible interpretations, such as a planetary mass companion orbiting the star or the presence of a large cold spot at the stellar surface, none of which seemed satisfactory. The new dataset provides additional evidence for the modulation of the radial velocity of the photospheric spectrum with a period of 8.2d and an amplitude of a few km.s-1, similar to what we previously reported (see Fig. 7). The source of radial velocity variations thus appears to be the same at the 2 epochs. The coincidence between the period of the radial velocity variations and the rotational period of the star strongly suggests the former results from spot modulation. Also, the amplitude of the radial velocity variations (3 km s-1) is a fraction of the star’s rotational velocity (=11.3 km s-1), consistent with spot modulation.
The high resolution spectral series obtained during the new campaign supports this view. The extrema of the radial velocity curve occur around rotational phases 0.2-0.3 (maximum) and 0.7-0.8 (minimum), while the star’s rest velocity is measured around phases 0.0 and 0.5, i.e. at maximum and minimum brightness (cf. Fig 7). We argued above from the line profile analysis that the hot accretion shock faces the observer around . Assuming the hot spot is responsible for the modulation of the photospheric line profiles, one would expect to measure the star’s rest velocity when the spot faces the observer () as well as at the opposite phase (), while the largest excursions ought to occur when the hot spot is close to the stellar limb ( and ). This is precisely what the phased radial velocity curve indicates, with +1 km s-1 and -1 km s-1 at 0.25 and 0.75, respectively. In addition, the radial velocity of the HeI narrow component (NC) also appears to be modulated, though with a larger scatter. It varies between +4 km s-1 and +12 km s-1 around and , respectively, i.e. with a phase opposite to that of the photospheric radial velocity variations, as expected from hot spot modulation. The time averaged velocity of the HeI line NC ( 8 km s-1) presumably reflects the postshock velocity at the magnetospheric footpoint on the stellar surface (Beristain et al. 2001).
Fig 7 also shows that a few measurements strongly depart from the low level periodic variations. These measurements where obtained during photometric minima (; JD 3340, 3332, 3291) at a time when the veiling was also the highest. The corresponding correlation profiles (CCFs) are extremely asymmetric (cf. Fig. 6) and such asymmetries may conceivably alter the accuracy of the measurements. CCFs obtained outside theses phases show some level of asymmetry as well, but usually not as pronounced, as expected from the modulation by a hot surface spot (e.g. Petrov et al. 2001). The largest CCF asymmetries observed during the deep photometric minima suggest that the extreme excursions are related to the partial occultation of the central star by the asymmetric inner disk warp, and are superimposed onto the lower level modulation by the hot spot. Note that only few measurements strongly depart from the hot spot modulation, which suggests that the azimuthal structure of the inner disk warp occulting the star is relatively smooth, as also suggested by the shape of the photometric eclipses.
Hence, the modulation of the photospheric radial velocity in AA Tau’s most likely results from an inhomogeneous brightness distribution on the stellar surface. Its phase is consistent both with the visibility of the hot accretion spot derived above from veiling and HeI flux measurements, and with the HeI line radial velocity variations. For a hot spot occupying a few percent of the stellar photosphere, the radial velocity amplitude of the HeI line is related to the latitude of the accretion shock at the stellar surface by : . With km s-1 and km s-1, we derive . The solid line in Fig 7 shows the expected HeI radial velocity variations from a model featuring a small hot spot located at a latitude of 70. The model curve fits reasonably well the observed HeI radial velocity variations, at least when deep eclipses are seen in the light curve. As the accretion shock is thought to occur at the feet of the funnel flows on the stellar surface close to the magnetic pole, we deduce that the axis of the large scale magnetosphere is tilted relative to the star’s spin axis by about 20. This is consistent with the 12 tilt derived by Valenti & Johns-Krull (2004) from spectropolarimetric measurements, assuming a stellar inclination of 66. Note that the radial velocity of the HeI line is modulated around a mean value of 8 km s-1, the putative post-shock velocity, and not around the photospheric velocity, as would be expected for a small single hot spot. This suggests a more complex structure for the accretion shock, such as a circumpolar ring around the magnetic axis (Mahdavi & Kenyon 1998, Romanova et al. 2004).
The observed periodic radial velocity variations of absorption and emission lines can thus be, at least partly, accounted for by the presence of a hot spot at the stellar surface. Whether a hot spot alone fully accounts for the radial velocity curve of the photospheric spectrum is however unlikely. Firstly, we note that the amplitude of the variations is about the same in 1999 and in 2003 (cf. Fig. 7) while the veiling was significantly higher at the latter epoch. If hots spot were responsible for the radial velocity excursions, one might expect the amplitude of the curve to increase with the spots brightness, which is not seen here. Secondly, the line shape distorsion caused by a hot continuum spot is the same as that procuded by a cold spot (e.g. Johns-Krull & Hatzes 1997). In Paper II, we found that a cool spot would have to cover about 50% of the stellar surface to produce the observed variations. This is much larger than the expected size of AA Tau’s accretion spots, of order of a few percent (Paper I). Hence, it is unlikely that a hot spot alone can account for the observed amplitude. Additional sources of variations are probably required, such as the occulting effect of the warp inner disk and/or large cold spots clustered around the hot accretion spot at the stellar surface. We also note that similar radial velocity variations were found in the more active CTTS RW Aur and interpreted as resulting from the modulation by large chromospheric spots (Petrov et al. 2001). Detailed Doppler Imaging of the star would be needed to address this issue. Note however that these additional components do not affect the conclusion regarding the radial velocity variations of the HeI NC, which more directly traces the accretion hot spot on the stellar surface.

A final indication that the Vrad modulation primarily results from stellar spots is provided by the analysis of the line profile shape and its deformation as a function of rotational phase. Following the method outlined by Queloz et al. (2001), we computed the bissector of the photospheric cross-correlation function (CCF) at each phase (cf. Fig. 6). The bissector slope is seen to vary as a function of phase. The average slope is computed as the velocity difference between the upper and lower regions of the bissector, -, where (resp. ) is the median velocity of the bissector in the intensity range 0.93-0.98 (resp. 0.80-0.85). The bissector slope is plotted as a function of the measured Vrad in Fig. 14. A clear inverse correlation is seen between the bissector slope and , as expected for spot-induced variations (Queloz et al. 2001). In contrast, no such correlation would exist if the periodic variations were due to stellar oscillations or to the reflex motion of the star in response to an orbiting body (Dall et al. 2006). A few measurements strongly depart from the observed correlation, as already noticed above for measurements (cf. Fig. 7), and may indicate the additional effect of the inner disk warp partly occulting the stellar photosphere at times of deep photometric minima.
4.3 Non steady accretion on a week timescale
On a timescale longer than the star’s rotational period, we confirm the correlation we reported in Paper II between the radial velocity of the blueshifted (wind) and redshifted (accretion) absorption components of the H profile (see Fig. 11). In Paper II, we interpreted this correlation as “magnetospheric inflation cycles”. Following dynamical models of magnetic star-disk interaction (e.g. Goodson & Winglee 1999) accretion from the inner disk onto the star leads to the inflation of the magnetic funnel flows due to differential rotation between the inner disk edge and the stellar surface. Past some critical point, the field lines open and reconnect, then reducing the accretion flow onto the star and simultaneously leading to enhanced wind outflow. After field lines have reconnected, the initial magnetic dipolar configuration is restored and a new cycle starts. We argued in Paper II that the projected radial velocity of the redshifted absorption components of the H line measure the curvature of the accretion funnel flow : as the magnetosphere inflates, the projected radial velocity of the redshifted component decreases (see Fig.19 in Paper II). If the collimated wind originates at or close to the disk inner edge, the projected radial velocity of the blueshifted absorption component simultaneously increases, thus yielding the observed correlation. Note that this simple geometric interpretation favors inner disk winds (e.g. Alencar et al. 2005) over accretion driven stellar winds (e.g. Matt & Pudritz 2005).
The results of the new campaign tend to confirm this interpretation. Just before and during the episode of shallow eclipses and depressed accretion onto the star (JD 3305-3330), the projected radial velocity of the accretion flow is small (from +5 to +30 km s-1) and that of the inner disk wind is large (from -45 to -25 km s-1 ). According to the above interpretation, this would correspond to a phase of field line inflation and opening. The lower accretion rate onto the star is also accompanied by the development of a hot wind outflow as traced by the appearence of a broad blueshifted component in the HeI profile. Just after this episode, as deep eclipses and enhanced accretion resume, the projected radial velocity of the accretion flow is larger (from +40 to +50 km s-1) and that of the inner disk wind is smaller (from -25 to -10 km s-1), as expected if the initial dipolar magnetospheric configuration has been restored at this point. The observed timescale for the disappearance and restoration of deep eclipses is of order of a week (see Fig. 1). The dissipation timescale of the inner disk warp through bending waves, , in response to the disturbance of the underlying magnetic configuration, is given by , where is the disk truncation radius, is the local sound speed, the keplerian velocity, and the warp thickness (Terquem, priv. comm.). At a distance R⋆ and for a warp vertical thickness (cf. Paper I), this yields 4 days, which is consistent with the observations.
The variations of the accretion and outflow diagnostics on a timescale of several rotation periods in AA Tau can thus be consistently understood as resulting from episodes of strong accretion onto the star together with reduced or absent hot wind (whenever the dipolar magnetosphere allows the disk material to fall onto the star) alternating with episodes of reduced accretion and enhanced hot wind possibly driven by magnetic reconnections (when the magnetosphere inflates due to differential rotation), with the whole process occurring on a timescale of a few weeks. In addition, the stability of the deep central absorption in the Balmer line profile suggests that a cold inner disk wind is always present. These results tend to support the concept of magnetospheric inflation cycles on a timescale of several rotation periods in accreting T Tauri stars, although the periodic character of such cycles as predicted by dynamical models remains to be established from longer time series.

4.4 AA Tau’s long term photometric behaviour
Finally, Fig. 15 offers a long term view of AA Tau’s photometric behaviour, as recorded in the last 10 years. The shape and depth of the eclipses do vary on a timescale of weeks within each observing season, and small phase changes (up to 0.1-0.2) occur as well on this time scale. Nevertheless, the overall pattern of photometric variability remains globally stable within each season over a timescale of several months (Fig. 3). Fig. 15 indicates that the long term (years) evolution of the inner disk structure can be more drastic. The set of light curves obtained at different epochs (1995, 1999, 2003, 2004) exhibit quite different patterns. In 1995, a broad and deep eclipse was seen per rotation. In 1999, 2 shallower eclipses were observed per cycle. The 2003 light curve exhibits a clear primary eclipse, whose amplitude varies, and may still bear evidence for a shallow secondary eclipse. The 2004 light curve reported here displays only one eclipse per cycle, broader and shallower than observed in 1995. The changing pattern of the eclipses over the years reflects the varying structure of the inner disk warp occulting the star. This suggests that the large scale component of the stellar magnetic field interacting with the inner disk and producing the warp can significantly vary over the years.
5 Conclusions
We have analyzed a long time series of high resolution spectra and simultaneous photometry obtained for the accreting T Tauri star AA Tau. The photometric diagnostics provide clues to the structure of the dusty inner disk edge interacting with the star’s magnetosphere while various spectral diagnostics probe the accretion funnel flows onto the star as well as the accretion shock at the stellar surface. To first order, the observed variability of these diagnostics on a timescale ranging from days to months supports the view of time-dependent, magnetically-controlled accretion from the inner disk edge onto the star.
The stellar magnetosphere disrupts the inner disk at the corotation radius, located about 9R⋆ above the photosphere. At the disk truncation radius, material is lifted away from the disk plane by the inclined stellar magnetosphere which results in an asymmetric dusty warp at the disk inner edge. The inner disk warp corotates with the star and partly occults the stellar photosphere periodically (P=8.22d), yielding the deep and broad periodic eclipses observed in the light curve. As the star is periodically occulted, accretion diagnostics are the strongest (veiling, HeI flux), which indicates that the accretion shock at the stellar surface is located at the same rotational phase as the inner disk warp. High velocity redshifted absorption components also appear in the Balmer line profiles at this rotational phase, being formed in the main accretion flow which connects the inner disk to the accretion shock. Hence, from the temporal coincidence of various photospheric and spectral diagnostics, we are able to demonstrate for the first time the spatial continuity between the inner disk warp, the main accretion funnel flow, and the accretion shock at the stellar surface, as qualitatively expected from models in which accretion from the inner disk onto the star is mediated by a large-scale inclined magnetosphere. The line variability is thus modulated by the corotation of the asymmetric magnetospheric funnel flow onto the star. Nevertheless, some components of the emission line profiles remains fairly stable, which suggests that the degree of asymmetry of the magnetospheric structure and of the inner disk wind is moderate. By modelling the radial velocity variations of the star and of the accretion shock, we derive an inclination of 20 between the axis of the large scale magnetosphere and the stellar rotational axis.
On a timescale of several rotation periods, we also find that the accretion rate onto the star varies, with episodes of strong accretion and reduced hot wind alternating with episodes of weaker accretion and stronger hot wind. As accretion onto the star weakens, the depth of the photometric eclipses is also significantly reduced. This is readily explained by the fact that the accretion flow onto the star and the disk inner warp are both driven by the underlying magnetic structure interacting with the disk. In other words, time-variable eclipses and accretion rate onto the star both reflect temporal variations in the topology of the magnetic field lines which connect the star to the inner disk. We find that the observed variability of accretion and wind diagnostics in the Balmer and HeI line profiles on a timescale of weeks is consistent with “magnetospheric inflation”, i.e., field line expansion resulting from differential rotation between the inner disk and the stellar surface. As the magnetic field lines inflate and eventually become open, the amount of disk material that can be loaded into closed field lines decreases, thus reducing the accretion rate onto the star, while more material can be driven away along open field lines, thus leading to an enhanced hot wind, possibly driven by magnetic reconnections close to the star. In addition, evidence for a cold inner disk wind is seen at all times. The timescale for the development of magnetospheric inflation is several (typically 5-10) rotational periods.
Finally, the comparison of AA Tau’s light curves obtained over a timescale of 10 years, between 1995 and 2004, indicates that, even though periodic eclipses are seen at all epochs on a rotational timescale, their shape and depth drastically varies on a timescale of years. This indicates that, in addition to transient perturbations of the magnetospheric structure occuring on a timescale of weeks (“magnetospheric inflation”), the overall magnetospheric structure does change quite substantially over the years. This large-scale changes may conceivably be related to long term variations in the disk accretion rate or be intrinsic to the stellar magnetic field such as, e.g., magnetic cycles.
Acknowledgements.
We thank A. Pal, J. Benko, S. Csizmadia, Z. Kiss, A. Kospal, M. Racz, K. Sarneczky, and R. Szabo who took part in the observations obtained at Konkoly Observatory. We thank the referee, C. Johns-Krull, for insightful comments on the manuscript. SHPA acknowledges support from CNPq (grant 201228/2004-1), Fapemig and LAOG. Z. Balog received support from Hungarian OTKA Grants TS049872, T042509 and T049082.References
- (1) Akeson, R. L., Boden, A. F., Monnier, J. D., et al. 2005, ApJ, 635, 1173
- (2) Alencar, S. H. P., Basri, G., Hartmann, L., & Calvet, N. 2005, A&A, 440, 595
- Bacciotti et al. (2002) Bacciotti, F., Ray, T. P., Mundt, R., Eislöffel, J., & Solf, J. 2002, ApJ, 576, 222
- (4) Beristain, G., Edwards, S., & Kwan, J. 2001, ApJ, 551, 1037
- (5) Basri, G., & Bertout, C. 1989, ApJ, 341, 340
- (6) Bouvier, J., Chelli, A., Allain, S., et al. 1999, A&A, 349, 619 (Paper I)
- (7) Bouvier, J., Grankin, K. N., Alencar, S. H. P., et al. 2003, A&A, 409, 169 (Paper II)
- Bouvier et al. (2006) Bouvier, J., Alencar, S., Harries, T. J., Johns-Krull, C. M., Romanova, M. M. 2006, Protostars and Planets V, in press
- Dall et al. (2006) Dall, T. H., Santos, N. C., Arentoft, T., Bedding, T. R., & Kjeldsen, H. 2006, A&A, 454, 341
- Dougados et al. (2000) Dougados, C., Cabrit, S., Lavalley, C., & Ménard, F. 2000, A&A, 357, L61
- Dupree et al. (2005) Dupree, A. K., Brickhouse, N. S., Smith, G. H., & Strader, J. 2005, ApJ, 625, L131
- Dworetsky (1983) Dworetsky, M. M. 1983, MNRAS, 203, 917
- (13) Edwards, S., Fischer, W., Kwan, J., Hillenbrand, L., & Dupree A. K. 2003, ApJ, 599, L41
- Goodson & Winglee (1999) Goodson, A. P. & Winglee, R. M. 1999, ApJ, 524, 159
- Hartmann, Hewett, & Calvet (1994) Hartmann, L., Hewett, R., & Calvet, N. 1994, ApJ, 426, 669
- Hartigan, Edwards, & Ghandour (1995) Hartigan, P., Edwards, S., & Ghandour, L. 1995, ApJ, 452, 736
- Hartigan et al. (1989) Hartigan, P., Hartmann, L., Kenyon, S., Hewett, R., & Stauffer, J. 1989, ApJS, 70, 899
- Herbst et al. (2002) Herbst, W., Bailer-Jones, C. A. L., Mundt, R., Meisenheimer, K., & Wackermann, R. 2002, A&A, 396, 513
- Horne & Baliunas (1986) Horne, J. H., & Baliunas, S. L. 1986, ApJ, 302, 757
- Johns & Basri (1995) Johns, C. M., & Basri, G. 1995, AJ, 109, 2800
- Johns-Krull (1997) Johns-Krull, C. M., & Hatzes, A. P. 1997, ApJ 487, 896
- Johns-Krull et al. (2004) Johns-Krull, C. M., Valenti, J. A., & Saar, S. H. 2004, ApJ, 617, 1204
- Johns-Krull et al. (1999) Johns-Krull, C. M., Valenti, J. A., Hatzes, A. P., & Kanaan, A. 1999, ApJ, 510, L41
- Koenigl (1991) Koenigl, A. 1991, ApJ, 370, L39
- Kurosawa et al. (2005) Kurosawa, R., Harries, T. J., & Symington, N. H. 2005, MNRAS, 358, 671
- Kurosawa et al. (2006) Kurosawa, R., Harries, T. J., & Symington, N. H. 2006, MNRAS, in press
- Lai (1999) Lai, D. 1999, ApJ, 524, 1030
- Mahdavi & Kenyon (1998) Mahdavi, A., & Kenyon, S. J. 1998, ApJ, 497, 342
- (29) Matt, S., & Pudritz, R. E. 2005, ApJ, 632, L135
- (30) Mayor, M., Pepe, F., Queloz, D., et al. 2003, ESO Messenger, 114, 20
- Ménard & Bertout (1999) Ménard, F. & Bertout, C. 1999, NATO ASIC Proc. 540: The Origin of Stars and Planetary Systems, 341
- Ménard et al. (2003) Ménard, F., Bouvier, J., Dougados, C., Melnikov, S.Y., & Grankin, K. 2003, A&A, 409, 163
- O’Sullivan et al. (2005) O’Sullivan, M., Truss, M., Walker, C., et al. 2005, MNRAS, 358, 632
- Petrov et al. (2001) Petrov, P. P., Gahm, G. F., Gameiro, J. F., et al. 2001, A&A, 369, 993
- Pojmanski et al. (2005) Pojmanski, G., Pilecki, B., & Szczygiel, D. 2005, Acta Astronomica, 55, 275
- Queloz et al. (2001) Queloz, D., et al. 2001, A&A, 379, 279
- Roberts et al. (1987) Roberts, D. H., Lehar, J., & Dreher, J. W. 1987, AJ, 93, 968
- Romanova, Ustyugova, Koldoba, Lovelace (2002) Romanova, M. M., Ustyugova, G. V., Koldoba, A. V., & Lovelace, R. V. E. 2002, ApJ, 578, 420
- (39) Romanova, M. M., Ustyugova, G. V., Koldoba, A. V., Wick, J. V., & Lovelace, R. V. E. 2003, ApJ, 595, 1009
- (40) Romanova, M. M., Ustyugova, G. V., Koldoba, A. V., & Lovelace, R. V. E. 2004, ApJ, 610, 920
- Shang et al. (2002) Shang, H., Glassgold, A. E., Shu, F. H., & Lizano, S. 2002, ApJ, 564, 853
- Shevchenko et al. (1991) Shevchenko, V. S., Grankin, K. N., Ibragimov, M. A. 1991, Informational Bulletin on Variable Stars, 3652, 1
- Symington et al. (2005) Symington, N. H., Harries, T. J., & Kurosawa, R. 2005b, MNRAS, 356, 1489
- Symington et al. (2005) Symington, N. H., Harries, T. J., Kurosawa, R., & Naylor, T. 2005a, MNRAS, 358, 977
- Terquem & Papaloizou (2000) Terquem, C. & Papaloizou, J. C. B. 2000, A&A, 360, 1031
- Valenti & Johns-Krull (2004) Valenti, J. A., & Johns-Krull, C. M. 2004, Ap&SS, 292, 619
- Vrba et al. (1989) Vrba, F. J., Rydgren, A. E., Chugainov, P. F., Shakovskaia, N. I., & Weaver, W. B. 1989, AJ, 97, 483