The Chemical Distribution in a Subluminous Type Ia Supernova:
HST Images of the SN 1885 Remnant11affiliation: Based on observations with the NASA/ESA Hubble Space Telescope,
obtained at the Space Telescope Science Institute,
which is operated by the Association of Universities for Research in
Astronomy, Inc. under NASA contract No. NAS5-26555.
Abstract
SN 1885 was a probable subluminous Type Ia supernova which occurred in the bulge of the Andromeda galaxy, M31, at a projected location 16′′ from the nucleus. Here we present and analyze Hubble Space Telescope images of the SN 1885 remnant seen in absorption against the M31 bulge via the resonance lines of Ca I, Ca II, Fe I, and Fe II. Viewed in Ca II H & K line absorption, the remnant appears as a nearly black circular spot with an outermost angular radius of , implying a maximum linear radius of pc at M31’s estimated distance of kpc and hence a 120 yr average expansion velocity of . The strongest Ca II absorption is organized in a broken ring structure with a radius of (= km s-1) with several apparent absorption ‘clumps’ of an angular size around that of the image pixel scale of (= 1500 km s-1). Ca I and Fe I absorption structures appear similar except for a small Fe I absorption peak displaced off-center of the Ca II structure by a projected velocity of about km s-1.
Analyses of these images using off-center, delayed-detonation models suggest a low 56Ni production similar to the subluminous SN Ia explosion of SN 1986G. The strongly lopsided images of of Ca I and Fe I can be understood as resulting from an aspherical chemical distribution, with the best agreement found using an off-center model viewed from an inclination of 60∘. The detection of small scale Ca II clumps is the first direct evidence for some instabilities and the existence of a deflagration phase in SNe Ia or, alternatively, mixing induced by radioactive decay of 56Ni over time scales of seconds or days. However, the degree of mixing allowed by the observed images is much smaller than current 3D calculations for Rayleigh-Taylor dominated deflagration fronts. Moreover, the images require a central region of no or little Ca but iron group elements indicative for burning under sufficiently high densities for electron capture taking place, i.e., burning prior to a significant pre-expansion of the WD. Using time-dependent ionization calculations, we show that the presence today of neutral ions in this 120 yr old remnant can be understood as ejecta self-shielding from the UV radiation in the M31 bulge.
1 Introduction
The ‘bright nova’ S Andromedae (S And) was discovered in the central bulge of M31 (NGC 224) during late August of 1885. It is believed to have been a Type Ia supernova (SN Ia) on the basis of an apparent absence of hydrogen Balmer lines (Gaposchkin, 1936; Minkowski, 1939) and a close match of nearly all reported spectral features to those of SNe Ia (de Vaucouleurs & Corwin, 1985). However relative to normal SN Ia events, SN 1885 was subluminous with an unusually rapid initial decline and a somewhat redder color (de Vaucouleurs & Corwin, 1985; Patchett et al., 1985; Graham, 1988; Chevalier & Plait, 1988; van den Bergh, 1994). A recent analysis of SN 1885 observations by van den Bergh (2002) suggests a decline rate of mag and a maximum brightness of and , assuming a M31 distance modulus of ()0 = 24.4 corresponding to a distance of 760 kpc.
The remnant of SN 1885 remained undetected for over a century despite numerous searches in the optical and radio (Baade, 1946; Kraus & Dixon, 1965; de Bruyn, 1973; Spencer & Burke, 1973; Dickel & Dodorico, 1984; Middleditch & Kristian, 1984; de Vaucouleurs & Corwin, 1985; Boulesteix et al., 1987; Crane et al., 1992; Eck et al., 2002). The remnant was finally detected in 1989, not through its emission, but as a small dark spot of absorption in the M31 bulge on an image taken using a near-UV filter (3900 100 Å) sensitive to Ca II H & K resonance line absorption (Fesen et al., 1989). Although Sjouwerman & Dickel (2001) report a possible weak radio detection at 8.4 GHz, SN 1885 continues to be essentially unobservable via emission, with recent deep Chandra X-ray imaging of the M31 bulge showing no associated X-ray source at its position (Kaaret, 2002).
Following its ground-based detection, optical and UV imaging and spectra of the SN 1885 remnant (hereafter referred to as “SNR 1885”) with instruments aboard the Hubble Space Telescope (HST) revealed a diameter absorption patch produced principally by Ca expanding at velocities up to 13,000 km s-1 (Fesen et al., 1999). The observed low flux at the Ca II H & K blended line center indicated a foreground starlight fraction of around 0.20, placing SNR 1885 some 65 pc to the near side of the M31 bulge midpoint, comparable to its projected 55 pc (= ) distance from the M31 nucleus.
Other absorption lines detected in SNR 1885 included Ca I 4227, Fe I 3441, and Fe I 3720. A weak imaging detection of the remnant with the HST Wide-Field Planetary Camera-2 (WFPC2) in the wavelength range 2200 Å to 3000 Å, which is rich in strong Fe II lines, suggested a depth of absorption consistent with Fe II being fully saturated and an iron mass of (Hamilton & Fesen, 2000).
The fortuitous positioning of a relatively young and nearly freely expanding SN Ia remnant silhouetted against M31’s bright central bulge offers an unique opportunity to map the distributions of Ca and Fe rich debris in a SN Ia. In this paper, we present images of SNR 1885 taken with the Advanced Camera for Surveys (ACS) on HST at a significantly higher angular resolution and signal-to-noise-ratio than previous images. The ACS images show a sufficiently well-resolved remnant to distinguish between various proposed SN Ia explosion scenarios. The observations, image results, our modeling results, future observations, and conclusions are given in , respectively.
2 Observations
High-resolution optical and ultraviolet images of SNR 1885, detected via resonance line absorptions of M31 bulge starlight, were obtained between 2004 August and November using the Advanced Camera for Surveys (ACS; Ford et al. 1998; Pavlovsky et al. 2004) aboard HST. ACS has two main imaging configurations and both were used. The ACS Wide Field Channel (WFC) consists of two CCDs providing a field of view with an average pixel size of , while the ACS High Resolution Channel (HRC) consists of a single CCD providing a spatial resolution of per pixel and a nominal field of view.
The ACS/WFC was used in combination with narrow passband ‘ramp’ filters to image SNR 1885 in three separate wavelength ranges. These were the resonance absorption line of Ca I 4226.73 Å, the Ca II H & K doublet at 3933.66 Å and 3968.47 Å, and a continuum band free of strong remnant absorption lines centered at 4600 Å. Default ACS/WFC and ACS/HRC dither ‘box’ patterns were used which are 4-point parallelogram patterns with relative pixel coordinates (0, 0), (5.0, 1.5), (2.5, 4.5), (-2.5, 3.0), thus having both integer and sub-pixel shifts.
A Ca I image of SNR 1885 was taken with the 2% ramp filter FR423N centered at 4227 Å, resulting in an effective bandpass of 75 Å FWHM and a peak filter transmission of about 60%. Eight 1120 s exposures were taken during four HST orbits on 2004 November 2 in a four-point dither pattern for a total exposure time of 8960 s.
A Ca II H & K absorption image of SNR 1885 was obtained with the ACS/WFC 2% ramp filter FR388N centered at a wavelength 3950 Å, chosen to match the center of the remnant’s broad Ca II absorption line profile as observed in the HST Faint Object Spectrograph (FOS) spectrum (Fesen et al., 1999). At this wavelength, the filter’s bandpass is 100 Å FWHM with a peak transmission of about 50%. Images were taken on 2004 November 8 with a dithering pattern and exposure times identical to those of the Ca I images.
A continuum ACS/WFC image was also taken to allow for correcting small-scale variations in the distribution of background and foreground starlight from the M31 bulge at the position of SNR 1885. The continuum image was taken with the 9% ramp filter FR459M centered at a wavelength 4600 Å, giving a bandpass of about 350 Å FWHM and a peak transmission of nearly 80%. The spectral region is adjacent to the Ca I and Ca II lines but free of any strong line absorption. Due to to the filter’s wide bandpass and the increasing luminosity of M31 bulge stars to longer wavelengths, a relatively short exposure was adequate and dithered images were taken during just two orbits on 2004 August 25 for a total exposure time of 4666 s.
For obtaining UV Fe I and Fe II images, we used the available broadband filters on the higher resolution ACS/HRC. For the Fe Iimage, we selected the F330W filter, which peaks at 3300 Å and extends over 2975–3700 Å. The filter catches the Fe I resonances lines at 3021 Å, 3441 Å, and 3720 Å (Morton, 1991), but most of its coverage is line-free continuum. Consequently, the filter provided only a weak detection of Fe I. Indeed, we used the Fe I image in part as a background continuum image to help correct the Ca I and Ca II images (§§3.1, 3.2). Dithered F330W images were taken over three orbits on 2004 October 13 for a total exposure time of 7800 s.
For the Fe II image, we selected the F250W filter, which peaks in transmission at 2500 Å but has a broad transmission passband extending over Å. The filter encompasses the Fe II resonance lines at 2343 Å, 2373 Å, 2382 Å, 2586 Å and 2599 Å, but it also includes Fe I lines at 2524 Å and 3021 Å, the Mg I line at 2852 Å, and the Mg II doublet at 2796 Å and 2803 Å, all of which are predicted to have significant optical depths (Fesen et al., 1999). Dithered F250W images were taken over 6 orbits on 2004 November 20 for a total exposure of 15,600 s.
Standard ACS pipeline IRAF/STSDAS111 IRAF is distributed by the National Optical Astronomy Observatories, which is operated by the Association of Universities for Research in Astronomy, Inc. (AURA) under cooperative agreement with the National Science Foundation. The Space Telescope Science Data Analysis System (STSDAS) is distributed by the Space Telescope Science Institute. data reduction was done, including debiasing, flat-fielding, geometric distortion corrections, photometric calibrations, and cosmic ray and hot pixel removal. The STSDAS drizzle task was used to combine exposures in each filter.
3 Image Results
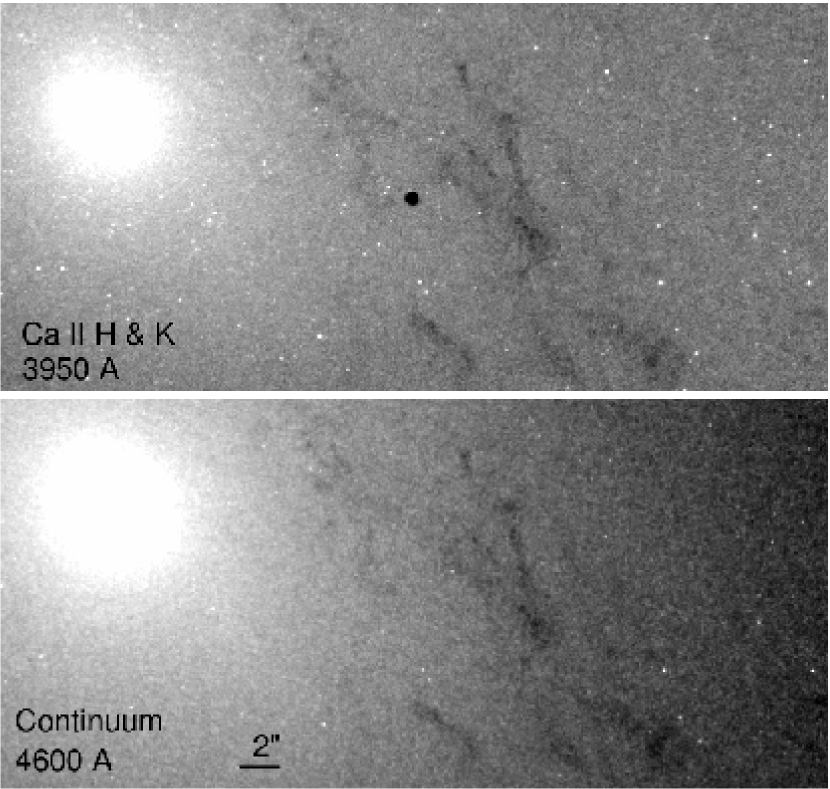
Figure 1 shows a log scaled intensity view of SNR 1885 and its local environs within the bulge of M31. The Ca II H & K image (upper panel) reveals the remnant of SN 1885 as a dark and circular spot at the historically reported location of SN 1885. The coordinates for the center of the remnant are: , .
In contrast to the Ca II image, the offband 4600 Å FR459M continuum image (Fig. 1, lower panel) shows no appreciable absorption at the position of SNR 1885. Because SN 1885’s projected location is uncontaminated by the dust lanes that thread the M31 bulge, the lack of appreciable absorption seen in the 4600 Å image at the position of SNR 1885 suggests little internal dust formed in this SN Ia’s metal-rich ejecta.
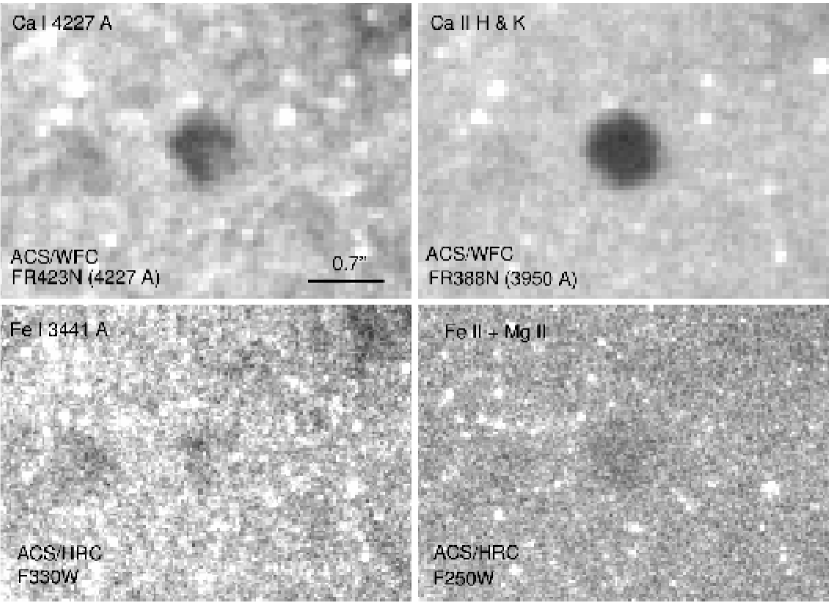
Figure 2 shows all four of the individual absorption images of SNR 1885: Ca I 4227 (upper left), Ca II H & K 3934,3968 (upper right), Fe I 3441,3720 (lower left), and Fe II 2358,2599 plus Mg II 2800 (lower right). The images shown here are in their native spatial pixel scales (ACS/WFC: ; ACS/HRC: ) and are raw in the sense that they have not been corrected for any background variations in the surface brightness of the M31 bulge.
The surface brightness of starlight from the bulge of M31 has both a large scale gradient and smaller scale fluctuations. To correct the Ca I and Ca II absorption images of SNR 1885 for these non-uniformities, we used combinations of the offband 4600 Å continuum image and the ‘Fe I’ F330W filter image, in the ratio 4:1 and 3:1, respectively for the Ca I and Ca II images. As noted above in 2, the F330W filter is broad and, although it encompasses a number of Fe I resonance lines, it mostly covers unabsorbed continuum. We judged it better to use a background constructed from continuum both longward (4600 Å) and shortward (F330W) of the Ca I and Ca II lines, and to accept the mild contamination from Fe I absorption in the F330W continuum, than to use the 4600 Å image alone. Because the ACS/HRC F330W image has a native image scale of per pixel, we first resampled the ACS/WFC Ca I, Ca II, and 4600 Å images to per pixel using the IRAF image interpolation task magnify, before applying the background correction.
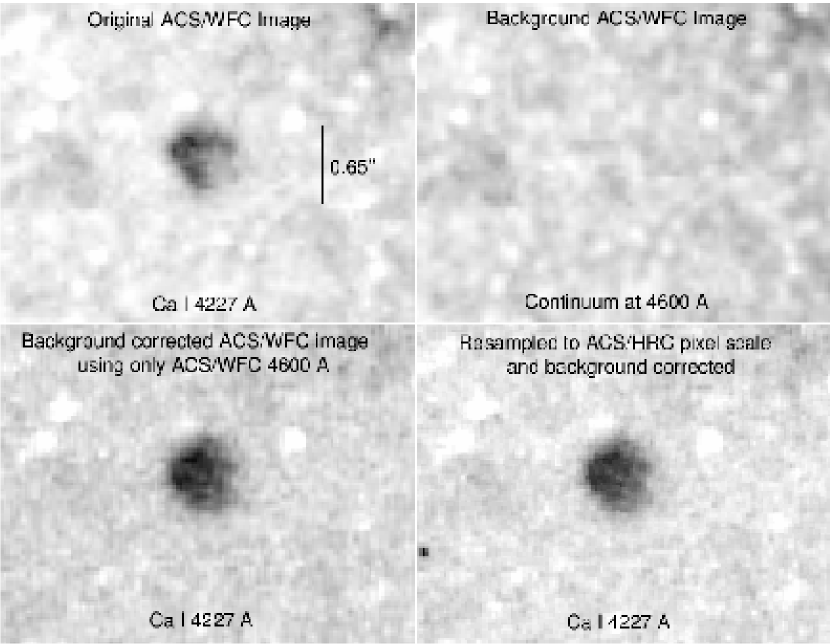
Figures 3 and 4 show in close-up the resampled, background-corrected images of SNR 1885 in Ca I and Ca II absorption, along with the original, uncorrected images. We discuss these images in more detail below in §§3.1 and 3.2.
The distance to M31 is estimated to be between 760 and 790 kpc based on studies of M31 Cepheid and RR Lyrae variables, globular clusters, and stars at the tip of the red giant branch (Freedman & Madore 1990; Stanek & Garnavich 1998; Joshi et al. 2003; Brown et al. 2004; Rich et al. 2005; McConnachie et al. 2005 and references therein). In the discussions below, we have adopted a distance of kpc to M31 and the SNR 1885.
3.1 Ca I
Figure 3 shows the Ca I and 4600 Å continuum images of SNR 1885 resampled to per pixel. It also shows two slightly different background-corrected versions of the Ca I image. Like that seen in the raw Ca I image presented in Figure 2, the uncorrected but resampled Ca I absorption image has a markedly lopsided ‘C’ shaped appearance with the strongest absorption oriented approximately in the direction of the nucleus of M31 toward the northeast. The remnant’s overall diameter in this image is roughly corresponding to a linear diameter of 2.5 pc at a distance of 785 kpc.
The two background-corrected Ca I images shown in Figure 3 are still noticeably lopsided, though much less so, and both appear more complete in the sense of showing a greater degree of absorption near the center and along the western limb. In the first background-corrected version (Fig. 3, lower left), we used only the 4600 Å continuum image to remove bulge starlight variations, while for the second version (Fig. 3, lower right) which we regard as being better, we used a combination of 4600 Å and F330W images for the background in the ratio 4:1, respectively. One can see that the bulge non-uniformities are significantly decreased in both corrected images. Moreover, the good agreement between the two background-corrected Ca I images indicates that the mild contamination from Fe I absorption in the F330W image does not have a substantial effect.
While our use of adjacent continuum images should largely remove small scale structures attributable to variations in the background starlight, we cannot entirely remove M31 bulge light variations because some 25% of the bulge starlight lies foreground to SNR 1885 (see §3.2 below). Nonetheless, the deepest levels of Ca I absorptions appear along the remnant’s eastern and northern limbs.
3.2 Ca II
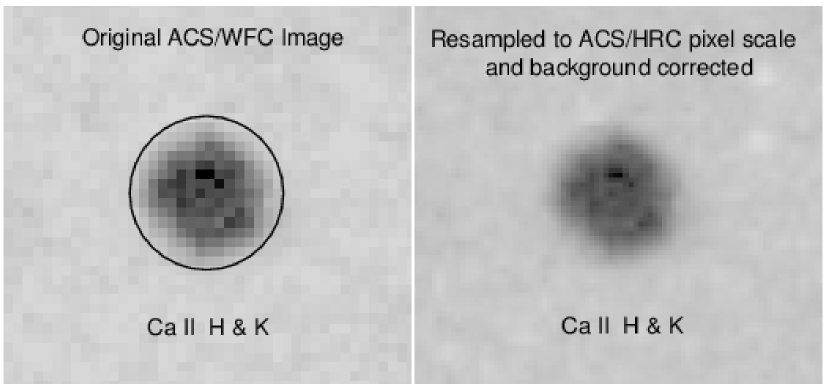
In the HST ACS images, SNR 1885 is most prominently visible through Ca II H & K line absorption. Figure 4 shows the ACS/WFC Ca II image both in its original pixel scale format and then after resampling to per pixel plus background corrected using the 4600 Å and F330W images combined in the ratio 3:1. The intensity toward the center of the uncorrected Ca II image falls to about 30% of the background intensity of starlight, making SNR 1885 the darkest feature in the inner M31 bulge at 3950 Å.
Both original and background corrected images indicate the likely presence for a few Ca II absorption ‘clumps’ having an angular size around that of the ACS/WFC image resolution (), pc at a distance of 785 kpc. This scale suggests a span in velocity for such clumps of around km s-1. The most prominent Ca II absorption clump is about 25% darker than its surroundings and lies some due north of the remnant’s Ca II absorption center. While some of the small-scale absorption structures seen in the Ca II image are likely due to variations in both the corrected bulge starlight background and in the starlight lying in front of the remnant, the strength and non-randomness of the darkest Ca II features suggests the existence of a broken ring of Ca II-rich clumps at a radius of () located along the inner edge of a limb-brighten shell.
Aside from these apparent clumps, the degree of Ca II absorption in the image appears approximately constant from the center of the remnant out to a radius of , corresponding to a free expansion velocity of . This suggests that the Ca II absorption is at least partially saturated in the central region, as previously concluded from the FOS spectrum of SNR 1885 discussed by Fesen et al. (1999).
The raw and background-corrected Ca II images of SNR 1885 also indicate a fairly spherical remnant structure. The spherical shape and outer extent of the remnant’s Ca II absorption is illustrated by the diameter circle shown in Figure 4. This circle encompasses virtually all of the observed absorption.
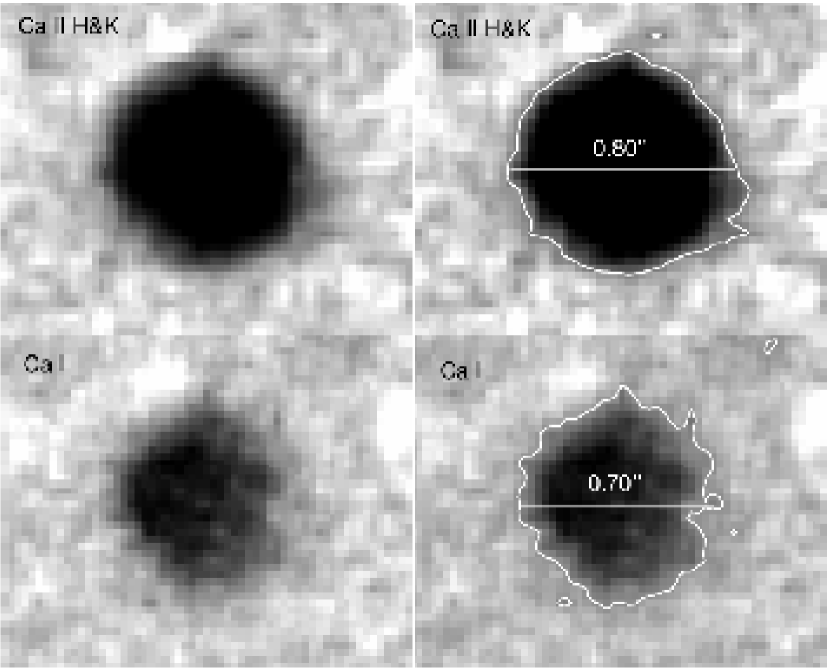
The maximum detected dimensions of the SN 1885 remnant as seen in both the Ca II and Ca I images are shown in Figure 5. The Ca II image shows that Ca II absorption extends out to a diameter of , which is larger than that seen via Ca I absorption (diameter = ). Comparison of these Ca I and Ca II images which are shown here greatly stretched to bring out absorption in the outermost parts of the remnant, shows that the Ca I image as a whole appears offset relative to the center of the Ca II image, by approximately in the direction of the nucleus of M31. The offset is consistent with the asymmetric appearance of the Ca I image, and probably reflects a real intrinsic asymmetry in the distribution of Ca I versus Ca II.
The stretched Ca II image shown in Figure 5 indicates an outer radius for Ca II absorption of at M31’s estimated distance of . This is equivalent to an expansion velocity of at the age of the remnant. This velocity estimate is in agreement with the maximum Ca II velocity of directly measured from a FOS spectrum obtained by Fesen et al. (1999). This agreement supports the notion that the absorbing Ca II-rich ejecta are in free expansion. Moreover, since the image probes the size in the transverse direction while the spectrum probes the size in the line-of-sight direction, the similarity of the two expansion velocities indicates that the Ca II ejecta structure is approximately spherical.
Finally, as noted above the average central intensity in the Ca II image is about that of the local bulge intensity of starlight. This is somewhat higher than the average central intensity of seen in the FOS spectrum of SNR 1885 (Fesen et al., 1999). The slightly brighter average central intensity measured from the ACS/WFC Ca II image compared to the FOS spectrum suggests that the foreground starlight fraction may be about , higher than the fraction found by Fesen et al. (1999) from a best-fit model of the FOS spectrum. A possible reason for this slight discrepancy in central intensities is that center of the circular aperture of the FOS just happened to fall on one of the darker patches of Ca II absorption (see Fig. 4).
3.3 Fe I
The remnant’s Fe I absorption distribution was imaged using the broad, near-UV ACS/HRC filter F330W. While this filter’s bandpass is sensitive to three Fe I lines (3021 Å, 3441 Å, and 3720 Å), the two strongest lines, at 3021 Å and 3720 Å, are detected only partially and at low filter transmission levels; that is, only the redshifted absorption of the 3021 Å line and just the blueshifted side of the 3720 Å line. In addition, the F330W filter covered a considerable continuum region between Å outside of the Fe I lines and, in fact, was used to help compose background bulge starlight images for the Ca I and Ca II ACS/WFC images.
Nonetheless, faint Fe I absorption was detected on the F330W image. The Fe I image (Fig. 2) resembles most the uncorrected Ca I image, showing a lopsided and broken absorption patch some in diameter, a break along the southwest limb, and the strongest absorption concentrated toward the northeast. The image also shows a peak of Fe I absorption roughly pixels across (), i.e., about the same size as that for the Ca II clumps, displaced toward the northeast by about from the center of the Fe I absorption patch.
3.4 Fe II
M31 bulge starlight is relatively faint between Å and faintest between 2300 – 2600 Å where several strong Fe II resonance lines are found. This fact, together with the rising continuum flux of bulge starlight toward the redward portion of the Å passband of the F250W filter on ACS/HRS resulted in a low signal-to-noise 3000 Å continuum dominated image. This, in turn, produced a very weak detection of SNR 1885 presumably due to Fe II line absorption (Fig. 2, lower right panel) based upon ionization models which predict that the remnant should be almost black over the Å range (Fesen et al., 1999).
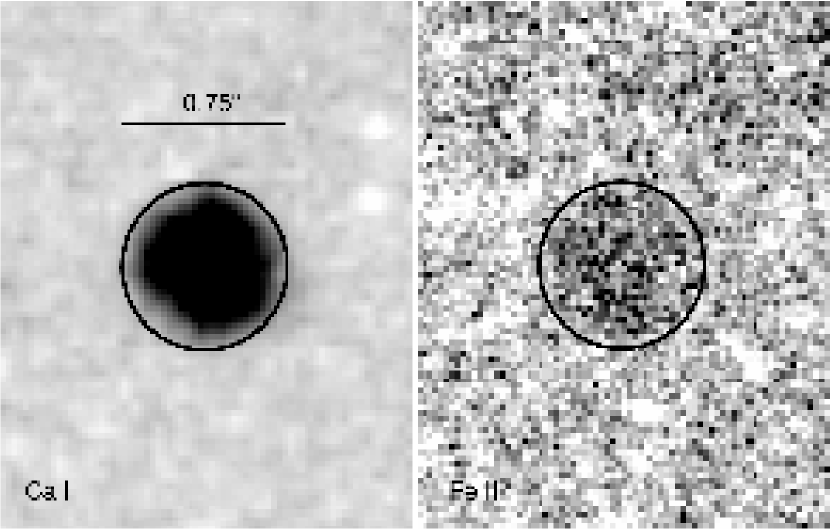
Notwithstanding its comparatively poor detection of SNR 1885, the F250W image bears a clear resemblance to the Ca II image of the remnant. This can be seen in Figure 6 were we show a side-by-side comparison of SNR 1885 in Ca II and the F250W images. It is important to note that the F250W filter covers not only Fe II lines but also the Mg II doublet at Å and several Fe I lines (see 3.3). However, the similarity of the F250W image to the Ca II image but not to the Fe I or Ca I images (see Fig. 2) suggests that Fe I does not make a major contribution to the F250W image. While Mg II Å could also contribute to the detection of SNR 1885 on the F250W image, Mg II is expected to lie outside of the Ca-rich ejecta region and should thus lead to a larger diameter appearing remnant. Since this is not what is seen in the F250W image, we conclude that the F250W image largely shows the distribution of Fe II-rich ejecta in SNR 1885.
4 Models of SNR 1885
In this section, we compare our ACS imaging data of SNR 1885 to off-center delayed-detonation models of Type Ia SNe (SNe Ia).
4.1 Overview of SN Ia scenarios
There is general agreement that SNe Ia result from processes involving the combustion of a degenerate C-O white dwarf (WD) that somehow reaches the Chandrasekhar mass limit, . At present, two mechanisms are considered most likely to bring a WD to this point. Currently, the leading idea is that a single WD accretes matter by Roche-lobe overflow from a main sequence or red giant companion (Whelan & Iben, 1973). An alternative possibility is the merger of two low-mass WDs in a binary (Webbink, 1984; Iben & Tutukov, 1984; Paczyński, 1985; Benz et al., 1990). Either way, the explosion is triggered near the center by compression.
One of the main uncertainties in SN Ia physics is how the nuclear burning flame propagates through the white dwarf. Specifically, does it propagate as a weak supersonic detonation front, or as a subsonic deflagration wave? Whereas detonation fronts are fairly well understood, modeling the propagation of a deflagration wave is difficult because the effective speed of deflagration burning depends on details of the development of multi-dimensional instabilities which, in turn, depend sensitively on the initial conditions that lead to the thermonuclear runaway.
Despite significant recent progress, direct deflagration modeling represents a major computational challenge. This is because of the multi-dimensional physics involved, the wide range of scales spanning 5 to 6 orders of magnitude, and the sensitivity to initial conditions. As a result, fully self-consistent computer models are beyond reach at the present time, and additional observational constraints are needed to make progress on the subject. For example, observational knowledge of the distribution of the products of nuclear burning, as in SNR 1885, can constrain the conditions under which burning must have taken place.
Pure detonation explosions of -mass models have long been ruled out for normal or subluminous SNe Ia. Such models predict that the WD is incinerated almost entirely to , contrary to observed SN Ia spectra which show a range of intermediate mass elements. Pure deflagration explosions also appear to be ruled out for normal SNe Ia. Three-dimensional numerical computations show that deflagrations produce deep Rayleigh-Taylor unstable plumes, which lead to extensive radial, macroscopic mixing of burning products (Khokhlov, 2001; Röpke et al., 2003; Gamezo et al., 2005; Röpke & Hillebrandt, 2005). As a consequence, pure deflagration models predict a chemically mixed region of burning products, surrounded by a thick layer of unburned C-O of several tenths of a solar mass. By contrast, spectra of normal SNe Ia reveal a chemically stratified structure. Moreover, there is no evidence for rising deflagration plumes whose signatures should be visible in infrared spectra of normal SN Ia at late times or in subluminous SNe Ia such as SN 1999by at early times (Höflich et al., 2002, 2004).
Better agreement with observations is obtained with so-called ‘delayed-detonation’ (DD) models in which the explosion is assumed to begin as a deflagration which then (somehow) develops into a detonation. The mechanism by which a deflagration might turn into a detonation is not well understood. Thus simulations typically make the ad hoc assumption that at some point a deflagration wave simply turns into a detonation, and the density at which this transition takes place is treated as a free parameter.
Increasing the transition density causes the transition from deflagration to detonation to occur earlier, increasing the amount of synthesized. Variation in this one parameter can account for the observed gross variation in the properties of SNe Ia: how much is produced, the overall distribution of elements, and the brightness of the SN Ia event (Höflich, 1995; Höflich et al., 1995; Iwamoto et al., 1999).
4.2 Delayed-Detonation Models
Arguments about SNe Ia in general do not necessarily apply to an individual object such as SN 1885. However, delayed-detonation models can reproduce both early to late time light curves and the spectra of both normal and subluminous SNe Ia light spectra in the optical to the IR (Höflich et al., 2003).
We therefore base our comparison to observations of SNR 1885 on a suite of spherical delayed-detonation models (Höflich et al., 2002). The models start from the progenitor, 5p01z22, a C-O white dwarf taken from the core of an evolved 5 M☉ main sequence star with solar metallicity. Through accretion, this core approaches the Chandrasekhar limit. A deflagration begins spontaneously when the core reaches a central density of and the WD mass is close to (Höflich et al., 2002).
As mentioned above concerning DD models, the density at which the deflagration is assumed to transition into a detonation is the key parameter that produces variation in SNe Ia. For extragalactic SNe Ia, the transition densitycan be adjusted so as to match the observed light curve, in particular its rate of decline (Höflich et al., 2003). The chemical profile of the model then predicts a spectrum that can be compared to observation. In the case of SNR 1885, we will instead choose the transition density so as to reproduce the chemical profiles observed with ACS. The maximum brightness and light curve then become a prediction of the model.
The HST ACS images of SNR 1885 presented in §3 show Ca II at velocities up to . By comparison, DD models can produce Ca-rich ejecta with maximum velocities that range from for a very subluminous SN Ia resembling SN 1991bg, up to for normal SN Ia. The specific model that best matches SNR 1885 is 5p01z22.16, in which the ‘.16’ refers to a DD transition density of for the progenitor 5p01z22. In this model, the deflagrated region encloses , and the explosion produces a net total of of .
Model 5p01z22.16, which also provides a good fit to the subluminous SN Ia object SN 1986G (Phillips et al., 1987; Phillips, 1993), is subluminous by about magnitudes, predicts a peak brightness of and , and a 15-day decline rate of and . This peak brightness in agrees well with that observed for SN 1885, but the decline rate is slower than the reported for SN 1885 (van den Bergh, 2002). A possible explanation of the discrepancy in the decline rate may be related to uncertainties in the time of maximum light of SN 1885. All SNe Ia show a flat maximum, followed by a phase of increasing rate of decline (Phillips et al., 1999). A shift of days in would bring the model into closer agreement.
4.3 The SN 1885 Explosion
In constructing off-center DD models, we have followed the prescription of Livne (1999). In this prescription, the initial deflagration phase is modeled assuming spherical symmetry. The deflagration begins at the center, and propagates outward in a subsonic deflagration wave. The energy deposited by deflagration causes the entire white dwarf to expand. When the density at the leading edge of the deflagration wave has fallen to a certain transition density, a detonation is ignited by hand at a single point (the north pole) of the deflagration front. The simulation is then continued in 2 dimensions assuming cylindrical symmetry.
We choose to impose spherical symmetry on the initial deflagration phase for two reasons. The first reason is simply computational tractability: 3-dimensional simulations are computationally expensive, requiring many CPU hours (Khokhlov, 2001; Röpke et al., 2003; Gamezo et al., 2005), and indeed no fully consistent DD models have ever been calculated. The second reason is that multi-dimensional simulations tend to predict mixed chemical profiles, which are at odds with observations both of typical SN Ia (see §4.1 above) and of SNR 1885, where the observed Ca I image indicates some radial stratification.
No mixing seemed to us to offer a more promising approach than full mixing. However, in §4.7 below we will show that the Ca image of SNR 1885 is more filled-in at its center than predicted by the model, suggesting that the assumption of spherical symmetry over-corrects the problem, producing more stratification than needed. We remedy this a posteriori in §4.7, by taking the final, fully-exploded WD, and partially remixing its central regions.
The 3D calculations of Gamezo et al. (2005) show that detonation proceeds mainly along radial fingers, leaving behind connected regions of unburned matter. To allow for this, we assumed that the deflagration burns only about of the matter, leaving the remaining matter unburned. The unburned material plays an important role in that it allows the subsequent detonation to move back into and through the center of the partially deflagrated core, which offers a better approximation to the 3D calculations of Gamezo et al. (2005) than models in which there is no unburned material, and the detonation front is forced to circulate around the core Livne (1999).
Deflagration burning causes the entire WD to expand. Several seconds into the deflagration, when the density has decreased by about two orders of magnitude, we initiate the detonation at a point on the boundary of the deflagration wave. We treat the density of the transition as a free parameter, and we characterize its location by the mass interior to the detonation point. At the same time that we initiate the detonation, we switch from spherical to cylindrical symmetry, following the explosion on a grid of cells in the radial and angular directions. The detonation begins at the pole of the cylindrically symmetric configuration, and propagates away from the pole in all directions. The detonation front moves not only outward and sideways through the unburned WD, but also inward through deflagrated core, consuming the fraction of unburned material there.
In the model, the detonation front reaches the surface of the WD at the pole about seconds after the detonation, and it reaches the surface at the opposite pole about seconds after that, consistent with the times obtained in the 3D calculations of Gamezo et al. (2005) (who did not, however, continue their calculation to homologous expansion). Over the next 5 to 10 seconds, the hot WD accelerates into free expansion, and the stored thermal energy is converted into kinetic energy. The density structure of the expanding ejecta freezes out as the sound speed plummets.
About one second after entering the 2D phase, we switch back to 1D hydrodynamics, evolving each of the angular segments as if it were spherically symmetric. At this time, angular gradients in the Ca-rich layers are less than 2%.
4.4 Numerical Methods of the Explosion Models
All numerical calculations were done using the HYDRA code (see Höflich 2003). HYDRA consists of a number of modules that solve simultaneously the hydrodynamical equations, nuclear and atomic networks, and radiation transport equations.
For spherical geometry, the hydro equations are solved in the Lagrangian frame, and include a front tracking scheme to resolve shock fronts (Höflich, Wheeler & Thielemann, 1998). For cylindrical geometry, the coupled hydro and gravitational (Poisson) equations are solved in an Eulerian frame using a code based on PROMETHEUS (Fryxell, Arnett & Müller, 1991) without adaptive mesh refinement. The hydro modules use the explicit Piecewise Parabolic Method (PPM) of Collella & Woodward (1984) to solve the compressible reactive flow equations.
HYDRA does not include a detailed model of the nuclear flame and of the associated development of instabilities. Instead, the code parameterizes the deflagration speed semi-analytically, the parameters being adjusted so as to reproduce deflagration speeds obtained in 3D calculations. Dominguez & Höflich (2000) have shown that, in models with a parameterized deflagration speed, the abundance of chemical elements synthesized is relatively insensitive to the deflagration speed, but rather depends mainly on the amount of electron capture that takes place during deflagration, which in turn depends on the total amount of material burned during the deflagration phase.
For the nuclear equation of state and the reactions, HYDRA uses the nuclear reaction-network library of Thielemann, Nomoto & Hashimoto (1994, and references therein). We take into account 218 isotopes for all models.
For spherical geometry, we use 912 radial layers, while for cylindrical geometry we adopt a relatively modest resolution of cells. Computationally, there is a trade-off between a large nuclear network and high spatial resolution. We opt for a large nuclear network (rather than the 4 or 5 isotopes typically considered in 3D calculations) because numerical tests indicate that the final chemical composition is more sensitive to a reduction in the nuclear network than to a factor 2 reduction in the spatial resolution (Höflich, Wheeler & Thielemann, 1998). In any case, the detonation phase is relatively brief and occurs on an already expanding WD so the effects of moderate spatial resolution during detonation are not expected to be dramatic. Still, there is certainly room for improvement in this aspect of the modeling.
4.5 The Chemical Distribution in the SNR 1885 Model
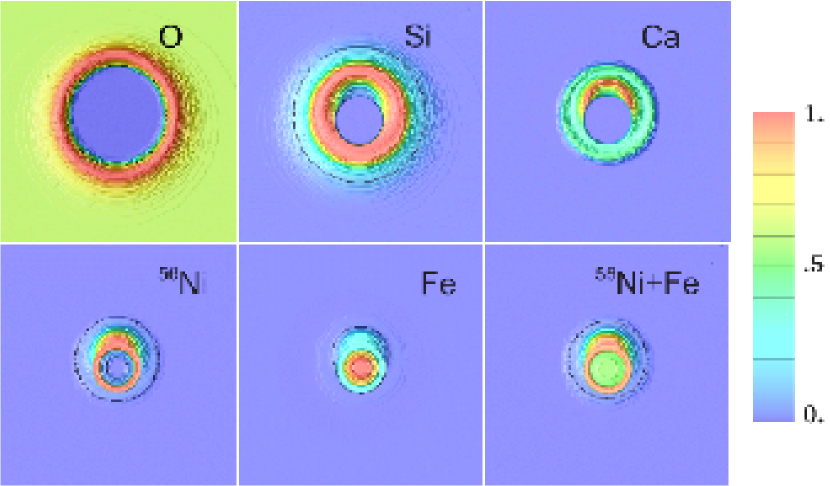
Figure 7 shows the late-time chemical distribution in model 5p01z22.16, with transition mass . This figure shows the distribution in velocity of O, Si, Ca, Fe, and several minutes after the explosion, which is well into the phase of free, homologous expansion. The detonation axis points upward. Since the in SNR 1885 today has long since decayed radioactively to , the figure also shows the distribution of combined . The chemical structure seen is similar for models with transition mass to .
During the early stage of the deflagration, densities are high enough, , that electron capture can take place. This produces a central region containing stable isotopes of Fe, Co, and Ni with a mass fraction for Fe of . As the density drops in the expanding WD, electron capture ceases and the later stages of deflagration yield about of radioactive Ni and Ca.
The detonation phase produces off-center layers of explosively synthesized isotopes, from and Ca on the inside to oxygen on the outside. The element abundances are characteristic of those obtained in various stages of burning. The outermost oxygen is partially burned, its mass fraction having increased from the 50% of the original C-O WD to about 70%.
The distribution of Ca in model 5p01z22.16 is qualitatively similar to that seen in the HST/ACS images of SNR 1885. The model shows Ca in a lopsided shell with a mass fraction around 3% from about 3500 to , peaking at a mass fraction of about 6% at . The velocity of the peak increases slightly to if the transition mass is increased to .
The final Fe distribution has an inner region of about 50%, produced during the early deflagration. This region is surrounded by a lopsided shell, produced by detonation to , where the mass fraction rises to almost 90%. The mass fraction decreases slowly outward, declining to about 1% at .
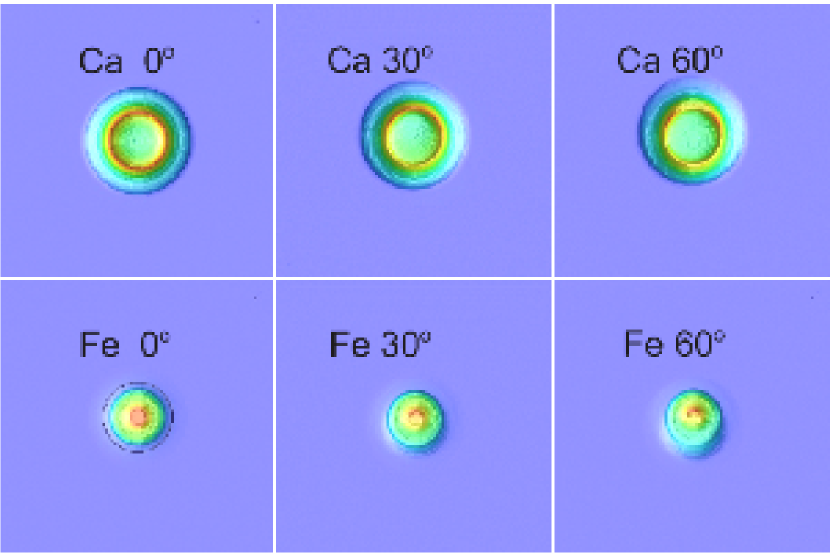
The HST imaging observations of SNR 1885 reveal not the density itself, but rather the column density, i.e., the density projected along the line-of-sight. Thus Figure 8 shows the column densities of Ca and Fe for Model 5p01z22.16, with the detonation axis taken at various inclinations to the line-of-sight. The projected distributions appear round when seen face-on () but they become asymmetric at higher inclinations. The asymmetry remains modest even at high inclinations, in part because the intrinsic asymmetry is not large and in part because projection tends to smear out the asymmetry. Comparison between model and observed images of SNR 1885 does not tightly constrain the inclination. However, the observed Ca I image is clearly asymmetric, and we adopt an inclination angle of because this angle is consistent with the projected asymmetry observed.
4.6 The Ionization Structure of SNR 1885
Fesen et al. (1999) and Hamilton & Fesen (2000) argued that the main source of ionization in SNR 1885 is photoionizing UV from the bulge of M31, and that the main source of UV opacity in SN 1885 is from resonance lines of neutral and singly-ionized species. Recombination and charge exchange are negligible in SNR 1885 120 years after the explosion.
Fesen et al. (1999) also pointed out that if the ejecta were optically thin, then the lifetimes of Ca I and Fe I exposed to UV light from the bulge would be quite short; and , respectively. The errors quoted come from uncertainty in the line-of-sight location of SN 1885 within the bulge, but there could be a further factor of two uncertainty from photoionization cross-sections and from the extinction correction to the photoionizing UV flux.
Predicted photoionization lifetimes as short as these pose a problem. Although resonance lines can block about half the photoionizing UV light at the present time, that still leaves half the UV to get through and reduce the Ca I and Fe I below the currently observed levels. Fesen et al. (1999) suggested that Ca I and Fe I might be present, in spite of their short optically thin photoionizing times, if the remnant were optically thick in neutral continua, notably Fe I, earlier in its history. They did not, however, carry out the detailed model computations necessary to demonstrate this possibility.
In the present paper, we have carried out the needed time-dependent, photoionization computations, and these show that the observed level of ionization in SNR 1885 is entirely consistent with model expectations. We computed the photoionization of SNR 1885 as follows. We assumed an incident UV spectrum following the FOS data of Fesen et al. (1999) down to 2221 Å, from the IUE data of (Burstein et al., 1988) down to 1225 Å, and from the HUT data of (Ferguson & Davidsen, 1993) down to 912 Å, dereddened using the Cardelli et al. (1989) extinction curve with color excess (Ferguson & Davidsen, 1993) and .
We treated the photoionizing UV spectrum incident on SNR 1885 as being isotropic. Hamilton & Fesen (1991) had noted that SNR 1885 should be receiving more radiation on the side facing the nucleus of M31 and suggested that for this reason SNR 1885 should be more ionized on that side. However, the ACS images show precisely the opposite. Not only do the images show Ca I concentrated toward the bulge, but an FOS spectrum of the remnant showed Ca I redshifted by , corresponding to the side closer to the bulge (Fesen et al., 1999). Thus an anisotropic photoionization model cannot account for the observed asymmetry in the Ca I distribution. Rather, the observed asymmetry must reflect an intrinsic asymmetry in the explosion, such as that produced by an off-center delayed-detonation. For simplicity, therefore, we neglected any anisotropy of the incident photoionization.
The evolution of the ionization structure of C, O, Mg, Si, S, Ca, Mn, Cr, Fe, and Ni was computed starting from about 10 years after the explosion. We took the initial ionization state to be mainly neutral, with an ionization fraction of 1% in the central deflagrated region where there is no radioactive heating, and 10% in the detonated region where there is radioactive heating, dominated initially by and later by .
Although this initial degree of ionization is plausible, it is not well-determined a priori by the physics because of complications associated with non-local energy transport by fast electrons in the presence of magnetic fields (Fransson et al., 1996; Liu, Jeffery, & Schultz, 1997; Ruiz-Lapuente & Lucy, 1992). Tests indicated that the degree of ionization at the present time is most sensitive to the initial ionization fraction in the detonation layer. Reducing the ionization in this layer to 1% can delay ionization of Ca I and Fe I by about 30 years. The initial ionization state adopted here was chosen because it is reasonable and because it reproduces the observed degree of ionization at the present time.
We computed the temperature structure by taking into account adiabatic expansion, radioactive heating, and the UV radiation field. The electron temperature affects recombination rates and hence the ionization balance at early times when the density is high.
Line opacities were computed in the Sobolev approximation for homologously expanding atmospheres, omitting stimulated emission. In homologously expanding ejecta, the radius equals velocity times age, , and the column density per unit velocity of any species is equal to its density times the age . In the nomenclature of Mihalas (1978), the Sobolev optical depth at wavelength for a bound transition with absorption oscillator strength is
| (1) |
where and are the electron charge and mass, the speed of light, and is the 120 yr age of the remnant.
Besides resonance lines, we also took into account excited lines with lower levels originating from the ground level. We computed the level populations in a 2-level approximation in which the lower levels are excited by (optically thin) IR and optical radiation from the bulge and which then decay by spontaneous emission. Altogether, we included 6,748 bound-bound transitions with wavelengths, energy levels, and oscillator strengths taken from Kurucz (1995).
Both to follow photoionization and to take into account shielding by neutral atoms, we included bound-free opacities from the ground state for all neutral isotopes of the elements above. Photoionization cross sections were taken from Verner et al. (1996) to which we added some resonances treated in the narrow line approximation based on data from the opacity project (Lynas-Gray et al., 1995). Finally, we also took into account the Doppler shift of the continuum.
The final result of all these calculations is that shielding of UV radiation by bound-free transitions of Mg I, Ca I, and Fe I proved to be the key in delaying photoionization so that Ca I and Fe I can survive in SNR 1885 up to the present time. All the models showed that Ca and Fe is mostly neutral at early times, but that Ca I and Fe I will rapidly disappear as soon as photoionizing UV radiation can penetrate the ejecta. Without bound-free shielding, Ca I is depleted to 10% after about 50 years, whereas with shielding, photoionizing radiation remains blocked for almost a century. Whereas the UV opacity from bound-free transitions evolves substantially, most of the bound-bound transitions remain optically thick over the life of SNR 1885 up to the present time, so that the UV line-blocking remains almost constant.
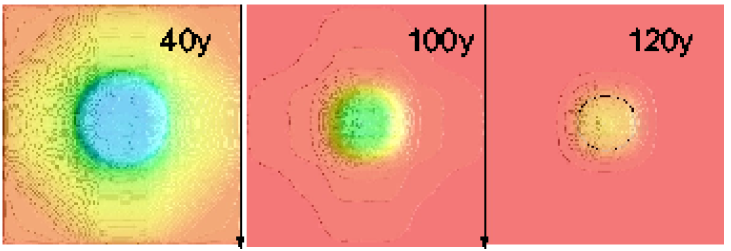
Figure 9 shows the evolution of the Ca I/Ca fraction. The high-velocity, outermost layers having a solar-like abundance of Ca are quickly photoionized, whereas the inner, Ca-rich layers remain opaque for about a century. As previously argued by Fesen et al. (1999), Ca-rich ejecta are currently undergoing a phase of rapid photoionization to Ca II. Indeed, our models predict that Ca I absorption will become unobservably small in just another 30 years or so, when the remnant is roughly 150 years old.
4.7 2D Model Images of SNR 1885
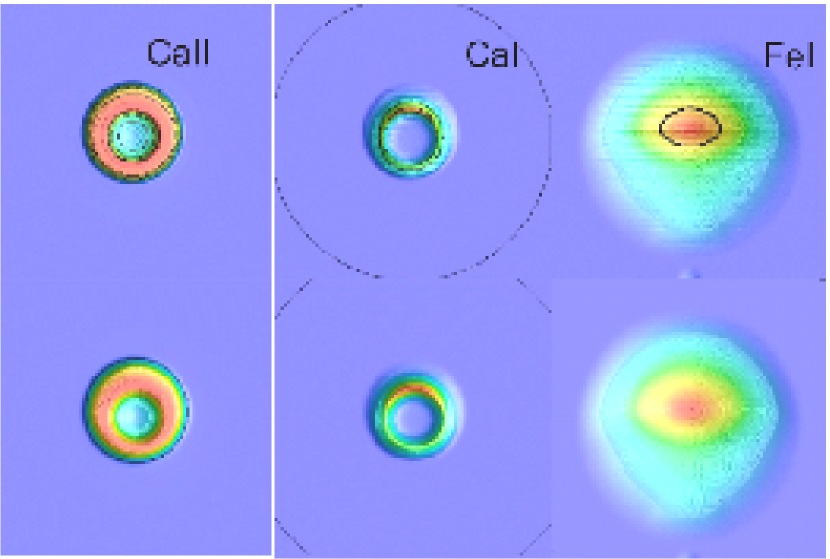
Figure 10 shows model Ca II, Ca I, and Fe I images that can be compared directly to the ACS images. These images take into account not only the chemical and ionization structure of the remnant, as described above, but also the transmission curves of the HST filters, the contribution of different lines to absorption, and the finite angular resolution of HST. As discussed in §4.5, the detonation axis in the model is taken to be inclined at to the line-of-sight.
The model predicts the Ca II image to be insensitive to the precise ionization structure, since Ca is mostly singly-ionized. The model also predicts that the Ca image should have a sharp edge, where the mass fraction of Ca drops rapidly from 3% to the pre-explosion, solar-like abundance. The images shown in Figure 10 are for model 5p01z22.16, which as described in §4.2 was chosen so as to reproduce the maximum velocity of Ca II observed in SNR 1885.
The Ca II model image in Figure 10 is as seen through the HST ramp-filter FR388N centered at Åand Åwide, and takes into account the doublet character of the Ca II H & K absorption. The model predicts that the Ca II optical depth should exceed unity in a ring from to , which are close to the values measured for SNR 1885.
The model Ca I and Fe I images in Figure 10 appear off-center by about and , respectively, again in good qualitative agreement with the observed images. The offset is caused primarily by the asymmetric chemical distribution produced by the assumed off-center delayed-detonation. The asymmetry is enhanced by the self-shielding of denser regions against photoionization.
A defect of the model is that the predicted Ca I and Ca II images are emptier at their centers than observed in SNR 1885. It is natural to attribute this defect to our assumption that the early deflagration phase of the explosion was spherically symmetric, which artificially suppresses radial mixing by Rayleigh-Taylor instabilities in the deflagration wave. Indeed, the observed images show structure down to scales comparable to the angular resolution of the observations, such as might perhaps be produced by instabilities.
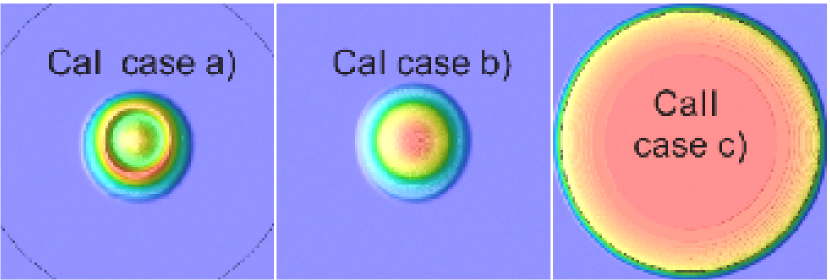
To remedy this defect of the model, we tried radially re-mixing the final chemical profile in various ways. Figure 11 shows the effect on the model Ca I and Ca II images of radially remixing of: (a) layers within the central deflagrated region; (b) layers within the outer boundary of the Ca layer; or (c) the entire remnant. All three cases fill in the central Ca hole in the model to a greater or lesser degree.
The observed Ca images of SNR 1885 are intermediate between cases (a) and (b), suggesting that there may have been a moderate amount of radial mixing between the inner deflagrated region and the surrounding detonated layers. This level of mixing is less than that predicted by current 3D calculations of RT-dominated deflagration fronts (Khokhlov, 2001; Röpke & Hillebrandt, 2005). Smaller amounts of mixing could result if the initial conditions at the onset of runaway burning produce a less violent deflagration (Livne et al., 2005), or if the WD undergoes one or more pulsations with mixing prior to the transition to detonation (Höflich et al., 2004). Mixing may also be produced or enhanced by heating of rich regions, well after the thermonuclear explosion, on time scales of hours to days. Both mechanism are compatible with fluctuations on scales observed.
5 Alternative Scenarios for SNR 1885
Because of the known diversity of SNe Ia, below we speculate on some alternative scenarios for modeling the specific case of SNR 1885.
A variation of ‘classical’ DD models (which assume ad hoc that deflagration converts into a detonation), are the so-called ‘confined-detonation’ models recently suggested by Calder et al. (2003) and Plewa et al. (2004). Their proposal is motivated in part by the extreme sensitivity to initial conditions of the early phase of burning. In this model, a buoyancy driven individual plume rises from the central deflagrating region to the surface, where it triggers a He-detonation. A detonation wave then propagates inward, exploding the WD. The confined-detonation model may offer a natural mechanism to burn a WD partly via deflagration and partly by detonation.
Current models of confined-detonation use only a limited nucleosynthetic network, so there is more work to be done, but the results to date suggest that burning in the central layers occurs at densities well below the value of (Plewa et al., 2004) needed to produce a central region with electron capture, such as is inferred from SNR 1885. Moreover, the confined detonation models predict a significant amount of Fe at high velocities, which is not seen in normal SNe Ia.
Mergers may contribute to the SNe Ia population and are obvious candidates for off-center explosions. For S-Andromeda, merger scenarios will suffer from the same problem as confined detonations namely, a low central density with negligable electron capture, unless the primary star is close to when the detonation is triggered. However, a detonation in a mass WD would produce a large amount of Ni and consequently an over-luminous SNe Ia which is incompatible with observations of the SN 1885 event.
Finally, one might even consider SN 1885 as a possible core-collapse supernova. The fact that the remnant is freely expanding out to indicates that the remnant has so far swept up less than about of material, implying an ambient circumstellar or interstellar density less than about . This relatively low density, the historical record, and the absence of evidence of recent star formation in the bulge of M31, all point to a SNIa event, as opposed to a SNIb or SNIc event in which a massive star undergoes core collapse after having lost its hydrogen envelope in a wind. Our ACS observations add further evidence in this direction, the abundance and distribution of Fe and Ca being more consistent with a deflagration/detonation event than with He-rich freeze-out. The near spherical symmetry of the Ca II image can also be construed as supporting the SN Ia interpretation, since there is growing evidence that the explosion mechanism of these objects is intrinsically asymmetric with axis ratios of 2:1 or more (Wang et al. 2001; Leonard & Filippenko 2001).
6 Future Observations of SNR 1885
The remnant of SN 1885 offers an unique and remarkable opportunity to investigate the explosion dynamics and chemistry of a SN Ia explosion in some detail. The HST ACS data on SNR 1885 presented in this paper provide only a glimpse of the potential to probe SN Ia physics. In this light, we thought it useful to consider future observations that might provide further insights.
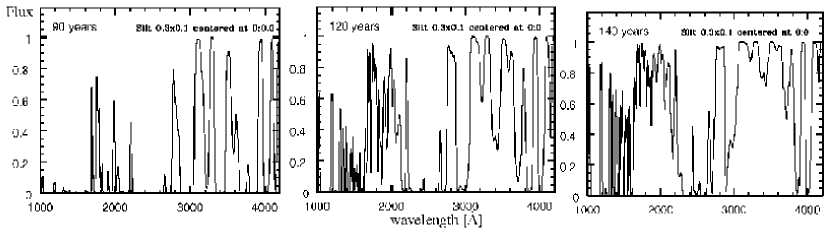
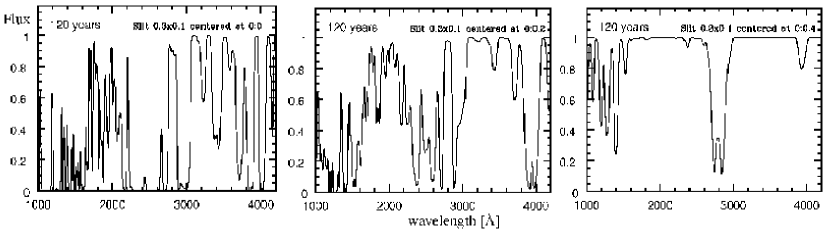
Figure 12 shows a model UV absorption spectrum at three different times, respectively 90, 120, and 140 years after the explosion. The predicted spectrum is rich with strong, broad absorption features from dozens of resonance lines many of which evolve in strength fairly rapidly.
Of course, the relative faintness of the bulge of M31 in the UV will limit the observability of the SNR 1885 spectrum. However, useful observations can be made even with limited signal-to-noise. For example, as discussed in §4.6, the remnant is undergoing a period of rapid ionization of Ca I and Fe I to the singly-ionized state, so that UV continuum absorption by neutral Ca and Fe is currently decreasing rapidly. This reduction in continuum opacity could be detected by broad-band UV imaging over a period as short as 5 years.
Future spatially resolved UV spectral imaging, similar perhaps to that available with the Space Telescope Imaging Spectrograph (STIS), could provide a significant step forward in our understanding of SN Ia events. For example, Figure 13 shows UV spectra taken with slits at various offsets from the remnant’s center. Spectra such as these would provide a goldmine of information about the 3-dimensional structure and composition of the supernova ejecta, and hence about uncertain aspects of explosion physics in SNe Ia.
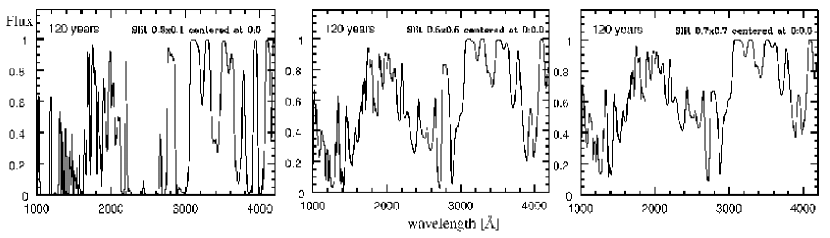
While narrow slits would of course provide the most precise mapping of ejecta, even broad slit spectra would provide useful information. Figure 14 shows predicted UV spectra taken with various different slit widths available using the STIS on HST.
7 Conclusions
SN 1885, exploding as it did so close to, and to the near side of, the nuclear bulge of M31, presents a remarkable opportunity to map the chemical and density structure of freely-expanding ejecta in a Type Ia supernova. In this paper, we present high angular resolution Hubble Space Telescope images of the remnant of SN 1885 sensitive to Ca I, Ca II, Fe I, and Fe II resonance line absorption.
The highest quality image is that of Ca II, which shows a spherical remnant in diameter, corresponding to a free-expansion radius of . Although the image is partially saturated (optical depth a few), it shows indications of a ring-like interior structure peaking at a radius of about , with a few apparent absorption ‘clumps’ with an angular size near (). The SN 1885 remnant appears somewhat lopsided and smaller (dia. = ) in Ca I than Ca II, indicating that the inner parts of the remnant are more neutral than the outer parts, as expected if the ejecta are being photoionized by UV light from the bulge of M31. The remnant’s Ca I and Fe I absorption structures appear similar in size and morphology, except that the Fe I image shows a small Fe I absorption peak of diameter displaced to the northeast (projected velocity of ) from the center of the Ca II structure. Finally, a weak detection of SNR 1885 across the wavelength range of Åis probably caused by near saturated absorption from several resonance Fe II lines. The Fe II image appears similar in size to that seen in Ca II.
We argue that the off-center and ring-like characteristics of the Ca and Fe I images favor off-center delayed-detonation models of the explosion. We considered alternative scenarios including pure deflagration models, confined-detonations, and WD mergers, but find all of these to be less likely.
Using the HYDRA code (Höflich, 2003), we have made detailed computations that follow delayed-detonation models of SN 1885 from the beginning of nuclear runaway up to the present 120 year age of the remnant. The models follow in detail the nucleosynthesis in, radiative transfer through, and ionization structure of, the ejecta, including the effects of late-time photoionization by UV light from the bulge of M31.
We selected a best-match model so as to reproduce the observed maximum velocity of Ca. The best-match model undergoes a transition from deflagration to detonation at a mass fraction of . The model is subluminous by about magnitudes, consistent with indications from the historical record of SN 1885. The model synthesizes of , and has a light curve similar to that of the subluminous Type Ia event, SN 1986G.
We find that our model is able to reproduce many of the general observational features of SNR 1885. Ca and Fe in SNR 1885 are mostly singly-ionized at the present time, so the Ca II and Fe II images trace essentially all the Ca and Fe in the remnant. By contrast, Ca I and Fe I trace only the regions with the highest density and abundance of Ca and Fe, because only in these regions are Ca I and Fe I sufficiently self-shielding against photoionizing UV from the bulge of M31 to survive up to the present time.
Our analysis presents the first direct comparison between the properties of a supernova remnant and multi-dimensional explosion models to probe the underlying physics of burning fronts. Within the framework of delayed-detonation (DD) models, the deflagration-detonation transition occurs at densities of the order of , consistent with the Zel’dovich mechanism (Khokhlov et al., 1997; Niemeyer & Woosley, 1997). Potential candidate processes for mixing of burned and unburned matter may be instabilities internal to the deflagration front (Khokhlov et al., 1997; Niemeyer & Woosley, 1997), during a pulsational phase of the WD (Khokhlov et al., 1993; Höflich et al., 1995), or externally induces by shear instabilities present in rapidly, differentially rotating WDs when rising plumes enter this region of strong differential rotation (Höflich et al., 2003; Uenishi, Nomoto, & Hachisu, 2003; Yoon, Langer, & Scheithauer, 2004; Yoon & Langer, 2004).
The apparent presence of small scale Ca II-rich clumps is the first direct evidence for some instabilities and thus the existence of a deflagration phase in SNe Ia or, alternatively, mixing induced by radioactive decay of 56Ni over time scales of seconds or days. However, the degree of mixing allowed by the observed images is much smaller than current 3D calculations for Rayleigh-Taylor dominated deflagration fronts. This could indicate a serious problem in the current generation of multi-dimensional models for deflagration fronts, which may be related to the initial conditions at the time of the runaway. In addition, the images require a central region of no or little Ca but iron group elements indicative for burning under sufficiently high densities for electron capture taking place, i.e., burning prior to a significant pre-expansion of the WD.
Off-center, delayed-detonation models have the virtue of being able to reproduce light curves and spectra of normal and subluminous SNe Ia (Höflich et al., 2003). It is remarkable that these same models are able to reproduce the distribution and morphology of Ca and Fe in the remnant of SN 1885. However, it should be emphasized that the models described in this paper are parametrized, and thus not fully self-consistent. Our efforts should be regarded only as a first step toward tightening the link between explosion physics and observations of young supernova remnants.
The details of SNe Ia remain poorly understood (Höflich, 2006). How the deflagration begins and develops is extremely sensitive to initial conditions (Höflich & Stein, 2002; Livne, 2004; Gamezo et al., 2005). Equally unclear is how the deflagration subsequently turns into a detonation. While observations of any one object are unlikely to completely resolve such difficult questions, further observations of the SN 1885 remnant might yield additional insights and guidance for future computer simulations of SN Ia explosions.
References
- Baade (1946) Baade, W. 1946 unpublished; see Osterbrock, D. E. 2001, Walter Baade - A Life In Astrophysics (Princeton: Princeton Univ. Press), 93–94
- Benz et al. (1990) Benz, W., Cameron, A. G. W., Press, W. H. & Bowers, R. L. 1990, ApJ, 348, 647
- Boulesteix et al. (1987) Boulesteix, J., Georgelin, Y. P., Lecoarer, E., Marcelin, M., & Monnet, G. 1987, A&A, 178, 91
- Brown et al. (2004) Brown, T. M., Ferguson, H. C., Smith, E., Kimble, R. A., Sweigart, A. V., Renzini, A., & Rich, R. M. 2004, AJ, 127, 2738
- Burstein et al. (1988) Burstein, D., Bertola, F., Buson, L. M., Faber, S. M., & Lauer, T. R. 1988, ApJ, 328, 440
- Calder et al. (2003) Calder, A. C., Plewa, T., Vladimirova, N., Brown, E. F., Lamb, D. Q., Robinson, K., & Truran, J. W. 2003, BAAS, 203, 4509
- Cardelli et al. (1989) Cardelli, J. A., Clayton, G. C., & Mathis, J. S. 1989, ApJ, 345, 245
- Chevalier & Plait (1988) Chevalier, R. A., & Plait, P. C. 1988, ApJ, 331, L109
- Collella & Woodward (1984) Colella, P., Woodward, P.R. 1984, J.Comp.Phys. 54, 174
- Crane et al. (1992) Crane, P. C., Dickel, J. H., & Cowan, J. J. 1992, ApJ, 390, L9
- de Bruyn (1973) de Bruyn, A. G. 1973, A&A, 26, 105
- de Vaucouleurs & Corwin (1985) de Vaucouleurs, G., & Corwin, H. G. 1985, ApJ, 295, 287
- Dickel & Dodorico (1984) Dickel, J. R., & Dodorico, S. 1984, MNRAS, 206, 351
- Dominguez & Höflich (2000) Dominguez I., Höflich P. 2000, ApJ 528, 854
- Dwarkadas & Chevalier (1998) Dwarkadas, V., Chevalier, R. A. 1998, ApJ, 497, 807
- Eck et al. (2002) Eck, C. R., Cowan, J. J., & Branch, D. 2002, ApJ, 573, 306
- Ferguson & Davidsen (1993) Ferguson, H. C., & Davidsen, A. F. 1993, ApJ, 408, 92
- Fesen et al. (1999) Fesen, R. A., Gerardy, C. L., McLin, K. M., & Hamilton, A. J. S. 1999, ApJ, 514, 195
- Fesen et al. (1989) Fesen, R. A., Saken, J. M., & Hamilton, A. J. S. 1989, ApJ, 341, L55
- Ford et al. (1998) Ford, H. C., et al. 1998, Proc. SPIE, 3356, 234
- Fransson et al. (1996) Fransson, C., Lundqvist, P., Chevalier, R. A. 1996, ApJ, 461, 993
- Freedman & Madore (1990) Freedman, W. L., & Madore, B. F. 1990, ApJ, 365, 186
- Fryxell, Arnett & Müller (1991) Fryxell B., Arnett D., Müller E. 1991, ApJ 367, 619
- Gamezo et al. (2005) Gamezo, V. N., Khokhlov, A. M., & Oran, E. S. 2005, ApJ, 623, 337
- Gamezo et al. (2003) Gamezo, V. N., Khokhlov, A. M., Oran, E. S., Chtchelkanova, A. Y., & Rosenberg, R. O. 2003, Science, 299, 77
- Gaposchkin (1936) Gaposchkin, C. P. 1936, ApJ, 83, 245
- Graham (1988) Graham, J. R. 1988, ApJ, 326, L51
- Hamilton & Fesen (1991) Hamilton, A. J. S., & Fesen, R. A. 1991, in Supernovae, 10th Santa Cruz Summer Workshop in Astronomy and Astrophysics, ed. S. E. Woosley (Berlin: Springer-Verlag), 656
- Hamilton & Fesen (2000) Hamilton, A. J. S., & Fesen, R. A. 2000, ApJ, 542, 779
- Höflich (1995) Höflich, P. 1995, ApJ, 443, 89
- Höflich (2003) Höflich, P. 2003, ASP Conf. Ser. 288, Stellar Atmosphere Modeling, ed. I. van Hubeny, D. Mihalas and K. Werner (San Francisco: ASP), 185
- Höflich (2006) Höflich, P. 2006, Nuclear Physics A, Vol. 777, 579
- Höflich, Wheeler & Thielemann (1998) Höflich, P., Wheeler, J. C., and Thielemann, F.K. 1998, ApJ 495, 617
- Höflich et al. (2002) Höflich, P., Gerardy, C., Fesen, R. A, & Sakai, S. 2002, ApJ, 568, 791
- Höflich et al. (2003) Höflich, P., Gerardy, & C., Linder, E., et al. 2003, in Stellar Candles for the Extragalactic Distance Scale, Lecture Notes in Physics, 635, 203
- Höflich et al. (2004) Höflich, P., Gerardy, C. L., Nomoto, K., Motohara, K., Fesen, R. A., Maeda, K., Ohkubo, T., & Tominaga, N. 2004, ApJ, 617, 1258
- Höflich et al. (2004) Höflich, P., Gerardy, C., & Quimby, R. 2004, in Cosmic Explosions in Three Dimensions, ed. P. Hoflich, P. Kumar & J. C. Wheeler (Cambridge: Cambridge University Press), 142
- Höflich et al. (1995) Höflich P., Khokhlov, A., Wheeler J.C. 1995, ApJ, 444, 211
- Höflich & Stein (2002) Höflich P., & Stein J. 2002, ApJ, 568, 771
- Hoyle & Fowler (1960) Hoyle, P., & Fowler, W. A. 1960, ApJ, 132, 565
- Iben & Tutukov (1984) Iben Jr, I., & Tutukov, A. V. 1984, ApJS, 54, 335
- Iwamoto et al. (1999) Iwamoto, K., Brachwitz, F., Nomoto, K., Kishimoto, N., Umeda, H., Hix, W. R., & Thielemann, F. 1999, ApJS, 125, 439
- Janka et al. (2005) Janka, H.-T., Scheck, L., Kifonidis, K., Müller, E., & Plewa, T. 2005, in ASP Conf. Ser. 332, The Fate of the Most Massive Stars, ed. R. Humphreys and K. Stanek (San Francisco: ASP), 363
- Joshi et al. (2003) Joshi, Y. C., Pandey, A. K., Narasimha, D., Sagar, R., & Giraud-Héraud, Y. 2003, A&A, 402, 113
- Kaaret (2002) Kaaret, P. 2002, ApJ, 578, 114
- Khokhlov et al. (1993) Khokhlov, A., Müller, E., & Höflich, P. 1993, A&A, 270, 223
- Khokhlov et al. (1997) Khokhlov, A., Oran, E. S., & Wheeler J. C. 1997, ApJ, 478, 678
- Khokhlov (2001) Khokhlov, A. 2001, astro-ph/0008463
- Kraus & Dixon (1965) Kraus, J. D., & Dixon, R. S. 1965, AJ, 70, 324
- Kurucz (1995) Kurucz, R. 1995, Atomic Line Data (R.L. Kurucz and B. Bell) Kurucz CD-ROM No. 23. Cambridge, Mass.: Smithsonian Astrophysical Observatory
- Leonard & Filippenko (2001) Leonard, D. C., & Filippenko, A. V. 2001, PASP, 113, 920
- Liu, Jeffery, & Schultz (1997) Liu, W., Jeffery, D. J., & Schultz, D. R. 1997, ApJ, 483, L107
- Livne (1999) Livne, E. 1999, ApJ, 527, L97
- Livne (2004) Livne, E. 2004, in Cosmic Explosions in Three Dimensions, ed. P. Hoflich, P. Kumar & J. C. Wheeler (Cambridge: Cambridge University Press), 110
- Livne et al. (2005) Livne, E., Asida, S. M., & Höflich P. 2005, ApJ, 632, 443
- Lynas-Gray et al. (1995) Lynas-Gray, A. E., Seaton, M. J., & Storey, P. J. 1995, Journal of Physics B Atomic Molecular Physics, 28, 2817
- McConnachie et al. (2005) McConnachie, A. W., Irwin, M. J., Ferguson, A. M. N., Ibata, R. A., Lewis, G. F., & Tanvir, N. 2005, MNRAS, 356, 979
- Middleditch & Kristian (1984) Middleditch, J., & Kristian, J. 1984, ApJ, 279, 157
- Mihalas (1978) Mihalas, D. 1978, Stellar Atmospheres (2nd ed; New York: Freeman), 650
- Minkowski (1939) Minkowski, R. 1939, ApJ, 89, 156
- Morton (1991) Morton, D. C. 1991, ApJS, 77, 119
- Niemeyer & Woosley (1997) Niemeyer, J., & Woosley, S. E. 1997, ApJ, 475, 740 & 524, 290
- Paczyński (1985) Paczyński, B. 1985, in Cataclysmic Variables and Low-Mass X-Ray Binaries, ed. D. Q. Lamb and J. Patterson (Dordrecht: Reidel), 1
- Patchett et al. (1985) Patchett, B. E., Stickland, D. J., Crilly, D., & Wood, R. 1985, The Observatory, 105, 232
- Pavlovsky et al. (2004) Pavlovsky, C., et al. 2004, in ACS Instrument Handbook, Version 5.0, (Baltimore: STScI)
- Phillips (1993) Phillips, M. M. 1993, ApJ, 413, L105
- Phillips et al. (1987) Phillips, M. M., et al. 1987, PASP, 99, 592
- Phillips et al. (1999) Phillips, M. M., Lira, P., Sunzeff, N. B., Schommer, R. A., Hamuy, M., & Maza, J. 1999, AJ, 118, 1766
- Plewa et al. (2004) Plewa, T., Calder, A. C., & Lamb, D. Q. 2004, ApJ, 612, L3
- Rich et al. (2005) Rich, R. M., Corsi, C. E., Cacciari, C., Federici, L., Fusi Pecci, F., Djorgovski, S. G., & Freedman, W. L. 2005, AJ, 129, 2670
- Röpke et al. (2003) Röpke, F. K., Niemeyer, J. C., & Hillebrandt, W. 2003, ApJ, 588, 952
- Röpke & Hillebrandt (2005) Röpke, F. K., & Hillebrandt, W. 2005, A&A, 429, L29
- Ruiz-Lapuente & Lucy (1992) Ruiz-Lapuente, P., Lucy, L. 1992, ApJ, 400, 127
- Sjouwerman & Dickel (2001) Sjouwerman, L. O., & Dickel, J. R. 2001, AIP Conf. Proc. 565, Young Supernova Remnants, ed. S. S. Holt and U. Hwang (AIP), 433
- Spencer & Burke (1973) Spencer, J. H., & Burke, B. F. 1973, ApJ, 185, L83
- Stanek & Garnavich (1998) Stanek, K. Z., & Garnavich, P. M. 1998, ApJ, 503, L131
- Thielemann, Nomoto & Hashimoto (1994) Thielemann F.-K., Nomoto K., Hashimoto M. 1994, in: Supernovae, Les Houcheseds S.S. Bludman R., Mochkovitch J., Mochkovitch J., Zinn-Justin ElsevierAmsterdam, p 629
- Uenishi, Nomoto, & Hachisu (2003) Uenishi, T., Nomoto, K., & Hachisu, I. 2003, ApJ, 595, 1094
- van den Bergh (1994) van den Bergh, S. 1994, ApJ, 424, 345
- van den Bergh (2002) van den Bergh, S. 2002, AJ, 123, 2045
- Verner et al. (1996) Verner D. A., Ferland, G. J, Korista, K. T., Yakovlev, D. G. 1996, ApJ, 465, 487
- Wang et al. (2001) Wang, L., Howell, A., Höflich, P., & Wheeler, J. C. 2001, ApJ, 550, 1030
- Webbink (1984) Webbink, R. F. 1984, ApJ, 277, 355
- Whelan & Iben (1973) Whelan, J., Iben Jr., I. 1973, ApJ, 186, 1007
- Yoon, Langer, & Scheithauer (2004) Yoon, S.-C., Langer, N., & Scheithauer, S. 2004, A&A, 425, 217
- Yoon & Langer (2004) Yoon, S. C. & Langer, N. 2004, A&A, 419, 623