Detonating Failed Deflagration Model of Thermonuclear Supernovae I. Explosion Dynamics
Abstract
We present a detonating failed deflagration model of Type Ia supernovae. In this model, the thermonuclear explosion of a massive white dwarf follows an off-center deflagration. We conduct a survey of asymmetric ignition configurations initiated at various distances from the stellar center. In all cases studied, we find that only a small amount of stellar fuel is consumed during deflagration phase, no explosion is obtained, and the released energy is mostly wasted on expanding the progenitor. Products of the failed deflagration quickly reach the stellar surface, polluting and strongly disturbing it. These disturbances eventually evolve into small and isolated shock-dominated regions which are rich in fuel. We consider these regions as seeds capable of forming self-sustained detonations that, ultimately, result in the thermonuclear supernova explosion.
Preliminary nucleosynthesis results indicate the model supernova ejecta are typically composed of about of silicon group elements, of iron group elements, and are essentially carbon-free. The ejecta have a composite morphology, are chemically stratified, and display a modest amount of intrinsic asymmetry. The innermost layers are slightly egg-shaped with the axis ratio and dominated by the products of silicon burning. This central region is surrounded by a shell of silicon-group elements. The outermost layers of ejecta are highly inhomogeneous and contain products of incomplete oxygen burning with only small admixture of unburned stellar material. The explosion energies are erg.
Subject headings:
hydrodynamics — nuclear reactions, nucleosynthesis, abundances — supernovae: general1. Introduction
Almost half a century ago, Hoyle & Fowler (1960) proposed that some supernovae may originate from the degenerate remnants of stellar evolution. These objects are known as Type Ia supernovae (SN Ia) and are commonly believed to be the end points of the evolution of intermediate mass stars in close binary systems (Whelan & Iben, 1973).
The two most attractive theories of formation of Type Ia supernovae are the single-degenerate (SD; Whelan & Iben, 1973; Nomoto, 1982; Starrfield et al., 2004; Yoon, Langer, & Scheithauer, 2004) and double-degenerate (DD; Iben & Tutukov, 1984; Webbink, 1984) scenarios. The observational evidence necessary to discriminate which formation channel is preferred in nature remains indirect and fragmentary (Branch et al., 1995; Livio & Riess, 2003; Mannucci, Della Valle, & Panagia, 2006, and references therein), in striking contrast to that of Type II supernovae. Evidence supporting the SD scenario has been collected only recently and in some cases requires more careful analysis. Some examples include observations of accreting massive white dwarfs (Lanz et al., 2005; Suleimanov & Ibragimov, 2003), evidence of hydrogen-rich material in the vicinity of the supernova, likely associated with a companion star hamuy+03, and the presence of the fast moving nondegenerate star inside a post-Type Ia supernova remnant (Ruiz-Lapuente et al., 2004), a possible companions of the supernova progenitor. In the case of the DD formation channel, several close binary white dwarf systems with total mass around Chandrasekhar mass have been identified during the last few years (Napiwotzki et al., 2003, 2005), essentially confirming double degenerates as prospective progenitors of thermonuclear supernovae.
Here we limit our considerations to a single-degenerate scenario in which the ignition of the degenerate matter takes place in the core of a Chandrasekhar-mass white dwarf. Only a small difference is expected between the outcomes of the core ignition of a massive white dwarf formed through either the SD or DD channel. In the latter case, the explosion is perhaps born in the core of a massive rotating white dwarf (Piersanti et al., 2003), a remnant of the final merger phase that does not result in an instantaneous explosion (Guerrero, García-Berro, & Isern, 2004).
In defining the initial conditions for multidimensional hydrodynamic models, we were guided in this study by results of the recent analytic (Garcia-Senz & Woosley, 1995; Wunsch & Woosley, 2004; Woosley, Wunsch, & Kuhlen, 2004) and preliminary numerical (Höflich & Stein, 2002; Kuhlen, Woosley, & Glatzmaier, 2006) studies of conditions prevailing in the white dwarf’s core just prior to the thermonuclear runaway. Our limited knowledge of that evolutionary phase grants us certain freedom in defining starting models. Both the number of the ignition points and the timing of the ignition are free parameters of the current models.
Following the failure of carbon (Arnett, 1969; Arnett, Truran, & Woosley, 1971; Arnett, 1974) and helium detonation models (Livne & Arnett, 1995), explosion modeling has focused on deflagration models and their derivatives. This preference has been firmly established after the apparent success of parametrized one-dimensional pure deflagration models (Nomoto, Sugimoto, & Neo, 1976; Nomoto, Thielemann, & Yokoi, 1984). They, along with the later variant known as a delayed-detonation model (Khokhlov, 1991; Woosley, 1990; Arnett & Livne, 1994b) brought the parametrized models into qualitative agreement with observations (Höflich & Khokhlov, 1996).
Multi-dimensional studies initially included both 2-dimensional models of deflagrations (Müller & Arnett, 1982, 1986; Livne, 1993; Livne & Arnett, 1993) and detonations (Livne & Arnett, 1995). During the last decade, sophisticated 3-dimensional models have dominated the scene. Central single-point (Khokhlov, 2000; Reinecke, Hillebrandt, & Niemeyer, 2002; Gamezo et al., 2003) as well as multi-point ignition deflagrations (Reinecke, Hillebrandt, & Niemeyer, 2002; Röpke et al., 2006; Schmidt & Niemeyer, 2006; Garcia-Senz & Bravo, 2005) seem to produce subluminous events with highly mixed ejecta. Although models with a parametrized deflagration-to-detonation transition (Gamezo, Khokhlov, & Oran, 2004, 2005; Golombek & Niemeyer, 2005) appear to address both deficiencies, the mechanism behind the transition to detonation demands explanation.
There exists evidence (Höflich et al., 2002, 2004; Kozma et al., 2005, but see also Blinnikov et al. (2006)) that the compositional structure of the ejecta obtained in multi-dimensional centrally-ignited deflagrations may not be compatible with observations. At the same time, spectroscopic and polarization observations of several SNe Ia suggest the existence of strongly inhomogeneous outer ejecta layers rich in intermediate elements (Chugai, Chevalier, & Lundqvist, 2004; Wang et al., 2004; Kasen & Plewa, 2005; Leonard et al., 2005). These two apparently contradictory requirements can possibly be reconciled within a class of hybrid models that combine deflagration and detonation within a single evolutionary sequence. Here we introduce a detonating failed deflagration (DFD) model, a generalization of our early exploratory study (Plewa, Calder, & Lamb, 2004, hereafter PCL), in which both essential elements are naturally present. In this model, the inhomogeneities in the outer ejecta layers result from the large scale perturbation of the surface stellar layers induced by an off-center deflagration that fails to unbind the star. In the long term, that perturbation eventually leads to the formation of isolated shock-dominated regions that serve as ignition points for a detonation. The resulting event is luminous with a composite ejecta structure consisting of smoothly distributed detonation products in the central regions surrounded by inhomogeneous, turbulent-like outer layers composed of material partially burned in the deflagration.
Our numerical investigations include certain simplifications with the assumption of axisymmetry being potentially the most important one. This, however, will allow us to conduct a small parameter study exploring the dependence of the explosion parameters on the initial conditions. In turn, for the first time, we will be able to offer evidence that the simplifying assumptions regarding the geometry may not be the major deficiency of our models.
2. Methods
We study the hydrodynamic evolution of a massive white dwarf using the flash code (Fryxell et al., 2000). flash has been the subject of rather extensive verification and validation in both subsonic and supersonic regimes (Calder et al., 2002; Weirs et al., 2005). We used a customized version of the code based on the flash2.4 release with specialized modules designed to model deflagrations and detonations. We recorded the history of individual fluid elements with tracer particles for the purpose of future detailed nucleosynthesis studies.
2.1. Reactive hydrodynamics
We solved the time-dependent reactive Euler equations of self-gravitating flow in cylindrical geometry assuming axial symmetry. The non-reactive set of equations were extended by an advection-diffusion-reaction (ADR) equation describing the evolution of a deflagration front. The solution to the ADR equation was obtained with the help of a flame capturing method (Khokhlov, 1995). The flash implementation has been the subject of verification (Vladimirova, Weirs, & Ryzhik, 2006) with the results of the application to turbulent flames closely matching the original implementation (Zhang et al., 2006).
2.2. Flame model revision
For the present application, several elements of the original ADR scheme were modified. In particular, careful analysis of the original three-stage flash burner (Calder et al., 2004, PCL) revealed that it overestimated the amount of energy produced by burning the stellar mix to nuclear statistical equilibrium (NSE) at densities typical of the stellar core. As a consequence, the nuclear ashes were both too hot and too rarefied, with buoyancy effects overestimated by a factor of . This led to a much larger acceleration of the burned material, shorter evolutionary time scales (from ignition to bubble breakout), a lower consumption of stellar fuel and a correspondingly lower degree of pollution of the surface layers. The current scheme captures the energetics of the deflagrating material more closely. We also introduced a revised formula for the laminar flame speed that better approximates the results of Timmes & Woosley (1992).
2.2.1 Thermonuclear burning
Following Khokhlov (1991, 2000), the evolution of a deflagrating stellar material can be considered as a sequence of largely independent processes. Carbon burning (stage I) is followed by relaxation toward nuclear statistical quasi-equilibrium (NSQE) that produces silicon-group nuclei (stage II). Eventually, the matter relaxes toward nuclear statistical equilibrium (NSE) producing iron-group nuclei (stage III). In the approximate burner, this is modeled through modifying the composition in all three stages. Stage I converts carbon into while is produced in stage II by the “burning” of and . We also extended the original scheme by introducing a “light nucleus” that accounts for the presence of free alpha particles and protons in the very high density and temperature regime (stage III, see below).
The original flash approximate burning scheme assumed the energy release was a simple sum of the nominal differences between the binding energy of the initial C/O mix and the burned material, , independent of density. This is over 70% more than the energy release obtained by Khokhlov (1983, Fig. 2, ) for the densities of interest during the initial explosion stages, . Our revised scheme uses results obtained with the torch47 network (Timmes, 2001) in the self-heating mode. The outcome of such calculations depends on the initial temperature of the fuel. Calculations also need to be conducted for long enough to guarantee a complete burn.
In our first set of calculations, we advanced the network for a fixed amount of time, , where s is the hydrodynamic (free-fall) time scale (Fowler & Hoyle, 1964; Arnett, 1996). Calculations were started using several different initial temperatures of the mixture, K. We found a relatively weak dependence of the energy release on the initial temperature (Fig. 1)

and adopted K in subsequent calculations.
Once the initial temperature was fixed, we turned our attention to studying the time-dependence of the energy release. We found that for the bulk of the energy is released within (Fig. 2).

In the supernova calculations that follow, we used the energy release obtained for K and (thick solid line in Fig. 2). The energy release was tabulated as a function of density with resolution 0.1 dex and linearly interpolated. The flame extinction was modeled by smoothly decreasing the original energy release for densities . No energy was released for densities below .
In contrast to the original flash implementation of stage III in which was the sole product of burning, here we introduced additional “light nuclei” composed of alpha particles and protons. This allowed us to better approximate the temperature, and in turn the buoyancy and dynamics of the Rayleigh-Taylor unstable burning front, especially at early times. As before, we used the torch47 nuclear network in an isochoric self-heating mode of burning to determine the composition of the light nuclei (Fig. 3).

These results appeared insensitive to the particular choice of the initial temperature or the final time provided the network was evolved for at least .
2.2.2 Coupling to Hydrodynamics
In addition to tracing the compositional evolution of the nuclear ashes, the implementation of the Khokhlov’s three-stage burner involves the coupling of the energy source term to hydrodynamics. In what follows we are primarily concerned with the early evolutionary stages when the physical time scales associated with nuclear burning are much shorter than a flame crossing time for computational zones (Khokhlov, Müller, & Höflich, 1993; Arnett & Livne, 1994b; Reinecke, Hillebrandt, & Niemeyer, 2002). When the evolution of the burning region is relatively slow and the expansion of the star is insignificant, as it is during the early evolution of centrally ignited deflagrations, a step-wise form of the energy production rate leads to large (about two orders of magnitude) rapid fluctuations in the energy deposition. These localized discrete “explosions” occur in partially-burned material where degeneracy is lifted and are a source of pressure waves and velocity fluctuations of order km/s. A similar problem in the context of modeling deflagrations fronts was noted by Khokhlov, Müller, & Höflich (1993) who used, however, a completely different procedure to model the flame evolution. The origin of the problem, i.e. discrete representation of a thin unresolved burning front, is common to both studies.
The impact of the numerical artifact just described can be limited by appropriately scaling the energy deposition in stage II (no such procedure is needed in stage I which always operates under strongly degenerate conditions and no energy is released in stage III). In the simulations presented here, the energy generation rate for stage II was kept at 1% of its nominal value throughout simulations. Given the advection time scale s, this procedure affected the energy release only at very high densities for which the problem of spurious numerically-induced flow perturbations was originally identified. Alternatively, one can also consider less intrusive procedures in which the energy generation rate is limited only for times s. Imposing less strict limitations on the energy release was found to universally produce velocity perturbations of magnitude comparable to that of large scale flows.
2.2.3 Flame speed calibration
Several factors may cause the numerical flame speed propagation to differ from the prescribed laminar flame speed in one dimension. Vladimirova, Weirs, & Ryzhik (2006) have investigated in some detail the influence of numerical resolution, evolution with a superimposed constant background velocity mimicking hydrodynamic advection (i.e. to verify Galilean invariance), and the impact of velocity gradients across the flame front (presumably caused by thermal expansion in real applications).
In the supernova context, given the degenerate nature of the equation of state, thermal expansion is controlled by the energy release which chiefly depends on the fuel density and composition (Timmes & Woosley, 1992). Therefore whenever the flame energetics are modified, an appropriate calibration of the numerical parameters controlling the numerical flame speed needs to be done for the numerical flame speed to match the nominal (laminar) flame speed.
The calibration procedure is relatively simple, but tedious because the numerical flame speed depends on density, composition, and numerical resolution. Given our focus is on the evolution of progenitors composed of a 50/50 carbon/oxygen mix, our flame speed calibration was limited to that composition. We performed a number of one-dimensional flame propagation simulations in Cartesian geometry. Models were obtained on grids with lengths between and with km, and using between and zones. The typical grid resolution was km. The results showed only weak dependence on the resolution. The flame propagation was, however, somewhat vulnerable to background flow fluctuations generated by the flame front motion that freely propagated and partially reflected off the boundaries. Although we used non-reflecting (zero gradient) boundary conditions, such reflections are understandable given the subsonic nature of the problem. In our analysis we used data from carefully selected long evolutionary sequences computed on the largest grids and at the highest possible resolution.
Our calibration procedure was applied toward a slightly modified formula originally proposed by Timmes & Woosley (1992, Eq. 43):
with , , , and . This improved formula reproduces Timmes & Woosley (1992) results for a C/O 50/50 mix to within 15% for densities between and . Finally, this has been adjusted to account for thermal expansion due to the torch47 energetics:
where
is polynomial density-dependent correction factor based on our calibration calculations and , , , , and . The final formula reproduces Timmes & Woosley (1992, Table 3) results to within 5% for densities in the range and .
2.2.4 Hybrid burning scheme
Our initial investigations into late evolutionary stages of fizzle off-center deflagrations (PCL) provided strong evidence that the conditions inside the confluence region at the stellar surface are appropriate for creating a detonation. We observed that both densities and temperatures were high enough for the burning time scale to become shorter than hydrodynamic time scale. We also anticipated that the shocked region would remain confined for an extended period of time sufficient to develop a self-sustained detonation. We were unable, however, to study that process in detail at that time. The burning module could not reliably discriminate between shocked fuel (a legitimate detonation site) and compressed partially burned matter. Here we introduce a hybrid burning scheme to allow for the simultaneous presence of deflagrations and distributed nuclear burning in the simulation. Deflagrations are modeled using the ADR flame-capturing scheme (Khokhlov, 1995; Vladimirova, Weirs, & Ryzhik, 2006) with modifications as outlined above. The distributed burning is calculated using the flash aprox13t 13-isotope alpha network (G. Jordan 2005, private communication) This network is an extension of the original flash approx13 network and includes temperature coupling for increased stability of calculations in the NSE regime Müller (1986).
The first step in our our hybrid burning procedure is to identify shocked zones. This is done using a multidimensional shock detection module adopted from the sppm code (Anderson & Woodward, 1995) with pressure jump across the shock, . If the temperature in such zones is high enough for nuclear burning ( K), a progress variable used by the ADR flame module is reinitialized and the numerical flame speed is set to zero. The flame module is subsequently activated only if the flame speed is greater than zero and the material is pure fuel (as indicated by, for example, a small abundance of nuclei not participating in the simplified three-stage burner). Otherwise, the nuclear network is called but only if the following conditions are fulfilled simultaneously: (1) both the density and temperature are in the range appropriate for the network calculations, (2) the zone is outside a shock front, (3) the deflagration module was not used, and (4) the ADR progress variable is small. The first condition limits network calculations to high-density () high-temperature ( K) regimes. Condition (2) follows from the conclusions of Fryxell, Müller, & Arnett (1989) who found that the correct speed of detonation waves can be obtained only in models with burning disallowed inside unrelaxed numerical shock profiles. Conditions (3) ensures only one physical burning process, either distributed burning following shock heating or deflagration, operates at a time. Finally, condition (4) prevents burning from occurring in regions preheated by an extended diffusive tail of the ADR flame capturing scheme and at the same time allows for burning to continue after the detonation wave sweeps through partially deflagrated material. By making the progress variable threshold for use of nuclear network slowly increasing with time, we also prevented spurious (distributed) burning in the dense central regions perturbed by ascending deflagrating material.
The above scheme captures the essential behavior of both deflagrations and wave-induced distributed burning. It allows for the transition to detonation in shock-heated regions away from deflagrating material and enables burning in shocked, partially deflagrated material. The above selection rules were developed and improved based upon experience accumulated in the course of several numerical experiments and, as such, offers a practical rather than ideal recipe for modeling deflagrations and detonations in the same physical setting including a possible deflagration to detonation transition.
Once the detonation wave is launched, a combination of a PPM hydrodynamic solver, a multidimensional shock detection algorithm, and a aprox13t nuclear burning module was used to advance the evolution in time. The evolution of the detonation wave on a large scale is expected to be captured correctly given that the thickness of the wave is much smaller than the stellar radius (Falle, 2000). We did not find it necessary to rescale nuclear reaction rates in order to obtain the correct propagation of the detonation speeds (Arnett & Livne, 1994b); excluding the unrelaxed shock profile from burning appeared sufficient to yield physical solutions.
2.3. Some comments on numerical model limitations
One of primary motivations behind development of a hybrid burning scheme was desire to mitigate a risk of spurious detonation ignitions. The existence of such spurious ignitions is a well-documented fact in astrophysical literature (Fryxell, Müller, & Arnett, 1989). Here we only briefly discuss the most typical causes for spurious ignitions and possible ways to prevent them from polluting hydrodynamical models.
Perhaps the most common cause for spurious detonation ignitions is a numerically-induced mixing of hot ashes and cold fuel. By advecting a material interface (contact discontinuity) separating ashes from fuel, Fryxell, Müller, & Arnett (1989) demonstrated that such mixing may result in artificial preheating of fuel, its ignition, and ultimately formation of a combustion wave. Related to this is a problem of species conservation by nonlinear Eulerian advection schemes. Under certain conditions numerical modification of fuel (or partially burned material) composition may change burning energetics. Either extinction or enhancement of burning may follow. To our knowledge, neither numerical species diffusion nor species non-conservation can be completely eliminated from Eulerian simulations of realistic nonlinear systems. Our hybrid burning scheme attempts to limit possible influence of both effects by constraining burning to regions occupied by pure fuel.
Transition to detonation can also follow an artificial boosting of an acoustic perturbation. Such perturbations lead to local variations in temperature and under degenerate conditions temperature is a sensitive function of (relatively small thermal) pressure. Given strong dependence of nuclear reactions on temperature, it is conceivable that even small but sustained heating may strengthen acoustic waves and eventually cause spurious transition to detonations. Typically, however, small acoustic fluctuations suffer from strong damping by numerical diffusivity and such spurious transitions to detonations are likely to occur only if nuclear burning is allowed inside numerical (unrelaxed) shock profiles. The cure for this problem is to eliminate burning in regions occupied by shocks (Fryxell, Müller, & Arnett, 1989) and, as we mentioned above, such a filter is employed in our calculations.
Finally, application of nuclear burning source term in our calculations is limited to regions with sufficiently high densities and temperatures. That is, we wish to consider a feedback from nuclear burning only if the nuclear timescale is short enough to influence hydrodynamics. This approach not only saves computational time, but more importantly prevents the nuclear network from being fed with input data representing low-density regions where evolution has a highly transient character and is not correctly captured in our calculations.
To summarize, numerical computations of reactive flows pose extreme challenges and require very careful treatment. We attempted to address several known and some newly emerged problems related to coupling reactive source terms to hydrodynamics in great detail. The impact of some of these problems could only be limited, but not completely eliminated. For example, in our models no nuclear burning is allowed inside numerical shock profiles. However, our particular choice of parameters defining numerical shock profile may not be adequate in all situations affecting evolution of shocks and acoustics in unwanted manner. Poor numerical resolution only adds to the algorithmic inefficiency further limiting predictive abilities of our models.
Clearly, successfully resolving technical problems of our computations is of high priority and such aspects should be remembered when interpreting our results. At the same time, however, one should also keep in mind that our model involves several simplifying assumptions (i.e., we consider a non-rotating, non-convective, non-magnetized chemically homogeneous progenitor), and as such it is a blend of approximate numerics and unique choice of parameters defining physical scenario.
2.4. SN Ia explosion code verification: central deflagrations
Given that both the basic hydrodynamic module as well as the FLASH implementation of the flame capturing scheme have been extensively verified and, albeit to a limited extent, also validated in the past (Calder et al., 2002; Weirs et al., 2005; Vladimirova, Weirs, & Ryzhik, 2006), our verification is solely limited to code-to-code comparison in the context of thermonuclear supernova explosion modeling. Although code-to-code comparison is widely popular among computational physicists, the usefulness of this approach is hotly debated (Trucano, Pilch, & Oberkampf, 2003). For one, even perfect agreement between the simulation results of two codes does not offer proof of their correctness. Moreover, the scope of such an exercise is usually limited by the specific capabilities of the code, the availability of the results, the completeness of documentation, and the relevance of the performed test to the actual problem at hand, to name a few. Here we accept the obvious deficiencies of the code-to-code comparison approach and use highly relevant and state-of-the-art calculations as a benchmark. Again, due to the novelty of our ultimate application, no data are available for comparison, though they will hopefully become available through independent calculations. Ultimately, the model will be validated using accumulated observational evidence. Methodology and methods required in such assessments are presented in a companion paper (Kasen & Plewa, 2006, see also Blinnikov et al. (2006)).
2.4.1 Simulation setup
For our comparison study we selected a family of centrally ignited deflagration models obtained by the Garching group (Reinecke, Hillebrandt, & Niemeyer, 2002; Röpke & Hillebrandt, 2005b, and references therein). These studies are very well-documented and their results compare favorably to those obtained by other groups (Gamezo et al., 2003; Gamezo, Khokhlov, & Oran, 2004). When comparing results, we considered the overall morphology of the explosion (flame front structure), the energetics and the approximate ejecta composition of the 2-dimensional explosion calculations reported by Reinecke, Hillebrandt, & Niemeyer (2002) and Röpke & Hillebrandt (2005a). Our choice of 2-D Garching models is natural given our calculations to follow also assume axial symmetry.
In a benchmark study we used flash2.4 customized for the thermonuclear supernova explosion problem. We used a PPM module for real gas inviscid hydrodynamics and the Helmholtz equation of state required by the degenerate conditions encountered in the white dwarf interior. All calculations were done with Courant factor . This choice of time step limiter may appear somewhat conservative, but allows for better coupling between different physical processes.
Gas self-gravity was accounted for by solving the Poisson equation through multipole expansion. We found that linear momentum is poorly conserved in explosion calculations when the expansion series is truncated too early, especially when the explosion displays significant asymmetries. In test calculations done assuming a spherical potential, the bulk of the stellar material displayed motion of a few hundred km/s after only a few seconds of evolution. The momentum conservation gradually improved as additional higher order terms were included in the expansion. In what follows we used 10 multipole moments and found excellent momentum conservation for all initial conditions considered.
We used a 2-dimensional cylindrical grid and assumed axial symmetry. This implied imposing a reflecting boundary condition at . We applied outflow conditions at the remaining boundaries. In our verification calculations the computational domain covered a rectangular region with km. We used the adaptive capabilities of the flash code to create several levels of refinement up to a maximum resolution of 8 km. We do not expect the dynamical evolution of low density gas or at large distances from the stellar center to play an important role in explosion simulations and therefore adaptive refinement was used only for radii km and if the gas density . Self-gravity calculations, on the other hand, require good resolution of dense regions and the grid refinement was forced to the highest allowed resolution whenever the gas density . In addition, the innermost km of the star have always been resolved with the finest zones. In regions where adaptivity was allowed, AMR patches were created dynamically if the local density contrast exceeded or the total velocity changed by more than 20%. Furthermore, we ensured the flame front was always refined to the finest level by forcing refinement whenever the fractional change of the flame progress variable exceeded .
2.4.2 Initial model
The supernova progenitor was an isothermal, K, white dwarf composed of equal mass fractions of carbon and oxygen. With a central density of , the progenitor had a radius km, total mass , and total energy erg. The progenitor was surrounded by a low density () and low temperature ( K) medium composed of pure helium. The stellar material and low density ambient medium were initially marked with a passively advected tracer that was set to and in those two regions, respectively. Subsequently, gas gravitational accelerations were multiplied by the tracer value in the course of the evolution, allowing us to prevent the ambient medium from collapsing onto the central object and limiting mass diffusion at the stellar surface.
The original progenitor model was constructed using a numerical discretization different from the one used in the hydrodynamic simulations and assuming a simplified equation of state. For that reason, the perfect hydrostatic equilibrium of the original model was destroyed as soon as it was interpolated onto the simulation mesh. Even though the mismatch between the two computational environments was relatively small, very strong acoustic oscillations quickly developed making such a model unsuitable for further investigations. Moreover, the oscillations did not decay with time, presumably due to both low dissipation of the hydrodynamic scheme and the strong degeneracy of the medium.
We constructed a stable progenitor model using a modified variant of the damping method of Arnett (1994) in a 1-D flash simulation in spherical geometry. Our procedure combined a very slow diffusion of velocity together with a partial rather than complete (as in the original method) removal of excess momentum after each time step. We found that the complete removal of momentum prevented the model from reaching equilibrium. Damping process usually lasted several thousands of hydrodynamic steps. We examined the stability of the relaxed model by computing a sequence of hydrodynamic models without burning. Random velocity perturbations with amplitude of () were added to the inner core region of radius km. We observed the decay of the root mean square velocity with time, as expected in a stable model, provided the resolution was km or better (Fig. 4).

We also computed the evolution of an “effective” stellar radius corresponding to the volume occupied by gas with density representing the bulk of the stellar matter. The results are shown in Fig. 5.

As one can see, the model stellar radius shows significant evolution in computations with resolution km or worse; only a very modest () decrease of radius was observed in the better resolved models, and had no consequence for structure of the stellar core (i.e. possible temperature increase).
Unfortunately, close examination of the velocity field also revealed that while the overall stability of models improves with increasing resolution, small velocity perturbations not only do not decay but are amplified near the symmetry axis. This effect was especially strong in km resolution model where the velocity near the axis rapidly increased from the initially imposed to during the first s of the evolution (shown with the thin solid line in Fig. 6).

No significant increase in the magnitude of the spurious velocities was observed at later times, but the affected region expanded from the initial 1 to 3 zones by s. We observed very similar behavior in the km resolution model, although the velocities near the symmetry axis were ultimately somewhat smaller (). In contrast, the velocities smoothly decay from their initial values in the whole perturbed region in the km resolution model (shown with the thick solid line in Fig. 6). A similar slow decrease of the velocities near the symmetry axis was also observed in the km model.
After a stabilized progenitor model was interpolated onto the simulation mesh, a deflagration front was initialized around a small region at the stellar center. The flame front was located at
where is the unperturbed radius of the burned region (flame radius), is the flame radius perturbation amplitude, and controls the flame radius perturbation wavelength. Random velocity perturbation were added to the inner core region following the procedure described above. By introducing a small stochastic component (“cosmic variance”) into the problem, we were able to examine the robustness of our results. In particular, it is essential to verify that the observables (i.e. the explosion energy) do not show strong dependence on small perturbations in the initial conditions, in accord with the observed intrinsic homogeneity of SN Ia.
2.4.3 Centrally ignited benchmark models
We performed a comprehensive survey of two-dimensional centrally ignited deflagration models. The database contains 33 models. All models were evolved until s when burning essentially ceased. For each model we varied the flame perturbation wavelength and random velocity perturbation pattern (through the seed perturbation). We explored the sensitivity of the results to mesh resolution by resolving the central stellar region of radius t for times . Resolution coarsening in this central region was done in equal intervals of time. For times , the resolution was equal to a default value of km. The initial flame radius and perturbation amplitude were in all cases fixed at km and , respectively. Table 1
| Model | [km] | [km] | [s] | aaTotal energy at s. [ erg] | |
| n7d1r10t15b | 7 | 1 | 1000 | 1.5 | 0.86 |
| n7d1r10t15c | 7 | 1 | 1000 | 1.5 | 0.97 |
| n9d1r10t15b | 9 | 1 | 1000 | 1.5 | 0.75 |
| n9d1r10t15c | 9 | 1 | 1000 | 1.5 | 0.66 |
| n11d1r10t15b | 11 | 1 | 1000 | 1.5 | 0.75 |
| n11d1r10t15c | 11 | 1 | 1000 | 1.5 | 0.66 |
| n11d2r05t10a | 11 | 2 | 500 | 1.0 | 0.27 |
| n11d2r05t10b | 11 | 2 | 500 | 1.0 | 0.38 |
| n11d2r05t10c | 11 | 2 | 500 | 1.0 | 0.44 |
| n11d2r05t10d | 11 | 2 | 500 | 1.0 | 0.38 |
| n11d2r05t10e | 11 | 2 | 500 | 1.0 | 0.38 |
| n11d2r10t10a | 11 | 2 | 1000 | 1.0 | 0.35 |
| n11d2r10t10b | 11 | 2 | 1000 | 1.0 | 0.36 |
| n11d2r10t10c | 11 | 2 | 1000 | 1.0 | 0.42 |
| n11d2r10t10d | 11 | 2 | 1000 | 1.0 | 0.38 |
| n11d2r10t10e | 11 | 2 | 1000 | 1.0 | 0.39 |
| n11d2r10t10f | 11 | 2 | 1000 | 1.0 | 0.36 |
| n11d2r10t15a | 11 | 2 | 1000 | 1.5 | 0.56 |
| n11d2r10t15b | 11 | 2 | 1000 | 1.5 | 0.64 |
| n11d2r10t15c | 11 | 2 | 1000 | 1.5 | 0.60 |
| n11d2r10t15d | 11 | 2 | 1000 | 1.5 | 0.52 |
| n11d2r10t15e | 11 | 2 | 1000 | 1.5 | 0.58 |
| n11d2r20t15b | 11 | 2 | 2000 | 1.5 | 0.66 |
| n11d2r20t20b | 11 | 2 | 2000 | 2.0 | 0.54 |
| n11d2r40t20b | 11 | 2 | 4000 | 2.0 | 0.54 |
| n11d2r40t20b3 | 11 | 2 | 4000 | 2.0 | 0.55 |
| n11d2r40t20b6 | 11 | 2 | 4000 | 2.0 | 0.52 |
| n11d2r40t15b | 11 | 2 | 4000 | 1.5 | 0.79 |
| n11d2r60t15b | 11 | 2 | 6000 | 1.5 | 0.79 |
| n13d1r10t15b | 13 | 1 | 1000 | 1.5 | 0.57 |
| n13d1r10t15c | 13 | 1 | 1000 | 1.5 | 0.69 |
| n15d1r10t15b | 15 | 1 | 1000 | 1.5 | 0.57 |
| n15d1r10t15c | 15 | 1 | 1000 | 1.5 | 0.52 |
presents a complete database of our benchmark models.111The database is available on-line at flash.uchicago.edu/t̃omek/Results/DFD/central/. The model identification tag name is constructed as a string n--d-r--t--ph where n-- denotes the perturbation pattern, d- describes the maximal grid resolution in the core region, r-- denotes a radius of the core region inside which enhanced resolution was used, t-- denotes the time up to which enhanced flame resolution was allowed, p distinguishes between different perturbation patterns, and finally h denotes the desired thickness of the flame front (in grid cells) in the ADR flame capturing module (see Appendix in Khokhlov, 1995). The default value of the numerical flame thickness was 4; we obtained two models, n11d2r40t30b3 and n11d2r40t30b6, in which the nominal flame thickness was varied by and %, respectively. The last column in Table 1 gives the total energy of the model (sum of kinetic, internal, and potential energies) at the final time, s.
Evolution in reference model
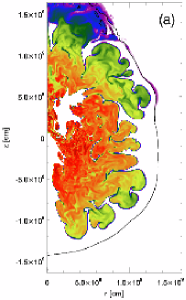
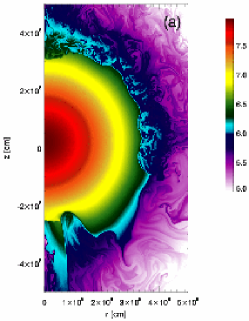
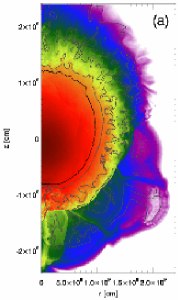
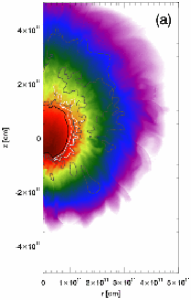
We use model n11d2r10t10a to illustrate major characteristics of a centrally ignited deflagration in our benchmark configuration (Fig. 7).
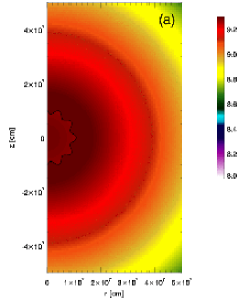
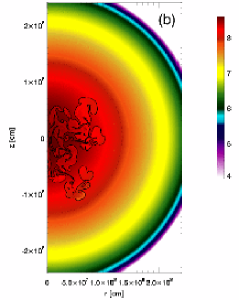
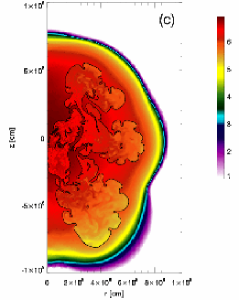
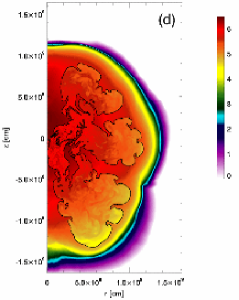
The density in this model at the initial time is shown in Fig. 7(a). The flame front has the shape of the initial regular perturbation. At a resolution of km, comparable to that of the highest resolution Garching group models at early times (Röpke et al., 2006, Fig. 3), the flame region is resolved into about 50 zones in radius. This initial configuration undergoes a dramatic evolution during the next second (Fig. 7(b)). After that time only 3 prominent bubbles are clearly identifiable and some parts of the flame begins forming disconnected regions (e.g. the region located near km). The flame leaves behind a significant amount of unburned material and a few isolated pockets of fuel can also be identified inside rising bubbles. The outermost parts of a highly convoluted flame front have reached km in radius. The star has expanded by % and the typical expansion velocities are . After another second ( s; Fig. 7(c)), the expansion of the outer stellar layers becomes slightly nonuniform due to the uneven acceleration caused by individual flame bubbles. The expansion velocity exceeds near the stellar surface. At this time one can still identify 3 large bubbles, but these are now more developed and occupy a much larger volume fraction. Their morphology does not change much at still later times ( s, the final time; Fig. 7(d)) as nuclear burning essentially quenches and the ejecta expansion becomes progressively radial.
Sensitivity to small perturbations
Given the highly nonlinear character of the Rayleigh-Taylor unstable deflagrating bubbles it is natural to ask how robust are the predictions offered by individual models. We studied this question by creating a sequence of models for a given set of primary model parameters (initial flame configuration and numerical resolution). The initial conditions for each member of a given sequence differed only by the pattern of small amplitude stochastic velocity added to the initially static progenitor model. Our metric for comparison is to examine the final ejecta morphology and integral model characteristics (temporal evolution of total energy, burning rate, flame surface area).
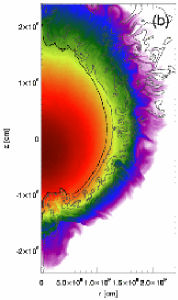
As an example we compare select models from a single sequence. Figure 8
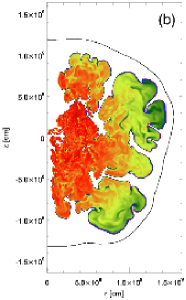
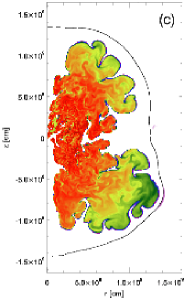
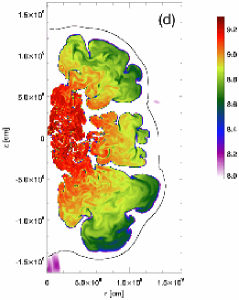
shows the ejecta temperature distribution at the final time in the sequence n11d2r10t15. The isocontour of gas density of is shown with the black line and can be identified with the stellar surface. Several comments can be made following inspection of Fig. 8.
It is encouraging to notice that the models show no axis-related bias, a numerical artifact that frequently pollutes axisymmetric hydrodynamic calculations. In particular, the structures developed near the symmetry axis ( cm) in models n11d2r10t15a (Fig 8(a)) and n11d2r10t15b (Fig 8(b)) are markedly different. There is also no visible difference in the amount and quality of the structure developing in the regions above ( cm) and below ( cm) the equator. Some models do develop structures near the equator (see,e.g., Fig 8(d)), but some others do not (see, e.g., Fig 8(c)). This allows us to conclude that possible defects due to the geometry representation do not affect our calculations in any significant way.
In all models considered here large scale structures (bubbles) several tens degrees in size dominate in the outer parts of the ejecta. In some models perhaps no more than 2 (Fig 8(c)) while in some others perhaps as many as 3 (Fig 8(d)) such large and distinct structures survive turbulent burning. These bubbles push ahead unburned material causing relatively mild deformation of the ejecta outer layers as indicated by shape of the density isocontour.
As discussed below, the explosion energies also appear sensitive to small perturbations. In the case of the n11d2r10t15 models, our limited sample shows the total variation in explosion energy foe (1 foe = erg) or % in the released energy (see Fig. 9(c)). This may indicate that small, naturally occurring variations in the internal structure of progenitors (expected to arise from the convective flows developing in their cores prior to runaway) may contribute to the intrinsic diversity of SN Ia. Addressing this interesting possibility requires more careful study, preferably using realistic multi-dimensional progenitor models.
Sensitivity to numerical resolution
From the modeler’s point of view, several simulation parameters may potentially affect the results and therefore need to be controlled. Given the high degree of complexity and highly non-linear character of our application, it is natural to expect that the model results will depend upon the numerical resolution. Convergence to the true 3-dimensional solution is not expected to occur in two dimensions due to, for example, differences between the physics of two- versus three-dimensional supernova turbulence (Khokhlov, 1995; Schmidt, Hillebrandt, & Niemeyer, 2006) and Rayleigh-Taylor instability (Kane et al., 2000; Chertkov, 2003). Nevertheless, it is still important to examine the sensitivity of our axisymmetric model predictions to numerical resolution.
In adaptive mesh simulations, the computational mesh is not necessarily a well-defined entity as the numerical discretization depends on the solution and is usually highly variable both in time and space. The simple procedure of doubling the grid resolution does not have its usual interpretation. Unlike uniform grid simulations, adaptive mesh refinement computations admit additional error into the solution by not resolving smooth or otherwise dynamically insignificant parts of the flow field. In addition, some errors, such as flow perturbations arising at the fine-coarse mesh interfaces, are unique to AMR discretization and not easy to characterize (Quirk, 1991; Weirs et al., 2005; Pantano et al., 2005).
As our earlier investigations have demonstrated, the morphology on small scales of the exploding models appears very sensitive to slight perturbations in the initial conditions, and might be useful only for making qualitative statements. A more quantitative comparison of the different models can be made using integral quantities. For example, variations in the final explosion energy are of great interest from the observational point of view, and several possible natural causes for such variations have been proposed (i.e. differences in the chemical composition and/or the rotation of the progenitor).
Here we discuss the role of mesh adaption on the evolution of the total energies, flame surface areas and the burning rates. Since as we mentioned before the evolution is rather sensitive to small perturbations, we chose to compare different families of models rather than individual family members. Figure 9
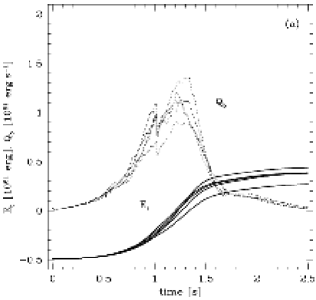
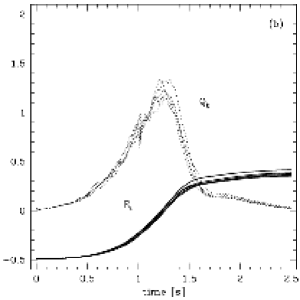
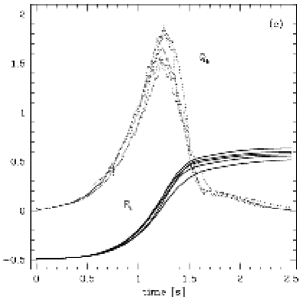
shows the evolution of the integral quantities in three families of the n11d2 sequence of benchmark models: n11d2r05t10 (left panel), n11d2r10t10 (middle panel), and n11d2r10t15 (right panel). The individual members of each family were obtained using slightly different random velocity perturbations. Compared to the n11d2r10t10 models, in models n11d2r05t10 the innermost region of enhanced resolution ( km) was limited to km in radius (as compared to km). The resolution in this region was decreased by a factor of 2 at s and by another factor of 2 at s. In the n11d2r10t15 family of models, this innermost region was derefined in two similar stages with the resolution ultimately decreased to its nominal value at s.
Several observations can be made following analysis of the the n11d2 sequence.
All n11d2 models produce explosions. The explosion energies are rather low, foe. In all cases the nuclear burning is most intense around s after the ignition. That period of rapid energy release lasts for about s with the densities dropping rapidly to by s. This is followed by a period of low, almost constant energy release during which in only exceptional cases a slight increase in energy generation was observed. At that time ( s), the burning takes place at densities and changes its character from active turbulent burning associated with vigorous creation of flame surface to a much milder, distributed mode of burning. By s the densities drop to and flame quenching results in a steady decrease in energy generation.
Models obtained with higher resolution produce more energetic explosions. The typical explosion energies vary from foe for the least resolved subsequence r05t10 to foe for the best resolved subsequence r10t15. Higher resolution also appears to make evolutionary trajectories more similar at early times (the curves run more closely in subsequence models r10t10 than in r05t10) but result in increasing diversity at late times (there are relatively large variations in energy generation rates around s in subsequence r10t15).
We found that not only the morphology, but also the integral quantities are sensitive to small perturbations in the progenitor. For example, the dispersion of explosion energies is about foe, even in relatively well-resolved simulations (e.g. subsequence r10t15). This may indicate that some of the observed diversity of supernovae might be produced by the nonlinear response of the explosion process to small variations in the initial conditions. Such variations from one progenitor to another are expected to exist in nature especially given the convective (turbulent) flow conditions prevailing in the stellar cores prior to thermonuclear runaway (see Woosley, 1990; Höflich & Stein, 2002; Kuhlen, Woosley, & Glatzmaier, 2006, and references therein). The contribution of such a purely stochastic component to the explosion process clearly deserves more careful study.
2.4.4 Comparison against Garching group models
We found good agreement between the main characteristics of our centrally ignited model explosions and the results of equivalent axisymmetric calculations presented by the Garching group. The overall evolution of the energy generation rate in the n11d2 model sequence is similar to that in model c3_2d_256 by (Reinecke, Hillebrandt, & Niemeyer, 2002, Fig. 3) and to that obtained earlier by (Niemeyer, 1995, ; see Reinecke, Hillebrandt, & Niemeyer (1999)). The energy generation in our model explosions displays a pronounced maximum reaching between in models n11d2r05t10 and n11d2r10t10. This compares very favorably to the result reported by Niemeyer (1995), Reinecke, Hillebrandt, & Niemeyer (2002), and more recently by Röpke (2005). The latter two studies reported peak energy generation rates . The rates obtained in models n11d2r10t15 are higher by about 50%. Such higher rates were reported by (Röpke et al., 2006) for some of their centrally ignited models, however these calculations were done in 3-dimensions. The energy generation rate in our models is initially smaller and increases at a faster rate than in the Garching models. The maximum generation rate is achieved at s, roughly s later than in the Garching models. In flash as well as in the Garching calculations the burning quenches s after the maximum.
Our model explosions are on average slightly more energetic than those reported in Garching studies. The typical explosion energies are between foe in our models while (Reinecke, Hillebrandt, & Niemeyer, 2002) and (Röpke & Hillebrandt, 2005a) reported explosions with energies and , respectively. It is conceivable that the higher initial energy generation rates obtained in the Garching calculations may result in the lower explosion energies of their models since the faster initial expansion leaves less time for the flame to develop and burn stellar fuel. Such discrepancies can be explained by differences in both the adopted flame dynamics model and the approximations used to describe the nuclear burning and not of serious concern in the context of the following results.
3. Detonating failed deflagrations
Limited by the assumption of axial symmetry, we considered off-center bubble ignitions in which the flame initially occupies a small spherically symmetric region(s) positioned at the symmetry axis ( cm). Two families of models were constructed, one with a single ignition point and the other with two ignition points. For the latter, we consider only simultaneous ignitions. although in principle the multiple ignition process could be extended in time (see, for example, Schmidt & Niemeyer (2006)).
Following our verification study, off-center explosion models were obtained at the maximum resolution of km. In models with two ignition points, the flame regions were initialized in different hemispheres. Table 2
| Model | [km] | [km] | [km] |
|---|---|---|---|
| Y12 | 12.5 | 50 | |
| Y25 | 25 | 50 | |
| Y50 | 50 | 50 | |
| Y100 | 100 | 50 | |
| Y70YM25 | 70 | -25 | 35 |
| Y100YM25 | 100 | -25 | 50 |
| Y75YM50 | 75 | -50 | 50 |
summarizes the parameters describing the initial flame and mesh configurations of the off-center ignition models. Here and are the locations of the ignitions points along the symmetry axis ( cm), and is the radius of flame regions. To keep the flame regions well-separated, the mesh resolution in the central km region was increased by a factor of 2 for a short period of time after ignition ( s in models Y70YM25 and Y100YM25 and s in model Y75YM50). This additional refinement was also necessary to adequately resolve the smaller bubbles ( km) used in model Y70YM25.
The computational domain extended up to km and km in single- and double-ignition point models, respectively. In anticipation of an extended and asymmetric evolution at early times, the region of adaptive meshing was extended to km in radius. The initial conditions did not include random velocity perturbations. All other simulation parameters were identical to those used in the verification study (see § 2.4.1).
3.1. Explosion phase
For no other reason than convenience and limits in computing power, early multi-dimensional investigations of white dwarf deflagrations assumed perhaps only slightly perturbed but otherwise spherically symmetric ignition conditions (Müller & Arnett, 1982; Livne, 1993; Arnett & Livne, 1994a; Khokhlov, 1995, 2000; Reinecke, Hillebrandt, & Niemeyer, 2002; Gamezo et al., 2003). Such a choice is not necessarily the most natural one given the white dwarf core is believed to be convective prior to runaway (Woosley, 1990; Garcia-Senz & Woosley, 1995; Woosley, Wunsch, & Kuhlen, 2004), an expectation supported by recent multi-dimensional hydrodynamic investigations (Höflich & Stein, 2002; Kuhlen, Woosley, & Glatzmaier, 2006). This led several groups to consider progressively more complex and realistic (although not necessarily correct!) initial flame configurations (Niemeyer, Hillebrandt, & Woosley, 1996; Garcia-Senz & Bravo, 2005; Röpke et al., 2006; Schmidt & Niemeyer, 2006).
Here we adopt a similar approach, but not being discouraged by the failure of an initial deflagration to produce a supernova, we continue our investigations through the following stages of evolution. Our preliminary investigations (PCL) indicated that the energy released in the deflagration may be used to compress the stellar surface layers thereby forming seed points for detonations. We were unable, however, to study that process in detail at that time, and only speculated about the possibility. Here, we revisit our original idea of a deflagration to detonation transition following a slightly off-center ignition.
3.1.1 Failed deflagration phase
In all models ignited off-center, the evolution initially proceeds in a way much similar to that described in PCL. Owing to strong buoyancy and the relative slowness of laminar burning, the whole burning region is quickly expelled from the core (Garcia-Senz & Woosley, 1995; Woosley, Wunsch, & Kuhlen, 2004) consuming only a small amount of fuel on its way to the stellar surface. We describe the early evolution of burning regions in the set of single ignition models in terms of mean velocities, the position of centroids, and the effective radii of burned matter. The effective radii correspond to spheres of the same surface area as the burned region.
From their original positions, the initially motionless bubbles are driven by buoyancy and develop primarily vertical velocities, as can be seen by comparing the mean vertical (Fig. 10(a))


and radial (Fig. 10(b)) velocities. The initial acceleration is stronger in cases where the bubble is placed farther away from the stellar center (models Y50 and Y100, thick and thin dashed lines in Fig. 10) and weaker when the bubble originates deeper in the core (models Y12 and Y25, thick and thin solid lines in Fig. 10). Although the mean motion of the burned region is away from the stellar center, the rich and complex flow field includes downflows and outflows developing inside the region that lead to intermittent (apparent) deceleration and acceleration (seen as mild wiggles superimposed on the velocity curves). Each such wiggle in velocity is associated with the destruction of the current generation of Rayleigh-Taylor bubbles and the formation of the next. Our data indicates that perhaps two generations of such bubbles are created during the deflagration phase.
A sudden drop in vertical velocity and a rapid increase of lateral expansion marks the moment of bubble breakout. This phase is not well-defined but occurs roughly at s in model Y100 and not until s in model Y12. The effective radius of the burned regions (defined as a radius of a sphere with surface area equal to the flame surface area) at breakout is very similar between the models, km (Fig. 10(c)). However, the centroid of the burned region is located much farther out in model Y100 than in model Y12. That is understandable considering there is more time for the RT instability to develop structure and for the region to grow laterally when the ignition takes place closer to the stellar center. This also has profound consequences for the evolution of the star. A longer deflagration phase allows for more burning, causes more matter being lifted from the stellar core, and eventually results in stronger stellar expansion during the early ( s) post-breakout evolution (Fig. 11.
In the case of double point ignitions, the early evolution proceeds in a very similar way to that of single ignitions with a proportionally increase in the amount of burned material and stronger stellar expansion.
3.1.2 Detonation phase
One of the motivating factors behind extending our study to double ignition point scenarios was to examine whether a detonation can be formed when the maximal (and perhaps even boosted by flawed numerics) focusing offered by the symmetry axis is not present. Although we observed detonations forming in all off-center ignited models, only in one double ignition model, Y100YM25, does the detonation form near the equatorial plane. In the remaining two double ignition models, detonations eventually emerge near the symmetry axis. Although both models eventually detonate, we cannot consider them as examples of successful asymmetric DFDs. Nevertheless, both of them provide additional evidence for shock to detonation transition. In what follows we will first overview the formation of detonations in single ignition models. Then we will discuss the flow dynamics leading to detonation in model Y100YM25. We will conclude by presenting the ejecta morphology soon after the shock breakout along stellar surface is complete.
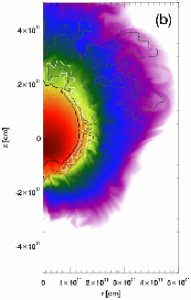
The progenitor structure around the time when a detonation forms is shown in Fig. 12
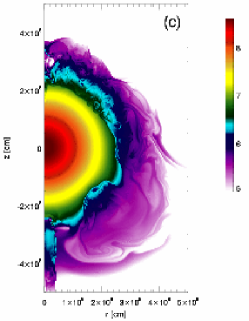
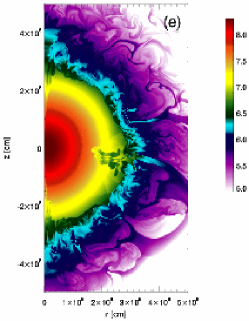
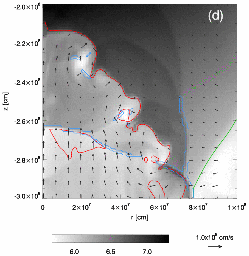
for models Y12, Y100, and Y100YM25. In all models the bulk of progenitor has retained its original spherical characters. We do not find any substantial large-scale deformations, except that the stellar cores in single-ignition models are slightly ellipsoidal in shape with axis ratio . Stellar expansion has decreased the core density to in model Y12 and Y100. This is consistent with our expectation that lower central densities are to be found in models that experienced more energetic deflagrations.
The stellar core is surrounded by an extended strongly turbulent atmosphere. Comparing three models shown in the upper row in Fig. 12, the atmosphere appears better developed (more extended and turbulent) in models that release more energy in the deflagration. This atmosphere formed following the breakout of deflagration products through the stellar surface, at which time the ashes accelerated unburned surface layers both radially and laterally. This circular wave carried both fuel and products of the deflagration along the surface of the star. The following evolution depends on whether there was one or more ignition points.
If the single ignition case, the surface wave eventually completely engulfs the progenitor and collides with itself in a region located opposite breakout. A conical shock wave forms in the process that thermalizes the kinetic energy of the incoming flow. This shock can be seen as a vertical structure near cm extending down from cm in model Y12 (Fig. 12(a)) and cm in model Y100 (Fig. 12(c)).
In the multi-point ignition case, there will presumably be several breakout points and related surface waves that will be colliding with one another. Therefore, it is conceivable that several shock-dominated regions might be formed. Some of those shocks might be weaker and others stronger than the ones found here. The number of possible scenarios and outcomes is certainly much larger than represented in a limited sample of the initial configurations considered in this study. Nevertheless, we expect that our models capture the essential features of the evolution. In the case of model Y100YM25, for example, the material of two waves collides near the equatorial plane forming a jet-like radial inflow and outflow near cm (Fig. 12(e)). This is essentially the same flow configuration we found in the single point ignition models.
In what follows, we first focus our discussion on details of the transition to detonation process in three selected models. Then we characterize the evolution of the exploding star during the passage of the detonation wave.
Shock-to-detonation Transition
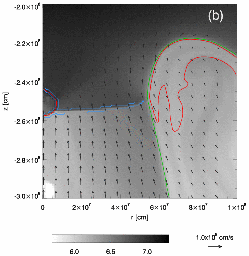
In all cases considered in our study, we found explosions following a shock-to-detonation transition, SDT (see, e.g., Bdzil & Kapila, 1992; Sharpe, 2002, and references therein). Although regions forming detonations differ greatly in morphology, the common ingredients of the process include the presence of a strong acoustic wave, dense fuel, and a prolonged compression of the region. This is illustrated in the bottom row of Fig. 12 which shows the density distribution and major flow structures involved in a transition to detonation process.
Model Y12 shares the initial conditions with the original PCL study. In the Y12 model, we found no sign of a possible transition to detonation for s (Fig. 12(a)) in contrast to the PCL study, in which a detonation wave formed at s This difference in timing is due solely to the incorrect energetics of approximate deflagration burner used in the PCL calculations. The overestimate of the energy release and hence buoyancy by a factor of in the PCL model resulted in a much shorter deflagration phase, a lower overall energy release, a more compact progenitor and ultimately a significantly earlier formation of the detonation. At the same time, the less expanded progenitor allowed for the surface wave to move at a relatively higher speed (due to a lower orbit) and with higher post-shock temperatures, possibly enhancing the likelihood of a transition to detonation.
Similar to PCL, we observe the formation of a conical shock in Y12. However, the conditions inside the shocked region allow only for residual burning that perturbs the shocked gas (the low density region near symmetry axis at cm in the lower section of Fig. 12(a)). The wave that transits to detonation is an accretion shock (blue isocontour extending horizontally from cm in Fig. 12(d)) created by infalling material which is trapped horizontally by the symmetry axis and the incoming deflagration products, and vertically by the bulk of the stellar material and the stagnation point formed behind the conical shock. A transition to detonation takes place at the symmetry axis where the ram pressure of the incoming flow and the resulting post-shock temperature are the highest. (Although the accretion flow is predominantly along z-direction, there exists a lateral velocity gradient, , in the flow that focuses the flow toward the symmetry axis.)
In model Y100 (Fig. 12(d)), a detonation wave can be seen as a nearly vertically propagating shock located near cm. Unlike in model Y12, here the detonation is not directly associated with the symmetry axis. The conical shock is visible as an wave originating near cm, just to the right of the detonation region. The apparent closeness of the flame front is coincidental and has nothing to do with origin of the detonation wave. By the time of Fig. 12(d) the conical shock is already sweeping through deflagration products, however the detonation appears moving through a channel of shocked fuel eventually connecting to the bulk of stellar material.
Model Y100YM25 displays by far the most complex flow structure in the region where a transition to detonation occurs. The configuration of two colliding surface waves resembles that of a “self-colliding” surface wave found in models with a single ignition point. Here, however, a symmetry of the problem is broken. Not only does the collision not take place at the symmetry axis, but the ignition points were initially located at different distances from the core. The timing, energetics, and morphology of each wave were therefore slightly different. This difference eventually leads to a shift of the collision plane km from the equator (Fig. 12(f)). Furthermore, the collision does not occur “head-on” but rather material from the slower wave (ignition point located closer to the core) tends to penetrate underneath that of the faster wave (ignition point located farther away from the core). In the end, the whole region shows a slight tendency to roll.
Another difference from the highly symmetric single ignition models is that the broken symmetry offers the potential for creating more than just one shocked region. This is indeed the case in model Y100YM25. Two shock fronts moving in the radial direction can be seen inside the collision region: one located near cm, and another near cm. Both fronts are created near the collision plane which might be understood given this is where we expect the thermalization rate of the colliding flows being the greatest. The former shock wave evolves into a self-sustained detonation while the latter soon dies off. Once a detonation is formed, the wave travels approximately along a fuel-rich channel (a flame-bounded horizontally extending structure near cm that connects to the bulk of the unburned stellar material.
Some more details and observations can be offered regarding the SDTs observed in our subset of models. We found that transitions to detonation occur in gas with pre-shock densities in models Y12 and Y100 and in model Y100YM25. As demonstrated by (Arnett & Livne, 1994b), at these densities the typical radius of region that can successfully transit to detonation is few kilometers. This is smaller than the numerical resolution in our models. It is conceivable that problems with producing SDTs in some of our double-point ignition models might be attributed to insufficient resolution. For the same reason, the observed SDTs may require less time to launch detonations after a strong shock wave forms. However, preconditioning of the fuel for SDT is certainly a temporally extended process requiring both compression of the material and thermalization of the flow. The latter is aided by the confinement that makes the thermalization process more efficient. Still, large amounts of energy need to be supplied to the region and the typical velocity jumps across shock waves are . This guarantees post-shock temperatures K, high enough for nuclear burning to take control of the flow dynamics.
Evolution through detonation
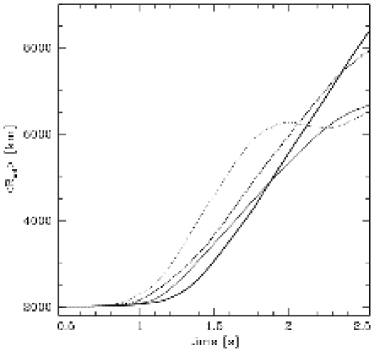
Transitions to detonations occur in different models at different times and locations although, as we discussed earlier, several necessary elements (high density fuel-rich matter, strong wave, extended confinement of the region) are commonly present. Figure 13
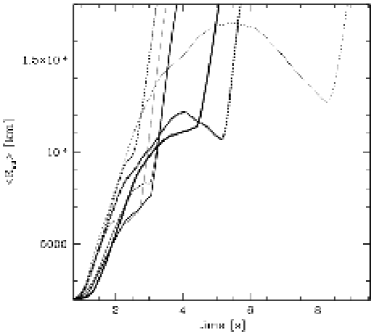
shows the evolution of the equivalent stellar radius (defined as the radius of a sphere with the same volume as that occupied by matter of density ) in our sample of DFD models. This initial steady stellar expansion is due to energy deposition by a failed deflagration. In most cases a detonation occurs when the progenitor either approaches or begins to recollapse. This is understandable since at later times the energy of surface waves is likely to quickly dissipate, thus decreasing the likelihood of strong hydrodynamic interactions taking place (e.g. in multi-point ignitions, model Y100YM25). Alternatively, the accretion flows can develop only once expansion stops and high accretion luminosities (required for SDT) can be expected only shortly after accretion flows develop. In particular, in models Y70YM25 and Y75YM50 (thick dotted and dotted line in Fig. 13, respectively) no SDT occurred during the collision of surface waves. Instead, flow perturbations accumulated in the regions near the symmetry axis, evolved into jet-like flows and eventually triggered detonations. With our verification study providing evidence that the evolution of perturbation near the symmetry axis cannot be entirely trusted, we do not consider these two models as successful DFDs produced by double point ignitions. (One probably could still consider them members of single point ignition families, perhaps obtained from different initial conditions, and provided their radii prior to SDT were similar to original single ignition models. We do not consider this inelegant possibility any further.)
Figure 14
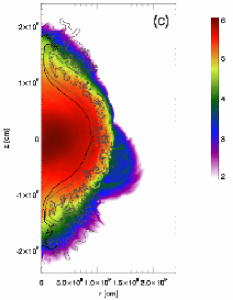
shows the morphology of the exploding model supernovae Y12, Y100, and Y100YM25 shortly after the central density drops below and nuclear burning essentially quenches. Several important observations can be made. All model supernova ejecta are stratified. The ejecta are composed of a featureless core surrounded by inhomogeneous external layers. This composite structure of the ejecta is a direct result of the two stages of the explosion, each involving a diametrically different dominant process. The core is the remnant of the original progenitor which has been expanded by energy released during the deflagration phase. the density distribution in the core displays slight asymmetry reflecting the character of the initial conditions (the shift in the density maximum to the lower hemisphere present in single ignition models is absent in double ignition model) . The outer layers may show global asymmetry, especially in models with a single ignition point, but are always rich in structures reflecting the turbulent nature of the deflagration and the violent evolution of surface waves.
The density stratification of the ejecta is accompanied by compositional stratification. This is due to the detonation wave which synthesized iron peak elements when sweeping through the dense central regions and intermediate group elements when encountering the less dense outer layers. The detonation is driven by essentially instantaneous energy release due to carbon burning followed by approach to NSQE (silicon-group elements) and final relaxation to NSE (iron-group elements). With relatively crude resolution, only the relaxation to NSE and approach to NSQE at the lowest densities can be considered spatially resolved in our simulations (Khokhlov, 1989, Fig. 9). This problem, however, is not related to the energy release and so does not influence the overall dynamics of the detonation front. The low resolution of our models prevents us from considering possible effects related to the curvature of the detonation front. Once again, such effects affect the structure of the detonation wave only on scales km (Sharpe, 2001) and are not expected to influence the large scale dynamics of the detonation wave.
The outermost ejecta are composed of unburned fuel mixed with the deflagration products, most likely intermediate group elements with locally entrained iron-rich material. Close to the core, those layers were overrun by the detonation wave that additionally modified their composition. Although definitely present in our calculations, we estimate this effect to be small. To calculate the detailed composition of the ejecta, including the deflagration mix, requires postprocessing nucleosynthesis (see for example Travaglio, Hillebrandt, & Reinecke, 2006) and is beyond the scope of this presentation.
Detonations are known to be susceptible to transverse perturbations and developing cellular structure (Fickett & Davis, 2001, Chap. 7). Potential sources for such perturbations are abundant in our models and include upstream flow perturbations due to preexisting convection and turbulence (not considered here), initial deflagration, or possible numerical oscillations of grid-aligned shock fronts, i.e. odd-even decoupling (Quirk, 1994). We found no clear evidence for cellular structure in our calculations. One possibility is that the numerical resolution is insufficient to resolve detonation cells of sub-km size (Gamezo et al., 1999; Falle, 2000). Also, the time available for cellular structure is very limited as low density material rapidly expands following the passage of the detonation wave and the burning quickly quenches.
The evolution of the explosion energy (kinetic + internal + potential) and burned mass from the moment of ignition until the shock breakout is shown in Fig. 15.
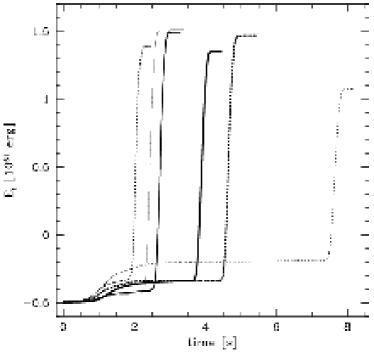
With plenty of unburned fuel available to the detonation, DFD supernovae are energetic events with typical post-detonation energies foe. The deflagration phase typically supplies only to foe of energy in burning of stellar fuel. The bulk of the energy is released during about s when the detonation wave sweeps through the white dwarf. These findings resemble the results presented by (Arnett & Livne, 1994b, Fig. 3) although the mechanism behind the transition to detonation is different in the two models.
3.2. Homologous expansion: final properties
The direct comparison of hydrodynamic explosion models to observations is accomplished through the calculation of synthetic model light curves, spectra, and possibly also spectrum polarization. These radiative transfer calculations take as an input the model supernova ejecta with complete specification of the density distribution, ejecta chemical composition, and typically make the simplifying assumption that velocity linearly increases with distance from the ejecta center. This last assumption is satisfied to different degrees in various parts of the ejecta and generally does not hold true during the early stages of supernova expansion. The reason is that linear expansion requires establishing a fine balance of accelerations between neighboring fluid elements in the ejecta, and this requires time. For example, our post-detonation explosion models contain large regions where energy of the flow is dominated by internal energy. This indicates the potential of fluid elements performing some work, possibly adjusting their motion relative to their neighbors. To allow for that process to operate and establish homologous expansion, the post-explosion needs to be continued for an extended period of time. Detailed discussion of this process in the context of Type Ia supernova modeling was recently presented by Röpke (2005).
We obtained a complete set of homologously expanding model ejecta using flash and its adaptive mesh capabilities. Post-detonation models were carefully transported to a high-resolution uniform mesh with typical relative errors of total mass, total energy, and abundances not exceeding %, %, %, respectively. Given the several sources of uncertainties and variations in the original models, this accuracy is sufficient for any practical purposes. The interpolated models were then used to define the initial conditions in the flash calculations.
We used a ratio of kinetic energy to the sum of internal plus gravitational energies to monitor the approach of ejecta to homology. In course of several trial computations, we established that continuing calculations for s after explosion guarantees that the energy ratio anywhere in the ejecta except for the innermost half of the central nickel-rich core (and parts of essentially massless shocked ambient medium). This required using a computational grid extending to cm. Calculations were performed using an automatic mesh derefinement scheme that kept the computational cost approximately constant as the ejecta expanded. The effective mesh size varied from initially to zones per dimension at a final time.
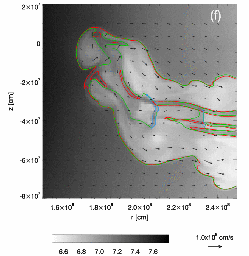
The density and compositional structure of the homologously expanding model ejecta are shown in Fig. 16.
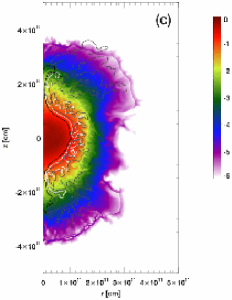
Here we show only the innermost part of the grid with expansion velocities reaching at cm. The remaining part of the volume contains a low-density shocked ambient medium and the supernova shock. The bulk of the ejecta material displays essentially the same structure as in early post-detonation models discussed in the previous section. Most visible differences can be found in the outermost regions that here were already swept by the shock. The composite character of the bulk of the ejecta is preserved with a featureless core rich in iron group elements and the outer strongly mixed layers rich in silicon group elements. The compositional dichotomy of the outer layers also reflects the contribution of two processes to the explosion. The inner well-defined silicon-rich ring also contains an admixture of calcium (shown with white isocontours in Fig. 16). This is due to the detonation wave nucleosynthesis calculation done with aprox13t nuclear network. The outer silicon-rich and rather fragmented shell is devoid of calcium as this species was not considered in the approximate 3-stage flame burner. Improving upon the approximate nucleosynthesis is one of the urgent future tasks, especially given the importance of the outer ejecta layers in formation of supernova spectrum (Kasen & Plewa, 2005). It is also interesting to note that the each deflagration region seems responsible for forming its own outer silicon-rich ring. This is evident in model Y100YM25 (Fig. 16(c)).
Table 3
| Model | Y12 | Y25 | Y50 | Y100 | Y75YM25 | Y100YM25 | Y75YM50 |
|---|---|---|---|---|---|---|---|
| 1.357 | 1.496 | 1.515 | 1.516 | 1.464 | 1.384 | 1.075 | |
| 1.59 | 8.38 | 7.15 | 7.09 | 5.34 | 2.87 | 1.97 | |
| 2.52 | 2.39 | 2.38 | 2.38 | 2.31 | 2.30 | 2.56 | |
| 8.03 | 1.13 | 1.15 | 1.10 | 1.03 | 8.36 | 2.25 | |
| 8.73 | 5.49 | 3.30 | 4.56 | 1.29 | 2.05 | 2.52 | |
| 0.107 | 4.65 | 4.48 | 3.91 | 7.54 | 9.82 | 0.237 | |
| 4.41 | 3.79 | 3.28 | 4.78 | 1.04 | 9.53 | 9.73 | |
| 8.70 | 3.40 | 3.42 | 2.81 | 4.51 | 6.74 | 0.194 | |
| 0.127 | 7.28 | 6.07 | 5.74 | 8.00 | 0.137 | 0.202 | |
| 7.03 | 3.65 | 3.06 | 3.18 | 4.21 | 8.75 | 0.124 | |
| 1.64 | 8.26 | 6.91 | 7.36 | 3.97 | 2.07 | 2.95 | |
| 1.82 | 8.95 | 7.53 | 8.09 | 1.02 | 2.20 | 3.24 | |
| 1.41 | 9.35 | 3.02 | 1.35 | 2.71 | 2.71 | 2.58 | |
| 2.96 | 1.49 | 1.42 | 1.42 | 1.78 | 3.43 | 4.83 | |
| 6.50 | 3.43 | 3.01 | 2.91 | 3.49 | 6.85 | 1.03 | |
| 0.926 | 1.147 | 1.173 | 1.186 | 1.075 | 0.895 | 0.510 |
presents approximate nucleosynthetic yields and final explosion energies for the complete set of homologous DFD models. The homologous character of the models is confirmed by the consistently small fraction of potential and internal energies as compared to the total energy. In most models, explosion energies are in the range foe. These produce between to almost solar masses of and between and solar masses of intermediate elements. Although model nickel masses may appear relatively high at first, such high nickel masses might be typical for significant fraction of objects (Stritzinger et al., 2006). Furthermore, our estimates of nickel mass are likely the upper limits given aprox13t nucleosynthesis does not account for production of other iron-group elements, e.g. stable isotopes like . Model Y75YM50 is the least energetic ( erg), produces the least amount of nickel () and more than a half solar mass of intermediate mass elements. As we discussed earlier, we believe that this model should not be considered as a DFD, as the shock to detonation transition was likely being promoted by numerics.
4. Discussion
We studied the fate of a massive carbon/oxygen white dwarf following an off-center mild ignition. We found that such initial configurations do not produce direct explosions. Only a small amount of stellar fuel is initially consumed and the released energy is used to expand the progenitor. This is in agreement with several previous independent studies in which the deflagration was either intrinsically weak (Arnett & Livne, 1994b) or was initiated slightly off-center (Niemeyer, Hillebrandt, & Woosley, 1996; Livne, Asida, & Höflich, 2005).
We found that the following evolution of the perturbed stellar material leads to the formation of isolated wave-dominated regions inside unburned material. We considered these regions capable of launching a detonation wave through a shock-to-detonation transition. We observed the resulting detonations eventually consuming the bulk of the unburned progenitor. These detonating failed deflagrations are energetic events with explosion energies foe.
The model DFD ejecta appear composite, reflecting the presence of two different physical processes contributing to the explosion. The central parts of the ejecta are composed of a mildly deformed but completely featureless central core rich in iron peak elements. Stronger deformations may require different physics, e.g. rotation (Höflich, 2005). The core is surrounded by a slightly inhomogeneous inner ring rich in silicon group elements, a product of the detonation burning at low densities. Finally, the outermost layer is highly turbulent containing a mix of deflagration products and unburned material. Preliminary nucleosynthesis results indicate that DFD models typically produce over of iron group elements and intermediate elements. The burn is almost complete leaving essentially no carbon.
Our conclusions are based on calculations using a revised numerical scheme that contains substantial improvements. We found that the energetics of deflagration stage originally considered in (Calder et al., 2004, PCL) tended to overestimate buoyancy effects by a factor . We used a set of self-heating nuclear network calculations and implemented a density-dependent energy release scheme. Additional modifications to the approximate nucleosynthesis were included to improve the dynamics of the early phases still further. With the revised energetics, we calibrated the numerical flame speed to match the results of detailed calculations of Timmes & Woosley (1992).
The revised deflagration code was subsequently verified against an independent set of results of centrally ignited deflagrations obtained with the Garching supernova code. Good qualitative agreement was found between the two codes. The database of computer models is offered on-line to facilitate future verification (code-to-code comparison) studies.
Furthermore, a numerical procedure to stabilize model progenitors has been developed. These stabilized progenitors not only provided initial conditions for supernova simulations but also allowed us to examine the fidelity of hydrodynamic advection in axisymmetric situations. In particular we found that, on the one hand, no numerically stable progenitors can be obtained if resolution is too low and, on the other hand, small perturbations are strongly amplified near the symmetry axis in highly resolved models. This analysis allowed us to identify the optimal resolution for our supernova calculations.
We analyzed the observed pattern of shock-to-detonation transitions (SDTs) in some detail. We identified the presence of sufficiently dense fuel, strongly kinetic flow, wave formation, and a persistent confinement of the region with additional pressure increase due to nuclear burning in the shocked gas as necessary conditions for a SDT. We found that the phenomenon of SDT is not exclusively associated with the presence of a symmetry axis. We also found that SDTs can occur in regions completely free of possible geometrical boosting effects, i.e. near the equatorial plane.
However, transitions to detonations were not a robust prediction of such models. There are some possible reasons for that. For example, by assuming axisymmetry we eliminate an angular direction in which additional perturbations may develop. Such perturbations will enrich the flow field creating more seed points for SDT and, at the same time, increase the amplitude of fluctuations. That is, the assumed symmetry is likely limiting the possible wave interactions and presumably denying extreme events such as a SDT. In addition, for stability reasons, our calculations had to be performed using suboptimal numerical resolution. This caused a strong numerical damping and limited sampling of the perturbed regions harming chances for observing SDTs still further. On the other hand, we did not include physics that may, effectively, make the system behavior appear more viscous (e.g. magnetic fields) inhibiting formation of small scale structures.
Our findings also hinge on the assumption that the SDT process is relatively insensitive to details of evolution on scales unresolved in our simulations. This remains to be demonstrated, ideally in the course of dedicated highly-resolved model calculations of compressionally heated fuel-rich degenerate mixtures. It will be a daunting task. If any parallel can be drawn, experience accumulated by modelers of inertially confined fusion systems might be of great help in such studies (Atzeni & Meyer-ter-Vehn, 2004; Drake, 2006). Even if such models are successfully constructed, many doubts will remain regarding the outcome of such calculations given how limited our knowledge about real systems is. For example, as we mentioned before (PCL), although we consider a pure carbon/oxygen progenitor it is almost certain that in nature progenitor’s surface layers contain admixture of helium (Nomoto, 1982; Yoon & Langer, 2005b). Compositional changes will affect energetics of nuclear burn adding entirely new dimension to the problem.
Being mindful of numerous simplifying assumptions and model inaccuracies, the essential findings of this work are, therefore, rather modest and can be summarized as evidence of strong, localized, and prolonged shock heating in regions rich in fuel. We note that these are necessary conditions for shock-to-detonation transition to occur. We believe this observation is independent of particular details of our model, especially numerics, making SDT one of prime suspects for triggering detonations in SN Ia.
However, even if no seed point forms a detonation through SDT, this second, after the initial deflagration, failure to unbind the star in no way automatically implies supernova will not occur. Perhaps just the opposite. The extensive large-scale mixing of deflagration products with unburned outer stellar layers combined with abundantly present strong acoustic perturbations appear the conditions are ripe for the Zeldovich gradient mechanism (Khokhlov, Oran, & Wheeler, 1997). We may expect that for rotating progenitors (Yoon & Langer, 2005a) perturbations of surface layers will be even stronger due to presence of additional shear component. If all these opportunities are missed, the white dwarf might still be given another chance to produce the supernova. A failed attempt to explode would then be a beginning of a cycle that repeats, perhaps several times, as the expanded white dwarf eventually cools down, shrinks, and prepares for another ignition. That is, the explosion process might be a lengthy one, a kind of laborious slow death.
As the observations improve, we are also beginning to collect evidence that the degree of diversity of SN Ia might be greater than original anticipated (or desired!). Recent observations of the peculiar supernova SN 2002cx by Jha et al. (2006) argue in favor of low energy explosion and large degree of mixing in this object, two characteristics that essentially preclude any involvement of a detonation in the explosion process. Other objects listed by Jha et al. (2006) may belong to SN 2002cx class. These rare peculiar supernovae might be genuine examples of pure deflagrations. Or perhaps these are objects that underwent several failed deflagrations leaving only small amount of material to fuel the detonation. If so, normally bright supernovae might be DFDs that succeeded early, with the occurrence of a detonation (or lack thereof) being the primary element determining the observational properties of a given event.
On the other hand, SNe Ia display some characteristics that we find difficult to explain in the framework of pure deflagrations. One example are iron-rich clumps found in Type Ia SNRs (Warren & Hughes, 2004; Warren et al., 2005). In the model proposed here, the inner ring of intermediate elements seems to be a natural site for producing nickel-rich blobs that may float away from the central core (Blondin, Borkowski, & Reynolds, 2001; Wang & Chevalier, 2001). Those radioactive blobs may also be explained in pure deflagration models that naturally produce clumpy ejecta. However, dominant and isolated regions rich in iron-group elements like the one observed in Tycho SNR (Vancura, Gorenstein, & Hughes, 1995; Warren et al., 2005) can hardly be produced in a pure deflagration in which several such regions are expected to be simultaneously present. In DFDs, such an isolated clump located near the outer edge of the supernova remnant might be a material burned deep in the progenitor core and transported to the stellar surface by one of the deflagrating bubbles.
We cannot address the above question without detailed nucleosynthesis calculations. This is one of the possible future directions for research. In addition, the relaxation of the assumption of axial symmetry, although costly, will be necessary. But even with only the current approximate nucleosynthesis and simplified geometry of the problem, we are in a position to conduct preliminary validation studies against observations for a subset of DFD models. This will be the subject of the next communication in this series.
References
- Anderson & Woodward (1995) Anderson, S. E., & Woodward, P. R. 1995, available at www.lcse.umn.edu/research/sppm/README.html
- Arnett (1969) Arnett, W. D. 1969, Ap&SS, 5, 180
- Arnett (1974) Arnett, W. D. 1974, ApJ, 191, 727
- Arnett (1994) Arnett, D. 1994, ApJ, 427, 932
- Arnett (1996) Arnett, D. 1996, Supernovae and Nucleosynthesis (Princeton: PUP)
- Arnett & Livne (1994a) Arnett, D., & Livne, E. 1994a, ApJ, 427, 315
- Arnett & Livne (1994b) Arnett, D., & Livne, E. 1994b, ApJ, 427, 330
- Arnett, Truran, & Woosley (1971) Arnett, W. D., Truran, J. W., & Woosley, S. E. 1974, ApJ, 165, 87
- Atzeni & Meyer-ter-Vehn (2004) Atzeni, S., & Meyer-ter-Vehn, J. 2004, The Physics of Inertial Fusion, (Oxford: Clarendon)
- Bdzil & Kapila (1992) Bdzil, J. B., & Kapila, A. K. 1992, Phys. Fluids A, 4, 409
- Blinnikov et al. (2006) Blinnikov, S. I., et al. 2006, A&A, 453, 229
- Blondin, Borkowski, & Reynolds (2001) Blondin, J. M., Borkowski, K. J., & Reynolds, S. P. 2001, ApJ, 557, 782
- Branch et al. (1995) Branch, D., et al. 1995, PASP, 107, 1019
- Calder et al. (2002) Calder, A. C., et al. 2002, ApJS, 143, 201
- Calder et al. (2004) Calder, A. C., et al. 2004, preprint (astro-ph/0405162)
- Chertkov (2003) Chertkov, M. 2003, Phys. Rev. Lett., 91, 115001
- Chugai, Chevalier, & Lundqvist (2004) Chugai, N. N., Chevalier, R. A., & Lundqvist, P. 2004, MNRAS, 355, 627
- Drake (2006) Drake, R. P. 2006, High-Energy-Density Physics: Fundamentals, Inertial Fusion, and Experimental Astrophysics, (Berlin: Springer)
- Falle (2000) Falle, S. 2002, Ap&SS, 272, 145
- Fickett & Davis (2001) Fickett, W., & Davis, W. C. 2001, Detonation: Theory and Experiment (New York: Dover)
- Fowler & Hoyle (1964) Fowler, W. A., & Hoyle, P. 1964, ApJS, 9, 201
- Fryxell, Müller, & Arnett (1989) Fryxell, B. A., Müller, E., & Arnett, W. D. 1989, Max-Planck-Institut für Astrophysik, Preprint 449, (Garching: MPA)
- Fryxell et al. (2000) Fryxell, B., et al. 2000, ApJS, 131, 273
- Gamezo et al. (1999) Gamezo, V., et al. 1999, ApJ, 512, 827
- Gamezo et al. (2003) Gamezo, V., et al. 2003, Science, 299, 77
- Gamezo, Khokhlov, & Oran (2004) Gamezo, V. N., Khokhlov, A. M., & Oran, E. S. 2004, PRL, 92, 211102
- Gamezo, Khokhlov, & Oran (2005) Gamezo, V. N., Khokhlov, A. M., & Oran, E. S. 2005, ApJ, 2005, 623, 337
- Garcia-Senz & Bravo (2005) Garcia-Senz, D., & Bravo, E. 2005, A&A, 430, 585
- Garcia-Senz & Woosley (1995) Garcia-Senz, D., & Woosley, S. E. 1995, ApJ, 454, 895
- Golombek & Niemeyer (2005) Golombek, I., & Niemeyer, J. C. 2005, A&A, 438, 611
- Guerrero, García-Berro, & Isern (2004) Guerrero, J., Garciía-Berro, E., & Isern, J. 2004, A&A, 413, 257
- Hamuy et al. (2003) Hamuy, M., et al. 2003, Nature, 424, 651
- Hoyle & Fowler (1960) Hoyle, P. & Fowler, W. A. 1964, ApJ, 132, 565
- Höflich et al. (2002) Höflich, P., et al. 2002, ApJ, 568, 791
- Höflich (2005) Höflich, P. 2005, in 1604–2004: Supernovae as Cosmological Lighthouses, ASP Conference Series, Vol. 342, ed. M. Turatto, S. Benetti, L. Zampieri, and W. Shea (San Francisco: ASP), 372
- Höflich & Khokhlov (1996) Höflich, P. & Khokhlov, A. 1996, ApJ, 457, 500
- Höflich et al. (2004) Höflich, P., et al. 2004, ApJ, 617, 1258
- Höflich & Stein (2002) Höflich, P., & Stein, J. 2002, ApJ, 568, 779
- Iben & Tutukov (1984) Iben, I., Jr., & Tutukov, A. V. 1984, ApJS, 54, 335
- Jha et al. (2006) Jha, S., et al., 2006, AJ, 132, 189
- Kane et al. (2000) Kane, J., et al. 2000, ApJ, 528, 989
- Kasen & Plewa (2005) Kasen, D., & Plewa, T. 2005, ApJ, 622, L41
- Kasen & Plewa (2006) Kasen, D., & Plewa, T. 2006, ApJ, submitted
- Khokhlov (1983) Khokhlov, A. M. 1983, Sov. Astron. Lett., 9, 160
- Khokhlov (1989) Khokhlov, A. M. 1989, MNRAS, 239, 785
- Khokhlov (1991) Khokhlov, A. M. 1991, A&A, 245, 114
- Khokhlov (1995) Khokhlov, A. M. 1995, ApJ, 449, 695
- Khokhlov (2000) Khokhlov, A. M. 2000, preprint (astro-ph/0008463)
- Khokhlov, Müller, & Höflich (1993) Khokhlov, A., Müller, E., & Höflich, P. 1993, A&A, 270, 223
- Khokhlov, Oran, & Wheeler (1997) Khokhlov, A. M, Oran, E. S., & Wheeler, J. C. 1997, ApJ, 478, 678
- Kozma et al. (2005) Kozma, C., et al. 2005, A&A, 437, 983
- Kuhlen, Woosley, & Glatzmaier (2006) Kuhlen, M., Woosley, S. E., & Glatzmaier, G. A. 2006, ApJ, 640, 407
- Lanz et al. (2005) Lanz, T., et al. 2005, ApJ, 619, 517
- Leonard et al. (2005) Leonard, D. C., et al. 2005, ApJ, 632, 450
- Livio & Riess (2003) Livio, M, & Riess, A. G. 2003, ApJ, 594, L93
- Livne (1993) Livne, E. 1993, ApJ, 406, L17
- Livne & Arnett (1993) Livne, E., & Arnett, D. 1993, ApJ, 415, L107
- Livne & Arnett (1995) Livne, E., & Arnett, D. 1995, ApJ, 452, 62
- Livne, Asida, & Höflich (2005) Livne, E., Asida, S. M., & Höflich, P. 2005, ApJ, 632, 443
- Mannucci, Della Valle, & Panagia (2006) Mannucci, F., Della Valle, M., & Panagia, N. 2006, MNRAS, 370, 773
- Müller (1986) Müller, E. 1986, A&A, 162, 103
- Müller & Arnett (1982) Müller, E., & Arnett, W. D. 1982, ApJ, 261, L109
- Müller & Arnett (1986) Müller, E., & Arnett, W. D. 1986, ApJ, 307, 619
- Napiwotzki et al. (2003) Napiwotzki, R., et al. 2003, in From Twilight to Highlight: The Physics of Supernovae, ESO Astrophysics Symposia Vol. XVII, ed. W. Hillebrandt & B. Leibundgut, (Berlin: Springer), 134
- Napiwotzki et al. (2005) Napiwotzki, R., et al. 2005, in 4th European Workshop on White Dwarfs, ASP Conf. Ser. Vol. 334, ed. D. Koester & S. Moehler, (San Francisco: ASP), 375
- Niemeyer (1995) Niemeyer, J. C. 1995, Ph.D. thesis, Max-Planck-Institut für Astrophysik, Garching
- Niemeyer, Hillebrandt, & Woosley (1996) Niemeyer, J. C., Hillebrandt, W., & Woosley, S. E. 1996, ApJ, 471, 903
- Nomoto (1982) Nomoto, K. 1982, ApJ, 253, 798
- Nomoto, Sugimoto, & Neo (1976) Nomoto, K., Sugimoto, D., & Neo, S. 1976, Ap&SS, 39, L37
- Nomoto, Thielemann, & Yokoi (1984) Nomoto, K., Thielemann, F.-K., & Yokoi, K. 1984, ApJ, 286, 644
- Pantano et al. (2005) Pantano, C., et al. 2005, J. Comput. Phys., in press
- Plewa, Calder, & Lamb (2004) Plewa, T., Calder, A. C., & Lamb, D. Q. 2004, ApJ, 612, L37 (PCL)
- Piersanti et al. (2003) Piersanti, L., et al. 2003, ApJ, 598, 1229
- Quirk (1991) Quirk, J. J. 1991, Ph.D. thesis, Cranfield Institute of Technology
- Quirk (1994) Quirk, J. J. 1994, Int. J. Numer. Methods Fluids, 18, 555
- Reinecke, Hillebrandt, & Niemeyer (1999) Reinecke, M., Hillebrandt, W., & Niemeyer, J. C. 1999, A&A, 347, 739
- Reinecke, Hillebrandt, & Niemeyer (2002) Reinecke, M., Hillebrandt, W., & Niemeyer, J. C. 2002, A&A, 386, 936
- Reinecke, Hillebrandt, & Niemeyer (2002) Reinecke, M., Hillebrandt, W., & Niemeyer, J. C. 2002, A&A, 391, 1167
- Röpke (2005) Röpke, F. K. 2005, A&A, 432, 969
- Röpke & Hillebrandt (2005a) Röpke, F. K., & Hillebrandt, W. 2005a, A&A, 429, L29
- Röpke & Hillebrandt (2005b) Röpke, F. K., & Hillebrandt, W. 2005b, A&A, 431, 635
- Röpke et al. (2006) Röpke, F. K., et al. 2006, A&A, 448, 1
- Röpke et al. (2006) Röpke, F. K., et al. 2006, A&A, 453, 203
- Ruiz-Lapuente et al. (2004) Ruiz-Lapuente, P., Comeron, F., Méndez, J., et al. 2004, Nature, 431, 1069
- Schmidt, Hillebrandt, & Niemeyer (2006) Schmidt, W., Hillebrandt, W., & Niemeyer, J. C. 2005, Combustion Theory and Modelling, 9, 693
- Schmidt & Niemeyer (2006) Schmidt, W., & Niemeyer, J. C. 2006, A&A, 446, 627
- Sharpe (2001) Sharpe, G. J. 2001, MNRAS, 322, 614
- Sharpe (2002) Sharpe, G. J. 2002, Phys. Fluids, 14, 4372
- Starrfield et al. (2004) Starrfield, S., Timmes, F. X., Hix, W. R., et al. 2004, ApJ, 612, L53
- Stritzinger et al. (2006) Stritzinger, M., et al. 2006, å, submitted (astro-ph/0609232)
- Suleimanov & Ibragimov (2003) Suleimanov, V. F., & Ibragimov, A. .A. 2003, Astron. Rep., 47, 197
- Timmes (2001) Timmes, F. X. 2001, available at www.cococubed.com/code_pages/net_torch.shtml
- Timmes & Woosley (1992) Timmes, F. X., & Woosley, S. E. 1992, ApJ, 396, 649
- Travaglio, Hillebrandt, & Reinecke (2006) Travaglio, C., Hillebrandt, W., & Reinecke, M. 2006, A&A, 443, 1007
- Trucano, Pilch, & Oberkampf (2003) Trucano, T. G., Pilch, M., Oberkampf, W. L. 2003, Sandia Report SAND2003-2752, (Albuquerque: SNL)
- Vancura, Gorenstein, & Hughes (1995) Vancura, O., Gorenstein, P., & Hughes, J. P. 1995, ApJ, 441, 680
- Vladimirova, Weirs, & Ryzhik (2006) Vladimirova, N., Weirs, V. G., & Ryzhik, L. 2006, Combustion Theory and Modelling, 10, 727
- Wang & Chevalier (2001) Wang, C. Y., & Chevalier, R. A. 2001, ApJ, 549, 1119
- Wang et al. (2004) Wang, L., et al. 2004, ApJ, submitted (astro-ph/0409593)
- Warren & Hughes (2004) Warren, J. S., & Hughes, J. P. 2004, ApJ, 608, 261
- Warren et al. (2005) Warren, J. S., et al. 2005, ApJ, 634, 376
- Webbink (1984) Webbink, R. F. 1984, ApJ, 277, 355
- Weirs et al. (2005) Weirs, G., et al. 2005, Ap&SS, 298, 341
- Whelan & Iben (1973) Whelan, J., & Iben, I. 1973, ApJ, 186, 1007
- Woosley (1990) Woosley, S. E. 1990, in Supernovae, ed. A. G. Petschek, (New York: Springer), 182
- Woosley, Wunsch, & Kuhlen (2004) Woosley, S. E., Wunsch, S., & Kuhlen, M. 2004, ApJ, 607, 921
- Wunsch & Woosley (2004) Wunsch, S., & Woosley, S. E. 2004, ApJ, 616, 1102
- Yoon & Langer (2005a) Yoon, S.-C., Langer, N. 2005a, A&A, 435, 967
- Yoon & Langer (2005b) Yoon, S.-C., Langer, N. 2005b, in Interacting Binaries: Accretion, Evolution, and Outcome, AIP Conf. Proc. 797, ed. L. Burderi, L. A. Antonelli, F. D. D’Antona, T. Di Salvo, G. Luca Israel, L. Piersanti, A. Tornambe, and O. Straniero, (New Yor: Springer), 651
- Yoon, Langer, & Scheithauer (2004) Yoon, S.-C., Langer, N., & Scheithauer, S. 2004, A&A, 425, 217
- Zhang et al. (2006) Zhang, J., et al. 2006, ApJS, in press