ISM studies of GRB 030329 with high resolution spectroscopy 111Based on ESO proposal 70.D-0087
Abstract
We present a series of early UVES/VLT high resolution spectra of the afterglow of GRB
030329 at redshift . In contrast to other spectra from this burst, both emission and absorption lines were detected. None of them showed any temporal evolution. From the emission lines, we determine the properties of the host galaxy which has a star formation rate (SFR) of 0.198 M⊙ yr-1 and a low metallicity of 1/7 Z⊙. Given the low total stellar host mass M⋆=107.75±0.15 M⊙ and an absolute luminosity mV=–16.37, we derive specific SFRs (SSFR) of log SFR/M = –8.5 yr-1 and SFR/L = 14.1 M⊙ yr-1 L. This fits well into the picture of GRB hosts as being low mass, low metallicity, actively star forming galaxies.
The Mg ii and Mg i absorption lines from the host show multiple narrow (Doppler width b=5-10 km/s) components spanning a range of v260 km/s, mainly blueshifted compared to the redshift from the emission lines. These components are likely probing outflowing material of the host galaxy, which could arise from former galactic superwinds, driven by supernovae from star forming regions. Similar features have been observed in QSO spectra. The outflowing material is mainly neutral with high column densities of log N(Mg ii)= cm-2 and log N(Mg i)= cm-2.
Subject headings:
Gamma-rays: Bursts: Individual: GRB 030329, GRB host galaxies, absorption line kinematics, high resolution spectra1. Introduction
Gamma-Ray-Bursts (GRBs) have proven to be one of the lighthouses in the distant universe since the determination of their cosmological origin in 1997 (van Paradijs et al., 1997; Metzger et al., 1997). Their afterglow spectra, ranging from X-ray to radio, follow a power law decay and do not seem to show intrinsic lines from the burst itself though there are some claims of X-ray line detections from the prompt emission (e.g., Butler et al., 2005, and references therein). This makes them well suited as a powerful light source to study the burst environment in the host galaxy and the medium in the line of sight by using absorption lines. In addition, emission lines from the host might be seen on top of the afterglow spectrum and provide important information about the type of galaxy in which GRBs occur. As these galaxies are usually very faint and difficult to detect, GRBs offer a unique possibility to find and study these galaxies in detail.
One of the few other possibilities to study these faint, distant galaxies is through QSO observations (Ellison et al., 2003; Petitjean et al., 2000). Their spectra often show intervening absorption systems from foreground damped Lyman alpha systems (DLAs) or metal absorption lines such as Mg ii (Churchill et al., 2003) associated with galaxies or halos of galaxies. Mg ii absorbers are the best studied sample to date as Mg ii is the reddest of the strong metal absorption lines in the interstellar medium (ISM), but also C iv, which probes a different region of the ISM has been studied since many years. Recently, highly excited lines like O vi have also been discovered in such absorption systems (Ellison et al., 2000; Schaye et al., 2000). With high resolution spectra, the stronger absorption lines of these QSO-absorbers usually have been found to consist of several components spanning velocities up to 300 km/s (Prochter et al., 2006). These different components are assumed to originate in different clouds in the absorbing system and are therefore able to give a picture of the ISM structure in these galaxies.
For an increasing fraction of GRBs, spectra of the afterglow can be obtained, especially since the Swift satellite (Gehrels et al., 2004) started operating in December 2004. Depending on the redshift and the wavelength range of the instrument, these spectra may contain emission lines from HII regions in the host galaxy or absorption lines from material inside the host galaxy and/or the intergalactic medium (IGM). Emission line analysis from the host galaxy can be easily performed with low resolution spectroscopy from the afterglow containing emission lines from the galaxy, or with later observations targeting the galaxy. These analyses reveal that host galaxies of long GRBs are usually young, irregular, low mass, low metallicity, star-forming galaxies (Christensen et al., 2004). To study the ISM structure in the host galaxy through absorption lines, however, higher resolution is needed which is only available for few bursts so far (Savaglio, 2006, and references therein), most of them detected recently. Their absorption lines usually show several components with a wide range of velocities whose nature is still speculative. Due to the wavelength coverage of the spectra and the position of the absorption and emission lines, there are only very few bursts that contain both. Examples are GRB 990712 (Vreeswijk et al., 2004) and GRB 970508 (Reichart, 1998) which had Mg ii absorption in addition to the host emission lines. GRB 020813 (Barth et al., 2003) showed weak OII emission in addition to the broad absorption lines containing many velocity components and GRB 020405 (Masetti et al., 2003) had a weak Ca ii absorption line. Only for one burst, GRB 060218 (Wiersema et al., 2006), high resolution spectra containing both kind of lines could be obtained which show different components in the host absorption and one of the emission lines.
The long GRB 030329 was detected by the HETE-2 satellite at 11:38:41 UT (Vanderspek et al., 2003) and lasted for s at high energies. In terms of fluence, it was among the top 1% of all detected GRBs. A bright optical afterglow was detected 1.5 hr after the burst with an R-band magnitude of 12.5 (Peterson & Price, 2003) allowing to get high resolution spectra. The optical lightcurve showed a slow decay with a power law index of and several phases of rebrightenings 1.3, 2.4, 3.1 and 4.9 days (Matheson et al., 2003; Lipkin et al., 2004) after the onset of the burst. From the emission lines of the host in the UVES spectra presented here, a redshift of z=0.1685 was determined (Greiner et al., 2003a).
Due to its brightness and low redshift, a series of low resolution spectra could be taken over several weeks, which showed for the first time the connection between long-duration GRBs and supernovae (SNe) (Hjorth et al., 2003; Matheson et al., 2003; Stanek et al., 2003). Also, for the first time, it was possible to measure the time evolution of the afterglow polarization (Greiner et al., 2003b). Emission line analysis of the host galaxy was obtained from an extensive low resolution dataset taken with the FORS spectrograph (Hjorth et al., 2003; Sollerman et al., 2005) and spectra from Matheson et al. (2003) who found a a SFR of 0.5M⊙/yr and a moderate metallicity of 12+log(O/H)=8.5, but they assumed the upper branch of the metallicity solution. None of them however was able to detect any absorption line as the wavelength range of their spectra missed the Mg II lines in the UV.
In this paper, we present high resolution UVES/VLT spectra from the first and the fourth night after the burst. We detect and analyze both emission and absorption lines as shown in §3. The emission lines are used to derive the redshift, extinction, SFR and metallicity of the host galaxy in §4. §5 shows the splitting of the host absorption lines into 7 components and gives a possible interpretation of these components.
For the calculations in the paper, we used a = 0.7, = 0.3 cosmology, a value of H=70 km/s for the Hubble constant and c=299,792 km/s.
2. Data sample
High-resolution spectra of the afterglow of GRB 030329 have been collected with the UV-Visual Echelle Spectrograph (UVES, Dekker et al., 2000), of the ESO Very Large Telescope (VLT), on the nights of March 30 (UT) and April 2, 2003 under good seeing (09-07) conditions. Four 30 minutes exposures and two 1 hour exposures were secured on the first and fourth night after the burst, respectively, using two different beam splitters (dichroic #1 and #2). Two UVES standard settings were used, the so-called DIC1 (R346 nm, B580 nm), and the DIC2 (R437 nm, B860 nm). This combination allowed us to get on the first observing date two spectra covering the full optical range (303-1060 nm), except for small gaps near 575 and 855 nm, and one similar spectrum on the second night. The use of a 08 slit width provides a resolving power of 55,000 or 5.5 km/s (FWHM). The slit was oriented along the parallactic angle in order to minimize losses due to the atmospheric dispersion.
The raw data were reduced using the UVES pipeline (v1.4) implemented in the ESO-MIDAS software package
(Ballester et al., 2000). This pipeline reduction includes flat-fielding, bias and sky subtraction and a relative wavelength calibration which has an accuracy of 0.5 km/s. The optimum extraction method has been used, which assumes a Gaussian profile for the cross-dispersion flux distribution and is optimized for low SNR spectra. The individual reduced spectra were also corrected for the airmass, the atmospheric absorption bands could however not be removed because of saturation. No correction for vacuum wavelengths or heliocentric velocities (-16.23 and -17.36 km/s for the two nights respectively) was done for the final spectra, this was taken into account later for the redshift determination (see Sec. 4).
We also did an absolute flux calibration using the master response curves determined by the ESO Garching Quality Control222http://www.eso.org/observing/dfo/quality/UVES/qc/
std_qc1.html#response (see also Hanuschik, 2003). Comparison with photometric data of the afterglow from the literature (Matheson et al., 2003) showed that the continuum of the flux calibrated spectrum was almost a factor 2 too low. This can hardly be explained with bad seeing It seems, however, to be a common problem in UVES flux calibration. Comparison with FORS spectra taken at the same time suggest that the UVES flux calibration is about a factor of 1.6 too low (Wiersema et al., 2006). We therefore recalibrated the spectrum using photometric data from Matheson et al. (2003), obtained at the same time as our spectroscopic observations.
The log of the observations are noted in Table 1. As an example, the entire reduced spectrum of the third epoch is shown in Fig.
1.
| epoch | date | UT | d after GRB | exp. [min] | R mag | seeing [”] | airmass | wavelength range [nm] |
|---|---|---|---|---|---|---|---|---|
| 1 | 30/3/2003 | 03:22:44 | 0.6556 | 30 | 15.27 | 0.73 | 1.45 | 303-388 + 476-684 |
| 03:55:43 | 0.6785 | 30 | 15.31 | 1.03 | 1.49 | 373-499 + 660-1060 | ||
| 2 | 30/3/2003 | 04:29:01 | 0.7016 | 30 | 15.38 | 0.97 | 1.59 | 303-388 + 476-684 |
| 05:01:53 | 0.7244 | 30 | 15.46 | 0.75 | 1.74 | 373-499 + 660-1060 | ||
| 3 | 02/4/2003 | 00:46:54 | 3.5474 | 60 | 17.24 | 0.49 | 1.72 | 383-499 + 660-1060 |
| 01:51:51 | 3.5925 | 60 | 17.25 | 0.72 | 1.49 | 303-388 + 476-684 |
Note. — Dates given are the start of the observations

3. Line analysis
3.1. Emission lines
We detected a range of emission lines from the GRB host galaxy. The Balmer series down to H, the forbidden lines [OII] 3727,3729 and [OIII] 5007 as well as [Ne III] 3869 could be identified. H was also detected though it lies in the middle of the atmospheric A absorption band. Fortunately, it fell between two of the resolved atmospheric absorption lines in the atmospheric A band and is therefore very little affected by absorption (see Fig. 2). H and H could only be detected clearly in the data from the third epoch. Of the two [OIII] lines at 4963 Å and 5007 Å, the 4963 Å line unfortunately falls in the gap of the detector in the red arm which consists of a mosaic of two chips. [N II] 6586 was not detected, but a reliable 2 upper limit could be derived because of the high resolution, despite the fact that this region in the spectrum was also affected by atmospheric absorption bands.
The [OII] doublet was well resolved in the spectra of the fourth night (see Fig. 2) which was only possible in three other bursts, GRB 990506 and GRB 000418 Bloom et al. (2003) as well as GRB 060218 (Wiersema et al., 2006). This is especially interesting because the [OII] 3727/3729 ratio allows the determination of the electron density ne (Osterbrock, 1989). In our spectrum, the ratio of the two lines is 0.530.10 for the third epoch when the S/N was high enough to resolve the 3727 Å-line, because the afterglow continuum had faded away. This ratio is consistent with the lower value of 0.66 for n. Similar ratios were found for the hosts of GRB 990506, GRB 000418 and GRB 060218 with values of 0.570.14, 0.750.11 and 0.620.05 respectively.


To measure the emission line fluxes, we fitted the lines with a Gaussian and compared it with measuring the line flux directly which gave similar results. The properties of the emission lines in the individual spectra as well as the mean value of the flux from first night’s spectra are listed in Table 2. The flux of the emission lines is generally higher in the two spectra from the first night (epoch 1 and 2) which could be due to different seeing and it also varies between the two exposures. As the light curve of the first night showed large variations and even small color changes (Matheson et al., 2003; Lipkin et al., 2004), this might also affect the spectrum. Therefore, we take the emission line fluxes from the 3rd epoch for further calculations as the continuum might be less influenced by intrinsic changes of the afterglow spectrum.
Even after recalibrating the spectra with photometric data, our emission line fluxes are a factor of 1.3 (second epoch) to 1.4 (first epoch) lower than the values found by Gorosabel et al. (2005),Sollerman et al. (2005) in late FORS spectra from the host galaxy. As they used a 10 slit and a fixed orientation angle covering most of the galaxy, these data might not be entirely comparable to our spectra, though the line ratios are very similar to those found from later spectra.
| Line | epoch | FWHM | Flux (measured) | Flux (AV corr.) | Mean(1,2) AV corr. | ||
|---|---|---|---|---|---|---|---|
| [Å] | [Å] | [Å] and [km/s] | [10-17erg/cm2/s/Å] | [10-17erg/cm2/s/Å] | [10-17erg/cm2/s/Å] | ||
| OII | 1 | 3726 | (4354) | (0.9) | 17.30.5 | 32.10.9 | |
| 2 | (4354) | (0.9) | 20.60.5 | 38.20.9 | 35.2 | ||
| 3 | 4354.29 | 0.910.10 647 | 4.810.5 | 8.920.9 | |||
| OII | 1 | 3728 | 4357.67 | 0.620.10 377 | 11.50.5 | 21.41.0 | |
| 2 | 4357.37 | 0.690.10 407 | 17.90.5 | 33.31.0 | 27.3 | ||
| 3 | 4357.43 | 0.960.10 567 | 9.040.5 | 16.71.0 | |||
| NeIII | 1 | 3869 | 4520.80 | 0.740.10 426 | 6.62.0 | 12.13.7 | |
| 2 | 4521.39 | 0.500.10 286 | 8.52.0 | 15.63.7 | 13.85 | ||
| 3 | 4521.27 | 0.910.10 516 | 3.42.0 | 6.240.9 | |||
| H | 1 | 4101 | (4793) | (0.9) | 16.31.0 | 29.21.8 | |
| 2 | (4793) | (0.9) | 17.31.0 | 31.01.8 | 30.1 | ||
| 3 | 4793.07 | 0.830.10 456 | 3.351.5 | 6.001.8 | |||
| H | 1 | 4340 | (5072) | (0.9) | 8.391.0 | 14.61.8 | |
| 2 | (5072) | (0.9) | 11.01.0 | 19.21.8 | 16.9 | ||
| 3 | 5072.21 | 0.810.10 416 | 3.21.5 | 5.581.8 | |||
| H | 1 | 4861 | 5681.17 | 0.900.10 415 | 10.01.0 | 16.33.2 | |
| 2 | 5680.86 | 0.950.10 435 | 8.41.0 | 13.83.2 | 15.1 | ||
| 3 | 5680.99 | 1.000.10 455 | 7.80.5 | 12.81.7 | |||
| OIII | 1 | 5007 | 5850.90 | 0.770.10 335 | 39.40.5 | 63.40.8 | |
| 2 | 5851.01 | 0.810.10 365 | 38.00.5 | 61.10.8 | 62.3 | ||
| 3 | 5851.03 | 0.760.10 335 | 31.80.5 | 51.20.8 | |||
| H | 1 | 6563 | 7669.24 | 1.330.10 454 | 23.51.0 | 32.91.3 | |
| 2 | 7669.22 | 1.210.10 404 | 26.91.0 | 37.61.3 | 35.3 | ||
| 3 | 7669.29 | 1.400.10 474 | 21.30.5 | 29.80.8 | |||
| N II | 1 | 6586 | (7695) | (1.20) | 8.771.0 | 12.21.3 | |
| 2 | (7695) | (1.20) | 9.631.0 | 13.41.3 | 12.8 | ||
| 3 | (7695) | (1.20) | 2.670.5 | 3.710.8 |
Note. — Values for the emission lines for the three different datasets with the numbers indicating the spectra taken in the first and the fourth night after the burst as described in Table 1. The measured wavelenghts are in air and not corrected for heliocentric velocity, FWHM is restframe corrected. Fluxes are given as the measure value and the value corrected for Galactic and host extinction as described in Sec. 4.3
3.2. Absorption lines
Compared to other bursts from which spectra could be obtained, GRB 030329 has a very low redshift. Therefore, most of the metal absorption lines are still far in the UV, outside the detection range of UVES.
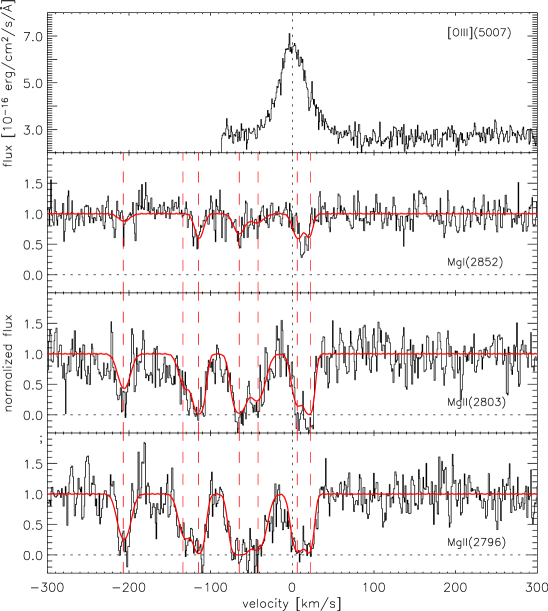
However, we detect the Mg ii 2797, 2803 doublet clearly resolved as well as Mg i 2852, which all reveal to have several well resolved velocity components. Voigt profiles were fitted to these absorption features using the FIT/LYMAN package (Fontana & Ballester, 1995) in MIDAS and the column densities determined for each component (see Sec. 5)
Interstellar NaD 5890 and Ca ii 3933 from our Galaxy were also detected and resolved in three different clouds, which allows an independent determination of the Galactic extinction. These two elements do usually not occur in the same regions in the galaxy and their wavelength and properties can therefore be different. We find that the first two clouds have the same shift within the accuracy, the third one however has a different position for NaD and Ca ii. The FWHM and the ratio of the EWs NaD/Ca ii are also different within each cloud which favors different states of the ISM for the origin of the two absorption lines (Welty et al., 1996).
We could, however, not detect any NaD 5890, Ca ii 3933 or Ti ii 3242 absorption from the host galaxy, whereas the ratio of Ca ii to Mg i, which have similar ionization potentials, found in GRB 020813 (Savaglio & Fall, 2004) was around 1. Ratios found in the MW can vary between 0.01 and 1 depending on the properties of the ISM (Welty et al., 1999)
The properties of the absorption lines are listed in Table 3.
| Line | epoch | FWHM | EW | ||
|---|---|---|---|---|---|
| [Å] | [Å] | [Å] | [Å] | ||
| Mg II | 1 | 2796 | 3266.1 | 1.70.1 | 1.30.1 |
| 2 | 3266.2 | 1.80.2 | 1.30.2 | ||
| 3 | 3266.7 | 1.90.2 | 1.10.2 | ||
| Mg II | 1 | 2803 | 3274.5 | 1.90.1 | 1.30.2 |
| 2 | 3274.7 | 1.40.2 | 0.90.2 | ||
| 3 | 3274.8 | 2.80.2 | 1.630.30 | ||
| Mg I | 1 | 2852 | 3332.5 | 1.20.2 | 0.250.18 |
| 2 | 3333.0 | 1.30.2 | 0.250.18 | ||
| 3 | 3332.9 | 1.90.2 | 0.390.25 | ||
| NaD | 1 | 5890 | 5889.58 | 0.230.02 | 0.0530.01 |
| 5890.27 | 0.240.05 | 0.0280.01 | |||
| 5890.60 | 0.160.05 | 0.0060.01 | |||
| 2 | 5889.64 | 0.280.05 | 0.0500.01 | ||
| 5890.21 | 0.250.05 | 0.0270.01 | |||
| 5890.54 | 0.170.05 | 0.0090.01 | |||
| 3 | 5889.64 | 0.210.05 | 0.0310.01 | ||
| 5890.01 | 0.100.05 | 0.0210.01 | |||
| 5890.15 | 0.050.05 | 0.0130.01 | |||
| Ca II | 1 | 3933 | 3933.5 | 0.250.03 | 0.160.01 |
| 3933.9 | 0.220.03 | 0.050.01 | |||
| 3934.6 | 0.300.03 | 0.040.01 | |||
| 2 | 3933.5 | 0.230.05 | 0.180.01 | ||
| 3933.9 | 0.170.05 | 0.030.01 | |||
| 3934.5 | 0.280.05 | 0.060.01 | |||
| 3 | 3933.5 | 0.270.05 | 0.230.01 | ||
| 3933.9 | 0.130.05 | 0.030.01 | |||
| 3934.5 | 0.300.05 | 0.090.01 |
Note. — The upper part are absorption lines from the host galaxy, the lower part from the MW. The FWHM of the Mg lines are the widths over the rebinned lines. The different wavelengths and EWs of the NaD interstellar lines from the third epoch are due to imperfect sky line removal from telluric NaD emission.
4. Results
4.1. Redshift
The redshift of the host galaxy was determined from the [O III] 5007, H and H emission lines of the first epoch (Greiner et al., 2003a) as . We did a refined analysis using the emission lines [O II] 3726, 3729, [O III] 5007, H and H, corrected for heliocentric velocities of 16.23 and 17.36 km/s for night 1 and 4 respectively. From this, we derive a value of , consistent with the value found by Matheson et al. (2003) and Sollerman et al. (2005). Note, however that this is the mean redshift of the GRB host galaxy, not of the GRB itself.
4.2. Broadening of the emission lines
Low resolution spectra are usually not able to distinguish between instrumental resolution and intrinsic broadening of the host emission lines due to galaxy rotation and turbulence of the medium.
From our high resolution spectra (FWHM=5.5 km/s), we find that all emission lines in our spectra are clearly broadened compared to the resolution of the instrument. The FWHM of the emission lines lies between 35 and 55 km/s, restframe corrected. This fits well to the fact that the host of GRB 030329 is a dwarf galaxy, which have typical radial velocities up to 100 km/s. We might however not see the whole rotational velocity spread if the galaxy is not seen edge on.
4.3. Galactic and host extinction
For the determination of the Galactic extinction, usually sky catalogs such as Schlegel et al. (1998) or Dickey & Lockman (1990) are used. The strength of interstellar lines like NaD 5890 however allows a different and more accurate determination of the extinction using e.g. the model of Munari & Zwitter (1997). In our spectra, Galactic NaD as well as Ca ii show a triple absorption peak, indicating three clouds in our Galaxy in the line of sight. The NaD-line gives an extinction of EB-V = 0.013 0.004, 0.007 0.002 and 0.002 0.001 for the three clouds respectively which results in a total extinction of E or AV=0.068 as AV=RVEB-V with RV=3.1 for a MW extinction law (Cardelli et al., 1989). This is comparable to the extinction determined from the Schlegel sky catalog of E.
The extinction in the host galaxy can in principle be derived from the Balmer line decrement, the constant flux ratio of the Balmer lines derived from line transition properties, with unextinguished values of H/H=2.76 and H/H=0.474 for a temperature of 10,000 K and case B recombination (Osterbrock, 1989). From our spectrum we obtaine H/H=2.730.2 which is consistent with no extinction. The ratio H/H=0.410.15 would give an extinction of E(B-V)=0.740.7 which is unfortunately quite inaccurate due to the relatively large error in the emission line fluxes. In addition, the Balmer lines can be affected by absorption from an underlying stellar population depending on the age of the galaxy. This affects H and H much more than H, which means that the derived extinction should be seen as an upper limit. However, in the UVES spectra, we could not identify any underlying stellar absorption, whereas Gorosabel et al. (2005) derive a relatively high correction, comparable to the value of the fluxes for H and H from their stellar population models. We consider it therefore to be more appropriate to use an extinction value derived from the broad band afterglow as it was done in Kann et al. (2006). They derive a value of A, fitting an SMC extinction law, which differs however very little from the fit with a MW extinction law.
To correct the emission line fluxes, we then use A for the host extinction and A for the Galactic extinction applying a MW extinction law (see Table2).
4.4. SFR
A direct indicator of the current SFR in a galaxy is the flux from nebular emission lines such as H that had been ionized by young, massive stars. Using the H flux from the 3rd epoch, which is corrected for extinction but not for a possible underlying stellar absorption, we derive a SFR of the host galaxy according to Kennicutt et al. (1998) of SFR [M⊙/yr] = = 0.1980.006 M⊙/yr which is consistent with the value in Hjorth et al. (2003) of SFRHα=0.17 M⊙/yr from the FORS spectra. Another indicator for the SFR are forbidden lines like [OII] with the drawback of being only indirectly coupled to the ionizing flux of young stars but very sensitive to the ionization state of the ISM. For [OII], the corresponding equation SFR [M⊙/yr] = gives a value of 0.3020.006 M⊙/yr which is higher than the value derived from H. As the SFR from [OII] seems to be less reliable, we adopt here the SFR from H.
A SFR of 0.198 M⊙/yr is not very high compared to other galaxies at this redshift, but one has to consider the low mass of the host galaxy as already noted in Sollerman et al. (2005). Savaglio, Glazebrook and Le Borgne (2006, in prep.) derive a low total stellar mass for the host of M⋆ = 107.75±0.15M⊙. This gives a specific SFR (SSFR) per unit mass of log SFR/M = 8.5 yr-1. Furthermore, the host galaxy of GRB 030329 is underluminous with an absolute magnitude of mV=16.37 (Fruchter et al., 2006). This can be used to scale the SFR with the luminosity fraction compared to a standard galaxy with mV(abs)=21 to derive the SFR/L (Christensen et al., 2004). For our galaxy, we get a value for the SFR/L of 14.1 M⊙ yr-1 L which is high compared to the average of other host galaxies of 9.7 M⊙ yr-1 L as found by Christensen et al. (2004).
4.5. Metallicity of the host
There are a number of secondary, empirical metallicity calibrators derived from the abundances of nebular emission lines. The most frequently used, because easiest to get, is the R parameter (Kobulnicky et al., 1999). [O III] 4959 was not detected due to the gap in the spectrum, there is, however a fixed ratio between the two [O III] lines, f=3f.
The R23 parameter gives two possible solutions, in our case either a metallicity of 12+log(O/H) = 7.8 or 8.7. This degeneracy can be broken using the [N II] 6586 to H ratio (Lilly et al., 2003). As noted in Sollerman et al. (2005), no [N II] was detected in the spectra of GRB 030329, except from the FORS spectrum of May 1st (Hjorth et al., 2003), which seems to be spurious. Due to the high resolution of the UVES spectrum however, we were able to put a strong 2 upper limit of [N II] (see Table 2) and therefore to derive a ratio of [N II]/H from the strongest upper limit at the 3rd epoch of . This favors a lower branch solution according to Lilly et al. (2003), which gives a low metallicity value of 12+log(O/H) = 7.8 or 1/7 Z⊙, assuming 12+log(O/H) = 8.66 for solar metallicity (Asplund et al., 2004). The low mass of the host galaxy supports a low value for the metallicity.
The R23 parameter however has turned out to be affected by systematic errors for high and low metallicities (Bresolin et al., 2004). Wiersema et al. (2006) showed that the metallicity of the GRB 060218 host, derived from the oxygen abundances, is 12+log(O/H)=7.54, compared to 8.0 from the R23 parameter. For a direct calibration from the abundances however, the electron temperature and density have to be known which rely on the detection of [OIII] 4363 and the detection or low error flux measurements of the [OII] 3727,3729 or [SII] 6716,6731 doublets, which were not detected for the GRB 030329 host or only with large errors in the case of [OII].
5. Absorption line kinematics
5.1. Fitting of the absorption systems
| Component | MgII[2796] | MgII[2803] | MgI[2852] | ||||
|---|---|---|---|---|---|---|---|
| b [km/s] | log N [cm-2] | b [km/s] | log N [cm-2] | b [km/s] | log N [cm-2] | N(MgII)/N(MgI) | |
| v1 = +22 km/s | 4.70.8 | 12.910.26 | 4.70.8 | 13.500.24 | 4.70.8 | 11.530.13 | 2.07 |
| v2 = +6 km/s | 7.70.9 | 13.01 0.11 | 7.70.9 | 13.100.07 | 7.70.9 | 11.750.09 | 1.61 |
| v3 = -42 km/s | 11.11.4 | 13.060.07 | 11.11.4 | 13.130.06 | 11.11.4 | 11.380.18 | 2.02 |
| v4 = -65 km/s | 8.31.2 | 13.530.29 | 8.31.2 | 13.410.10 | 8.31.2 | 11.660.10 | 2.12 |
| v5 = -115 km/s | 6.40.9 | 13.060.18 | 6.40.9 | 13.420.20 | 6.40.9 | 11.680.10 | 1.90 |
| v6 = -134 km/s | 9.11.3 | 12.700.06 | 9.11.3 | 12.810.08 | 6.5 | 6.6 | |
| v7 = -207 km/s | 9.0 | 12.710.05 | 9.0 | 12.80 | 9.0 | 11.200.23 | 1.86 |
Note. — Values with no error bars indicate that they had to be fixed in order to achieve a reasonable fit.
For the absorption lines in the host galaxy, we found seven different velocity components for the two lines of the Mg ii doublet, whereas Mg i only shows six because of its lower line strength. The components span a velocity range of about 260 km/s (see Fig. 3) in both Mg ii and Mg i. Mg i shows nearly the same velocity differences as the Mg ii components, so it seems that both arise from the same structure. This does not necessarily have to be the case due to the different ionization stages. The fit for the first two clouds however, does not match very well the Mg i components, which might point to a different spatial origin for this component. The b parameter of the seven components is in the range of 511 km/s which is relatively narrow compared to QSO-Mg absorbers with similar EWs (Churchill et al., 2003).
No time variability of the absorption lines was seen between the different epochs and we therefore only used the first epoch for the fitting due to the better S/N for the absorption lines. This rules out an origin in the vicinity of the burst (Perna & Loeb, 1998; Prochaska et al., 2006), where one would expect a considerable weakening of the Mg absorption between the first and the fourth night. Furthermore, the Mg ii absorption in 5 of the 7 components goes down to zero, supporting the suggestion that the absorption does not occur at a very short distance from the central source. Otherwise, scattered light could lead to a covering factor smaller than one (Savaglio & Fall, 2004).
The individual components at the different velocity shifts have similar column densities, though comparison of the ratios N(Mg ii) to N(Mg i) show that the conditions in the different absorbing structures might vary slightly. The total Mg ii column density is 1014.1±0.1cm-2 which is in the regime of DLAs (Rao & Turnshek, 2000). The gas in DLAs is predominantly neutral which is supported for our GRB by the presence of a relatively large column density of Mg i (1012.3±0.1 cm-2) compared to N(Mg ii). This ratio is also higher than in QSO-Mg absorbers (Churchill et al., 2003).
5.2. Interpretation of the Mg i & ii velocity structure
Mg i and ii have been detected in many GRB afterglow spectra (Castro et al., 2000; Fiore et al., 2005; Starling et al., 2005; Penprase et al., 2006), where two types of velocity spreads were found. The first type shows saturated Mg lines with a velocity broadening up to 200 km/s, comparable to the instrumental resolution in low resolution spectra or resolved in high resolution spectra as a truly broad absorption feature as in Penprase et al. (2006). The broad features from low resolution spectra could sometimes be partially resolved as in Castro et al. (2000), who found a second component with a v of 180 km/s. Therefore, it is likely that the broad lines sometimes actually consist of several distinct components, which could have been resolved with higher resolution spectrographs. The other type shows many high velocity components with v up to 3000 km/s as in Fiore et al. (2005) and Starling et al. (2005).
The high velocity components are usually explained as being connected to the GRB itself like tracing nebula shells from former mass losses of the progenitor star, excited by the GRB (Mirabal et al., 2002) or strong winds which blow material of the star away from the Wolf-Rayet progenitor. The latter scenario was suggested for the high velocity components in GRB 021004 (Starling et al., 2005; Fiore et al., 2005; Chen et al., 2005). They found both broad and narrow structures in all the strongest absorption lines in UVES spectra of GRB 021004 and GRB 020813 up to velocities of 3000 km/s. The velocities measured in GRB 030329, however, are much lower, such winds can therefore not be the explanation for the components seen in our spectra. If those high velocity features were common for GRBs, they should have also been detected in GRB 030329, in addition to the low velocity components, but there are no absorption features visible at comparable velocity distance from the main component. Neither were they detected in any other spectra than those of GRB 021004, GRB 020813 and recently GRB 050505 (Berger et al., 2005) and GRB 051111 (Penprase et al., 2006), though the distances are far enough to be resolved in low resolution spectra as in the case of GRB021004 (Mirabal et al., 2002). Either the ISM around the burst must be quite dense to produce these clumps, not all GRB progenitors have high mass losses and strong winds or the reason for these components is something completely different.
In some recent bursts, fine-structure lines of Si ii, Fe ii, C ii and C iv could be detected as first reported by Vreeswijk et al. (2004) in a GRB spectrum. Fine-structure lines have only been found in high density environments such as Carinae (Gull et al., 2005). It is assumed that in GRBs, these lines come from electron excitation in the hot, turbulent vicinity of the burst. They are however not the reason for the structures in the Mg lines in our spectrum as these transitions are extremely weak for Mg (Morton, 2003).
Another possibility for the origin of the Mg lines in the spectrum of the GRB 030329 afterglow are supergalactic winds from starburst regions as found in spectra of low-redshift starburst galaxies and clearly visible e.g. in H light from M82. These winds were discovered in X-ray data, as the heated ISM emits X-rays. Heckman et al. (2000) studied the structures of NaD lines from such starburst galaxies. They found blueshifted components relative to the host galaxy up to 600 km/s with Doppler width of more than 100 km/s which seems likely for a hot environment (T70,000 K). This however rules out the possibility of an active starburst wind for our absorption line features as the velocities are too low for a wind origin and in addition, the lines are very narrow, so the absorbing atoms cannot be in a hot environment.
These winds might however not be the end of the story. In the MW as well as in other galaxies, so-called “high velocity clouds have been found, consisting mainly of HI, but O vi has also been discovered from the same region (Fox et al., 2005). This gave rise to the theory of the galactic fountain where starburst regions blow hot, ionized material out into the halo which then cools down and eventually falls back again onto the galaxy. The Mg absorption lines in our spectra might therefore be caused by some intermediate stages of that process, when the starburst wind has cooled and slowed down. The fact that, except for the two lowest-velocity systems, the velocities are larger than the rotational velocity of the host galaxy as determined from the emission line width, indicates that they are most likely not just related to large structures in the host galaxy like spiral arms. With the escape velocity typically being less than 50% larger than the mean rotational velocity, half of our velocity systems are likely to be unbound to the gravitational potential of the host galaxy. The star burst wind suggestion is therefore an appealing scenario for those structures.
The same process might cause Mg ii absorbers, which have often been found in the sightline of QSOs (Ellison et al., 2003) with large EW. Similar structures have also been discovered in Lyman break galaxies (LBG) (Adelberger et al., 2003) but only for C iv absorption lines. DLAs associated with Mg-absorbers show black bottom saturated Mg velocity components with narrow spreads of about 40 to 60 km/s. So-called “doubles have smaller EWs and highly complex features separated by a large v (Churchill et al., 1999) with their individual components having Doppler widths comparable to those found in GRB 030329. This might lead to the conclusion that Mg QSO absorbers and GRB absorbers have the same origin but that they are probing different regions of the galaxy. Petitjean (2005) also suggested that QSO-Mg absorbers could arise in optically thick clouds in the galactic halos, created by material ejection from starburst regions, being the remnants of a former starburst wind.
For strong QSO absorbers, there usually exist velocities red- and blueshifted compared to the central redshift of the intervening galaxy (Bond et al., 2001) whereas in our case mainly blueshifted lines exist, except for the first two components. This might be a hint to the position of the burst in the galaxy. If these components are really due to some metal rich clouds in or around the host galaxy, the burst could lie slightly behind the center plane of the galaxy or the star burst cloud which causes the few redshifted components, whereas the rest of the lines come from material flowing away from the burst site.
6. Conclusion
In this paper, we have presented high resolution spectra of a typical long-duration GRB at z=0.16867, which had the rare case to contain both emission lines from the host galaxy as well as absorption lines from the surrounding medium of the burst. The host galaxy is a subluminous (mV=16.37), low mass (M⋆ = 107.75±0.15M⊙) starburst with a high SFR/L of 14.1 M⊙ yr-1 L or log SFR/M = 8.5 yr-1 compared to other galaxies at this redhsift. This confirmes the values of the SSFR found by Hjorth et al. (2003) and Sollerman et al. (2005) from late FORS spectra of the host galaxy. Furthermore, the high resolution UVES spectra made it possible to derive a strong upper limit for [N II] and therefore to place the value of the metallicity in the lower branch with log(O/H)=7.8 or 1/7 Z⊙.
In absorption, only Mg ii and Mg i from the host could be detected. Due to the high resolution again, however, we were the first to resolve these usually broad absorption lines into six and seven narrow velocity components for Mg i and Mg ii respectively. These components span a relatively small range of velocities up to v260 km/s, which can usually not be resolved in low resolution spectra. The majority of these components are however outside of the galaxy whose emission lines have only a width of 55 km/s. Both Mg i and Mg ii seem to originate in the same clouds which are predominantly neutral with N(Mg ii)/N(Mg i) of around 2. Structures similar in width and velocity distance have been found in QSO Mg absorbers. They could be clouds in the halo of the host galaxy, possibly from material ejected from the inner regions of the galaxy by former starburst driven superwinds which have already slowed down.
The Swift satellite now provides faster information of the burst position and more early, high resolution spectra can be obtained. Very early spectra, compared with later times, could also reveal possible changes of the absorption lines due to ionization of the ISM by the burst (Vreeswijk et al., 2006b).
References
- Adelberger et al. (2003) Adelberger, K. L., Steidel, C. C., Shapley, A. E., & Pettini, M. 2003, ApJ584, 45
- Asplund et al. (2004) Asplund, M., Grevesse, N., Sauval, A. J., Allende Prieto, C. and Kiselman, D. 2004, A&A417, 751
- Ballester et al. (2000) Ballester, P., Dorigo, D., Disarò, A. Pizarro de La Iglesia, J. A., & Modigliani, A. 2000, Astronomical Data Analysis Software and Systems IX, ASP Conference Proceedings, Vol. 216
- Barth et al. (2003) Barth, A. J. et al. 2003, ApJ584, L47
- Berger et al. (2005) Berger, E., et al., ApJ642, 979
- Bloom et al. (2003) Bloom, J. S., et al. 2003, AJ, 125, 999
- Bond et al. (2001) Bond, N. A., Churchill, C. W., & Charlton, J. C. 2001, ApJ562, 641
- Bresolin et al. (2004) Bresolin, F., Garnett, D. R. and Kennicutt, R. C., Jr. 2004, ApJ615, 228
- Butler et al. (2005) Butler, N. et al. 2005, ApJ, 627, L9
- Cardelli et al. (1989) Cardelli, J. A., Clayton, G. C., & Mathis, J. S. 1989, ApJ, 345, 245
- Castro et al. (2000) Castro, S. et al. 2003, ApJ, 586, 128
- Chen et al. (2005) Chen, H. W., Prochaska, J. X., Bloom, J. S., & Thompson, I. B. 2005, ApJ, 634, L25
- Christensen et al. (2004) Christensen, L., Hjorth, J., & Gorosabel, J. 2004, A&A, 425, 913
- Churchill et al. (1999) Churchill, C. W., Rigby, J. R., Charlton, J. C., & Vogt, S. S. 1999, ApJS, 120, 51
- Churchill et al. (2003) Churchill, C. W., Vogt, S. S. & Charlton, J. C. 2003, ApJ, 125, 98
- Dekker et al. (2000) Dekker, H., et al. 2000, Proc. SPIE, 4008, 534
- Dickey & Lockman (1990) Dickey, J. M., & Lockman, F. J. 1990, ARA&A, 28, 215
- D’Elia et al. (2005) D’Elia, V. et al. 2005, GCN 4044
- Ellison et al. (2000) Ellison, S. L., Songaila, A., Schaye, J., & Pettini M., 2000, AJ, 120, 1175
- Ellison et al. (2003) Ellison, S. L., Mallén-Ornelas, G., & Sawicki, M. 2003 ApJ, 589, 709
- Ellison et al. (2003) Ellison, S. L., et al. 2006, MNRAS, 372, L38
- Fiore et al. (2005) Fiore, F. et al. 2005, ApJ, 624, 853
- Fontana & Ballester (1995) Fontana, E., & Ballester, P. 1995, ESO Messenger 80, 37
- Fox et al. (2005) Fox A. J. et al. 2005, ApJ630,332
- Fruchter et al. (2006) Fruchter, A. S., et al. 2006, Nature, 441, 463
- Gehrels et al. (2004) Gehrels, N., et al. 2004, ApJ, 611, 1005
- Gorosabel et al. (2005) Gorosabel, J., et al. 2005, A&A, 444, 711
- Greiner et al. (2003a) Greiner, J., et al. 2003, GCN 2020
- Greiner et al. (2003b) Greiner, J., et al. 2003, Nature, 426, 157
- Gull et al. (2005) Gull, T.R. et al. 2005, ApJ620, 442
- Hanuschik (2003) Hanuschik, R. W. 2003, A&A, 407, 1157
- Heckman et al. (2000) Heckman, T. M., Lehnert, M. D., Strickland, D. K., & Armus, L., 2000, ApJS, 129, 493
- Hjorth et al. (2003) Hjorth, J., et al. 2003, Nature, 423, 847
- Kann et al. (2006) Kann, D. A., Klose, S., & Zeh, A. 2006, ApJ, 641, 933
- Kennicutt et al. (1998) Kennicutt, R. C. Jr., et al. 1998, ARA&A, 36, 189
- Kobulnicky et al. (1999) Kobulnicky, H. A., Kennicutt R. C. Jr., & Pizagno, J. L. 1999, ApJ, 514, 544
- Ledoux et al. (2006) Ledoux, C., Vreeswijk, P., Smette, A., Jaunsen, A. & Kaufer, A. 2006, GCN 5237
- Lilly et al. (2003) Lilly, S. J., Carollo, C. M., & Stockton, A. N. 2003, ApJ, 597, 730
- Lipkin et al. (2004) Lipkin, Y. M., et al. 2004, ApJ, 606, 381
- Masetti et al. (2003) Masetti, N., et al. 2003, A&A, 404, 465
- Matheson et al. (2003) Matheson, T., et al. 2003, ApJ, 599, 394
- Metzger et al. (1997) Metzger, M. R., Djorgovski, S. G., & Kulkarni, S. R. 1997, Nature, 387, 878
- Mirabal et al. (2002) Mirabal, N., et al. 2002, ApJ, 578, 818
- Morton (2003) Morton, D. C. 2003, ApJS, 149, 205
- Munari & Zwitter (1997) Munari, U., & Zwitter, T. 1997, A&A, 318, 269
- Osterbrock (1989) Osterbrock, D. E. 1989, Astrophysics of Gaseous Nebulae and Active Galactic Nuclei, University Science Books, Mill Valley, CA
- van Paradijs et al. (1997) van Paradijs, J., et al. 1997, Nature, 386, 686
- Petitjean et al. (2000) Petitjean, P., Aracil B., Srianand, R., & Ibata, R. 2000, A&A, 359, 457
- Petitjean (2005) Petitjean, P. 2005, Proceedings IAU Coll. 199
- Penprase et al. (2006) Penprase, B. E. et al. 2006, ApJ, 646, 358
- Perna & Loeb (1998) Perna, R. & Loeb, A. 1998, ApJ, 501, 467
- Peterson & Price (2003) Peterson, B. A., & Price, P. A. 2003, GCN 1985
- Prochaska et al. (2005) Prochaska, J. X., et al. 2005, GCN 3833
- Prochaska et al. (2006) Prochaska, J. X., Chen, H.-W., & Bloom, J. S. 2006, ApJ, 648, 95
- Prochter et al. (2006) Prochter, G. E., Prochaska, J. X., & Burles, S. M. 2006, ApJ, 639, 766
- Rao & Turnshek (2000) Rao, S. M., & Turnshek, D. A. 2000, ApJS, 130, 1
- Reichart (1998) Reichart, D. E., 1998 ApJ, 495, L99
- Savaglio & Fall (2004) Savaglio, S., & Fall, S. M. 2004, ApJ, 614, 293
- Savaglio (2006) Savaglio, S. 2006, NJP 8, 195
- Schaye et al. (2000) Schaye, J., Rauch, M., Sargent, W. L. W., & Kim, T.-S. 2000, ApJ, 541, L1
- Schlegel et al. (1998) Schlegel, D. J., Finkbeiner, D. P., & Davis, M. 1998, ApJS, 80, 1
- Sollerman et al. (2005) Sollerman, J., et al. 2005, New Astronomy, 11, 103
- Stanek et al. (2003) Stanek, K. Z., et al. 2003, ApJ, 591, L17
- Starling et al. (2005) Starling, R. L. C., et al. 2005, MNRAS, 360, 305
- Tripp & Bowen (2005) Tripp, T. M., & Bowen, D. V. 2005, IAU Colloquium Proceedings No. 199
- Vanderspek et al. (2003) Vanderspek, R., et al. 2003, GCN 1997
- Vreeswijk et al. (2001) Vreeswijk, P. M., et al. 2001, ApJ, 546, 672
- Vreeswijk et al. (2004) Vreeswijk, P. M., et al. 2004, A&A, 357, 414
- Vreeswijk et al. (2006a) Vreeswijk, P. M. & Jaunsen, A. 2006, GCN 4974
- Vreeswijk et al. (2006b) Vreeswijk, P. M. et al. 2006, astro-ph/0611690
- Welty et al. (1996) Welty, D. E., Morton, D. C., & Hobbes, L. M. 1996, ApJS, 106, 533
- Welty et al. (1999) Welty, D. E., Frisch, P. C., Sonneborn, G. and York, D.G., 1999, ApJ, 512, 636
- Wiersema et al. (2006) Wiersema, K., et al. 2006, A&A, submitted