Intense Star-formation and Feedback at High Redshift: Spatially-resolved Properties of the Submillimeter Galaxy SMMJ14011025211affiliation: Based on observations collected at the European Southern Observatory, Very Large Telescope Array, Cerro Paranal, Chile (70.A-0254(A), 70.B-0545(A), and 073.A-5028(A)).
Abstract
We present a detailed analysis of the spatially-resolved properties of the lensed submillimeter galaxy SMMJ140110252 at z=2.56, combining deep near-infrared integral-field data obtained with SPIFFI on the VLT with other multi-wavelength data sets. As previously discussed by other authors, the broad characteristics of SMMJ140110252 in particular and submillimeter galaxies in general are in agreement with what is expected for the early evolution of local massive spheroidal galaxies. From continuum and line flux, velocity, and dispersion maps, we measure the kinematics, star-formation rates, gas densities, and extinction for individual subcomponents. The star formation intensity is similar to low-redshift “maximal starbursts”, while the line fluxes and the dynamics of the emission line gas provide direct evidence for a starburst-driven wind with physical properties very similar to local superwinds. We also find circumstantial evidence for ”self-regulated” star formation within J1. The relative velocity of the bluer companion J2 yields a dynamical mass estimate for J1 within kpc, M⊙. The relative metallicity of J2 is 0.4 dex lower than in J1n/s, suggesting different star formation histories. SED fitting of the continuum peak J1c confirms and substantiates previous suggestions that this component is a z0.25 interloper. When removing J1c, the stellar continuum and H line emission appear well aligned spatially in two individual components J1n and J1s, and coincide with two kinematically distinct regions in the velocity map, which might well indicate a merging system. This highlights the close similarity between SMGs and ULIRGs, which are often merger-driven maximal starbursts, and suggests that the intrinsic mechanisms of star-formation and related feedback are in fact similar to low-redshift strongly star-forming systems.
Subject headings:
galaxies: evolution — galaxies: kinematics and dynamics —1. Introduction
Half of the stars in the local universe formed at or by about half the age of the universe (e.g., Rudnick et al., 2003, and references therein). However, in spite of our knowledge of “when”, our understanding of the physical processes triggering and governing this star formation is still rudimentary. In particular, does the physics of star formation depend on redshift? For example, Goldader et al. (2002) hypothesize that the intense star formation observed in some high-redshift galaxies might require a more efficient mode to form stars, without triggering by major mergers. Erb et al. (2006), on the other hand, find that star formation in galaxies at z2 is less efficient, because they drive very efficient winds and energy into galaxy halos and the inter-galactic medium (IGM) and thus lose significant amounts of mass. Both hypotheses illustrate the need for detailed studies of star formation at high-redshift, to investigate whether low-redshift star-forming galaxies observed at high spectral and physical resolution can be good analogs to star formation at high redshift.
“Superwinds” – vigorous outflows of hot gas due to the thermalized ejecta of supernovae and massive stars in starburst galaxies – are inexorably linked to star formation. While winds likely play a fundamental role in galaxy formation and evolution (e.g., Heckman et al., 1990; Lehnert & Heckman, 1996a), and contribute significantly to the metal content of the IGM (e.g., Bouché et al., 2005), the direct observational evidence for the ubiquity of winds in star-forming galaxies at high redshift is still rather limited. It is mainly based on blue line asymmetries and offsets of rest-frame UV interstellar absorption lines relative to optical emission lines (e.g., Pettini et al., 2001) and on the evolution of the mass-metallicity relationship at high redshift (Erb et al., 2006) in UV-selected galaxy populations.
Submillimeter galaxies (SMGs) at z 2 are the sites of particularly vigorous star formation, with star-formation rates of M⊙ yr-1, and thus provide an excellent opportunity to investigate the properties of extreme star formation at high redshift (Blain et al., 2002, and references therein).
The z2.57111Using the flat cosmology with H kms-1 Mpc-1 leads to D Gpc and D Gpc at . The size scale is 8.03 kpc/″. The age of the universe for this redshift and cosmological model is 2.5 Gyrs. SMG SMMJ14011+0252 (Ivison et al., 2001; Frayer et al., 1999) is perhaps the best studied SMG across all wavebands, because it has a relatively bright multiwavelength contiuum, rest-frame optical emission lines with rather large equivalent widths, and moreover, is moderately gravitationally lensed (5) by the z0.25 galaxy cluster A1835 (see Ivison et al., 2001; Barger et al., 1999; Fabian et al., 2000; Ivison et al., 2000; Smail et al., 2000, 2002; Downes & Solomon, 2003; Tecza et al., 2004; Swinbank et al., 2004; Motohara et al., 2005; Smail et al., 2005). Ivison et al. (2000) gave the first detailed description of the source properties, and estimate a far-infrared luminosity of L⊙ and a star-formation rate SFR1260-3900 M☉ yr-1 (for a magnification of 3; see also Ivison et al., 2001). Tecza et al. (2004) re-analyzed the FIR data given in Ivison et al. (2000), estimating L⊙ and FIR star-formation rates M⊙ yr-1, where indicates the magnification by the gravitational lens. The differences are mainly due to different assumptions regarding the modelling of the spectral energy distributions in the far-infrared and different initial mass functions for the star-formation rates. Since the values used in Tecza et al. (2004) are better matched to the assumptions made in our paper, we will in the following use the values of Tecza et al. (2004).
Many SMGs show evidence for optically evident AGN through their rest-frame optical line ratios (Takata et al., 2006). Swinbank et al. (2005) interpret the broad recombination line profiles in some SMGs as likely originating from nuclear broad line regions. Deep photometry of SMMJ14011+0252 covers X-ray to radio wavelengths, and longslit spectroscopy has previously been taken in the rest-frame UV and optical range. None of these data have revealed evidence for an AGN in this source. All these arguments make SMMJ14011+0252 an ideal target to study the properties of strongly star-forming galaxies in the early universe.
The relationship of the molecular gas relative to other components of SMMJ14011+0252 however has led to controversy in the literature. Frayer et al. (1999) reported the first detection of CO(3-2) emission, and Ivison et al. (2001) emphasize a good alignment of the CO(3-2) emission with the faint red component J1n, indicating that this is the location of the intense submm emission and the starburst (see Fig. 1 for the labeling). This view was later challenged by Downes & Solomon (2003), who found a different alignment of their CO(7-6) and CO(3-2) data sets with the rest-frame UV data, placing the CO emission significantly outside the optical emission of J1. The CO emission is marginally resolved spatially (2″ 0.4″; Downes & Solomon, 2003), and its line width of km s-1 corresponds to a dynamical mass of M⊙ (Greve et al., 2005, not correcting for inclination). We note that this mass estimate is less than the estimate of the total molecular mass of SMMJ140110252 (Frayer et al., 1999; Downes & Solomon, 2003).
High-resolution HST F702W imaging shows that SMMJ140110252 has a complex morphology in the rest-frame UV, which does not become more regular in rest-frame optical wavebands (Ivison et al., 2000). Based on rest-frame UV spectroscopy, Ivison et al. (2000) were the first to argue that the nearby blue component J2 is at a very similar but not identical redshift, and is a physically related component of J1. The nature of the bright UV-optical continuum peak J1c remained more mysterious: Downes & Solomon (2003) proposed that J1c might be a member galaxy of the foreground cluster A1835 along the line of sight and suggested that several blue features of J1 were in fact multiple images caused by strong lensing through a foreground source J1c. Smail et al. (2005); Swinbank et al. (2004) agree with the interpretation that J1c is a foreground source, but favor a lower magnification factors , which would not lead to multiple images or strong differential lensing. They argue that absorption lines seen in the spectrum of Barger et al. (1999) can be identified as rest-frame optical absorption lines at z0.25, and highlight the nearly spherical morphology of J1c, both of which seem unlikely, if it is a lensed galaxy at z2.57.
In a previous paper (Tecza et al., 2004, hereafter Paper I), we presented an initial analysis of deep near-infrared integral field spectroscopy of SMMJ14011+0252 obtained with SPIFFI on the VLT, concentrating on the integrated properties of the source, such as the high gas-phase oxygen abundance (12[O/H]9.0, measured with ) and large mass, and put these results into a broader perspective of mass assembly in the early universe within hierarchical structure formation models. We complement these findings now through a detailed analysis of the spatially-resolved properties of this source, and we particularly discuss the implications for star formation and related feedback in massive galaxies at high redshift.
2. SPIFFI and Complementary Data Sets
SMMJ14011+0252 was observed in the J, H and K-bands with the integral field spectrometer SPIFFI (Eisenhauer et al., 2003) at the ESO VLT in spring 2003, with individual exposure times of 300 s in H, and 600 s in J and K. Total exposure times were 340 min in K, 95 min in H and 60 min in J. We used the 0.25″ pixel scale and obtained spectral resolutions of R=1500 in the J-, 2000 in the H-, and 2400 in K-bands.
The data were calibrated using the UKIRT faint standard FS135 and agree to within a few percent with the magnitudes previously published for SMMJ140110252 (Ivison et al., 2000). The seeing disk has FWHM″ 0.4″ in right ascension and declination, respectively and was measured from the standard star. The data reduction has been described elsewhere (Nesvadba et al., 2006a). The main difference between the data reduction in this paper and Paper I is improved sky subtraction allowing us to investigate the spatially-resolved properties of SMMJ140110252 more robustly. The previous reduction algorithm led to an effective oversubtraction of the sky background near bright emission lines. As a result, the data quality in individual frames was improved through the new reduction, which yielded a more accurate alignment of the individual frames, which led to a better data quality in the combined data set and a better spatial resolution. This has no significant impact on the integrated spectrum discussed in Tecza et al. (2004), but does change the mapping of kinematics and emission line morphologies by improving the signal-to-noise of the low surface brightness line emitting regions.
In addition, before and since the publication of Paper I, a large number of complementary data sets are (now) available to supplement and refine the interpretation of the SPIFFI data and the overall nature of the source. Ivison et al. (2001) obtained high-resolution optical imaging of the A1835 field through the F702W () filter of the WFPC2 on-board the HST. The reduced image was kindly provided by R. Ivison. He also kindly shared his 1.4 GHz continuum map of A1835 with us, which was obtained with the NRAO Very Large Array (VLA; Ivison et al., 2001). D. Downes kindly provided us with his CO (3–2) and 242 GHz continuum maps of SMMJ140110252 obtained with the IRAM Plateau de Bure Interferometer (PdBI; Downes & Solomon, 2003).
Deep ISAAC J, H, and K band images are available from the ESO archive and were reduced as described in Bremer et al. (2004). A deep VLT FORS1 V-band image of the field of A1835 was obtained, reduced, and is described in Lehnert et al. (2005). A. Barger kindly provided the rest-frame UV spectra taken with LRIS on the Keck 10m telescope and published in Barger et al. (1999). Finally, R. Pello and A. Hempel gratiously shared their F850LP () ACS image of SMMJ140110252 J1 and J2 before the data were publicly available.
3. Absolute Astrometry
Various possible and disparate alignments have been proposed for SMMJ140110252 in the literature (cf. Downes & Solomon, 2003; Ivison et al., 2001). The position of both the radio and mm interferometric positions relative to the rest-frame optical and UV have been especially problematic.
We obtained a new and more robust astrometry for the field of SMMJ140110252 using ISAAC K-band and FORS V-band imaging of A1835 (Lehnert et al., 2005). We identified six radio sources in the V-band image at magnitudes brighter than 17.5 mag (the V-band image has a 5 limit of 27.8 mag). Of these 6 sources, 3 were point sources at the resolution of the data (seeing FWHM0.7-0.8 arcsec) and 3 were extended. Given their high signal-to-noise, the uncertainty in the position is very small (0.08 arcsec). The depth and field of view of this image are greater than previously available optical/near-infrared data. The radio sources are spread over the roughly 66 field of view of the V-band image. A comparison of the radio source and optical positions suggests that the best alignment has an RMS scatter of ( less than the absolute positional uncertainty in each band). Such a good alignment suggests that both the position in each frame can be accurately determined and that the relative distortion in both the radio map and V-band image are insignificant compared to the total relative positional uncertainties over the entire field of view of the V-band image. All other optical/NIR data can be referenced to the V-band image to a very high accuracy given the large number of sources that we used for the relative alignment (several dozen point or point-like sources). The VLA radio and PdBI millimeter maps share the “radio” coordinate frame. We estimate a total absolute uncertainty of ( SPIFFI pixels) in right ascension and declination of the optical and near-infrared data relative to the CO position, including an absolute astrometric uncertainty in the CO map of 0.3″ (following Downes & Solomon, 2003) and a fiducial uncertainty of 0.14″ (the pixel size of the ISAAC data, which is certainly an over-estimate of the true uncertainty since the relative alignment is better than a pixel). The relative uncertainty between the VLA map and the optical/near-infrared data is smaller (by a factor of 4 to 8).
The aligned K-band ISAAC image was used to put the SPIFFI cubes into the common frame, based on the positions of J1 and J2 and assuming a pixel scale of 0.25″ for the SPIFFI data. J1 and J2 have signal-to-noise ratios 15 and 6 in the SPIFFI continuum image in the central pixel, respectively, and signal-to-noise ratios 30 and 11 in the ISAAC K band image, respectively. The alignment is limited by the uncertainty of the peak position in J1c and J2, which is much smaller than a single pixel in either data set (0.25″ for SPIFFI or 0.14″ for ISAAC).
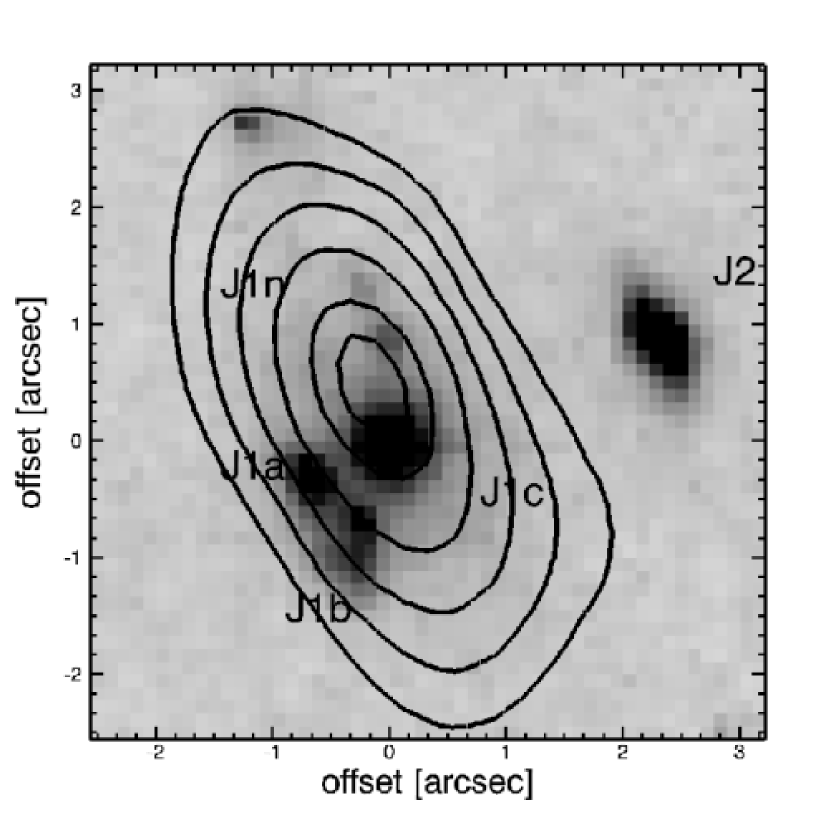
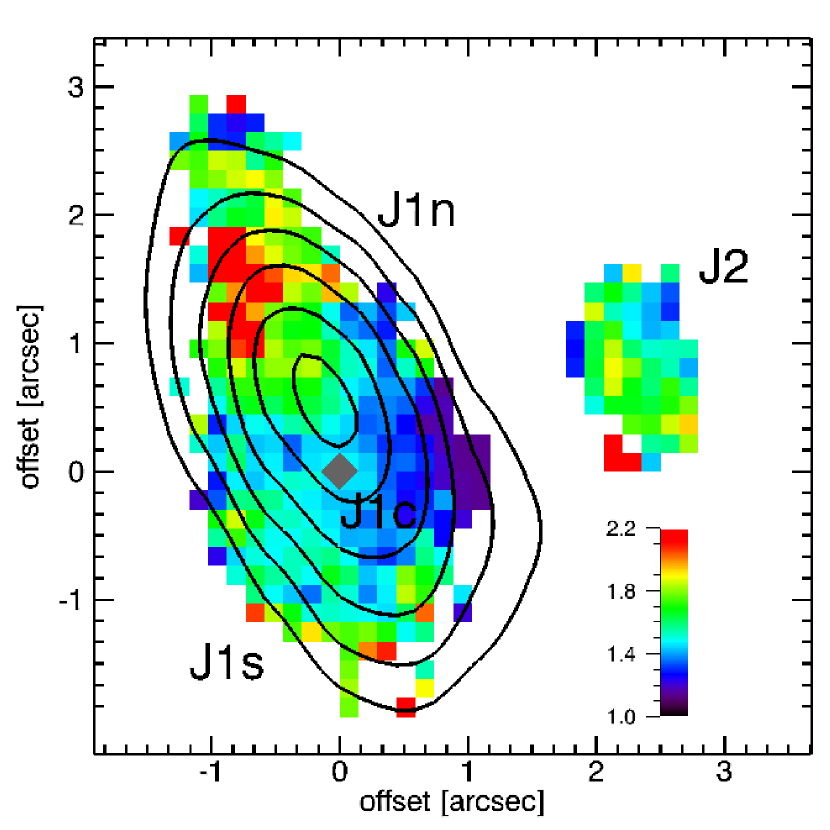
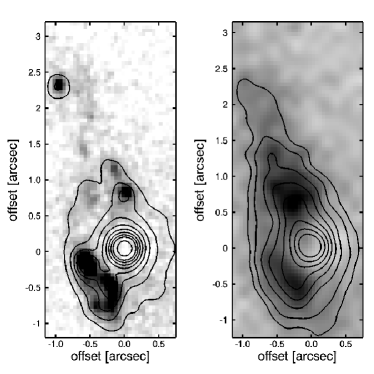
Our new astrometric alignment rules out previous claims that the CO emission might be significantly offset from the UV and optical positions, and is an independent confirmation of the inital alignment of Ivison et al. (2001), based on some new data sets. The position of the CO data is shown in Fig. 1 as contours overlaid on the HST image, and in Fig. 2 with respect to the ISAAC JK color image. Within the uncertainty of the CO emitter can be identified with either J1n or J1c. The redder colors and stronger star formation (§5.1) favor J1n as the more likely source of CO line emission. We summarize the positions of the individual components in SMMJ140110252 relative to the radio frame in Table 1. At any rate, this calibration firmly places the CO and radio emission within the isophotes of J1 in the HST (Ivison et al., 2000) and ground-based images (Ivison et al., 2000; Bremer et al., 2004; Lehnert et al., 2005).
4. Results and Analysis
4.1. Continuum Morphology and Colors
The rest-frame optical and UV continuum and H emission line morphology of the J1 complex have been described elsewhere (see, e.g. Ivison et al., 2000; Tecza et al., 2004; Motohara et al., 2005; Smail et al., 2005). Overall, our data are consistent with these previous descriptions, but deeper and more detailed in several aspects. We label individual components in Fig. 13.
| Component | R.A.(2000) | Decl.(2000) | Data | ||
|---|---|---|---|---|---|
| (2) | (3) | (4) | (5) | (6) | |
| J1c | 14:01:04.933 | 02:52:23.98 | 0.0 | 0.0 | F702W |
| J1a | 14:01:04.967 | 02:52:23.73 | 0.51 | 0.25 | F702W |
| J1b | 14:01:04.948 | 02:52:23.43 | 0.22 | 0.55 | F702W |
| J1n | 14:01:04.969 | 02:52:24.81 | 0.54 | 0.83 | SPIFFI |
| 1.4GHz | 14:01:04.92 | 02:52:24.80 | 0.20 | 0.83 | I01 |
| PdBI 1mm | 14:01:04.933 | 02:52:24.20 | 0.00 | 0.22 | D06 |
| PdBI 3mm | 14:01:04.933 | 02:52:24.37 | 0.00 | 0.39 | D06 |
| J2 | 14:01:04.806 | 02:52:24.73 | 1.90 | 0.75 | F702W |
Note. — Absolute positions in the radio frame of subcomponents from our revised astrometry. Uncertainties in the relative alignement of the CO are . Column (1) – Designations of the various regions defined with SMMJ140110252. In the text, since a majority of the data sets do not resolve J1a and J1b, we have used the designation J1s for the combined and surrouding emission of J1a and J1b. Column (2) – Right ascension. Column (3) – Declination. Column (4) – Relative offset to J1c in right ascension in arcsec. Column (5) – Relative offset to J1c in declination in arcsec. Column (6) – Data set used for measurement. F702W – WFPC2 data of Ivison et al. (2000). I01 – VLA 1.4 GHz radio data of Ivison et al. (2001) – D06 – PdBI CO data of Downes (2006, and private communication of currently unpublished data sets). SPIFFI – K-band IFU data set.
Continuum emission is centered on J1c and varies strongly with wavelength. At short wavelengths J1c is small and highly symmetric. At longer wavelengths the extended emission becomes relatively stronger. In Fig. 2 we show the JK band color distribution derived from the ISAAC data. The K band data were convolved with a two-dimensional Gaussian disk to have the same resolution as the J band data. K band fluxes are corrected for the H equivalent width measured with SPIFFI. Line contamination is 0.2 mag in J1n and insignificant in J1s.
JK colors (corresponding to roughly at rest-frame) are different in J1n and J1s, with JK in J1s. J band emission in J1n is relatively faint. We replaced the J band flux by the limit where we detected K, but no J band emission, so that the measured JK in J1n is in fact a lower bound to the JK color in J1n.
The red area in J1s coincides spatially with the bright knots J1a and J1b in the HST F702W image. We also identify these knots in the ISAAC K-band image. Comparison of the seeing-matched ISAAC and HST data sets indicates that the prominence of these knots in the HST data compared to the ground based images is in large parts due to the smaller PSF in the F702W image and does not reflect intrinsic variations in size with wavelength or strong line contamination. Unresolved blue knots superimposed on J1n in Fig. 3, however, should also appear at longer wavelength in spite of the lower resolution. We do not observe them while the low surface brightness region becomes more prominent in J1n. This indicates that these color variations reflect intrinsic variations in the morphology of J1n.
4.1.1 Line Ratio Diagnostics: Ionizing Source and Gas Densities
Line emission in J1 reaches the highest surface brightnesses in the areas of J1n and J1s, and is generally lower in J1c, as expected for a foreground galaxy. To differentiate between J1n and J1s, we assign all spatial pixels to J1n and J1s, if they are at least two SPIFFI pixels (0.5″, roughly corresponding to the seeing disk) north or south from J1c, respectively. The spectral range of our observations includes all strong optical emission lines between the [OII]3726,3729 and the [SII]6717,6731 doublets. We use emission line ratios, namely [OIII]/H, [NII]/H, and [SII]/H to constrain the ionizing source (e.g. Baldwin et al., 1981). All line ratios in the two-dimensional diagnostic diagrams are within the region of HII regions for all components. J1n falls on the dividing line between HII regions and LINERS (Osterbrock, 1989), similar to many other high-redshift sources showing high excitation (Erb et al., 2006; van Dokkum et al., 2005). This indicates that the bulk of the line emission in J1n and J1s arises from gas photoionized by hot massive stars and supports earlier X-ray measurements (Fabian et al., 2000), that the far-infrared emission from this system is powered by the starburst, without a measurable AGN component.
The H emission lines in J1n and J1s have a relative spectral shift of km s-1, significant at the level of . [NII]/H ratios are and in the integrated spectra of J1n and J1s, respectively. Line widths (and 1 scatter of individual line width measurements) are FWHM km s-1 in J1n, and are marginally narrower in J1s (FWHM km s-1) with large scatter across both components. We summarize the emission line properties in Table 2.
We calculate the extinction in the two regions from the observed H/H ratios (see Table 2), the Balmer decrement, and a Galactic extinction law, as described in Paper I, and extract the H line emission from the same regions as H. For J1n and J1s, we find and 1.3, respectively.
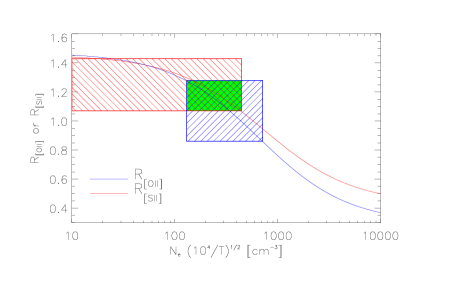
The [OII]3726,3729 and [SII]6717,6731 doublets are faint, but are spectrally resolved and have sufficient signal-to-noise ratios in the integrated spectrum to robustly measure the ratios of the two components, and for [SII] and [OII], respectively (see Table 2). For densities between and cm-3 and a given temperature, the ratio of the two components yields the electron densities. Assuming a “canonical” temperature K for HII regions (Osterbrock, 1989), our best-fit density estimate cm-3 (with favored values between 180 and 900 cm-3, see Fig. 5)
4.2. Morphology and Kinematics of the Emission Line Gas: Evidence for a Merger?
Fig. 1 of Paper I shows the continuum-subtracted H line image extracted from the SPIFFI data cube. H emission is extended both along and perpendicular to the direction of lensing shear in the two components of SMM140110252, J1 and J2. H line emission is detected in J1n and J1s.
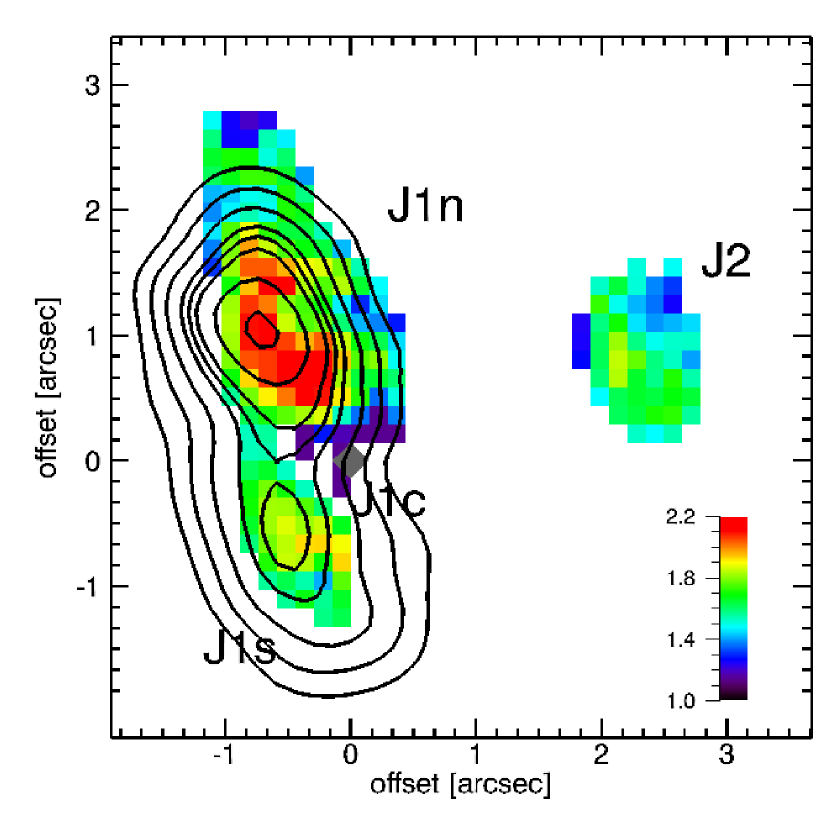
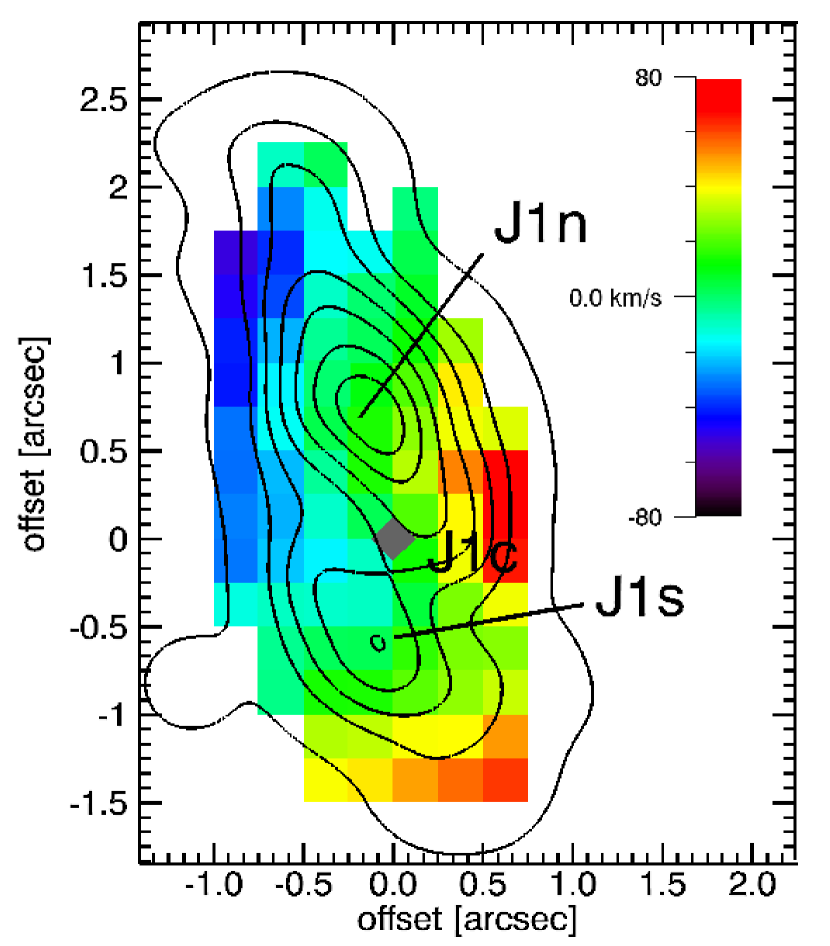
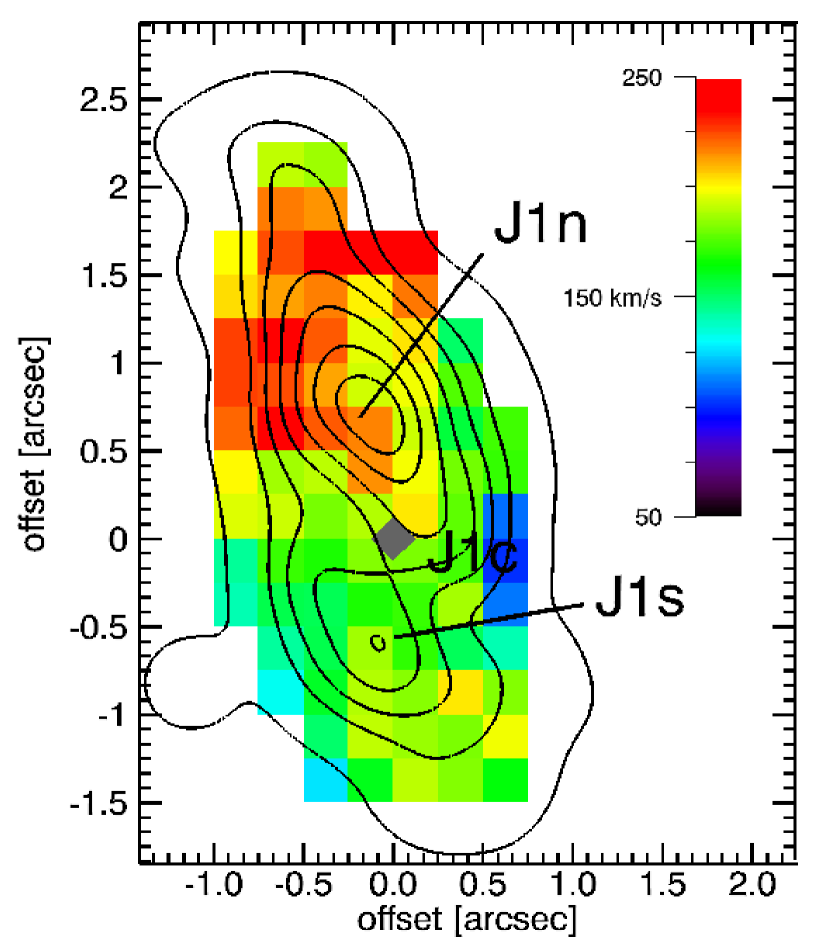
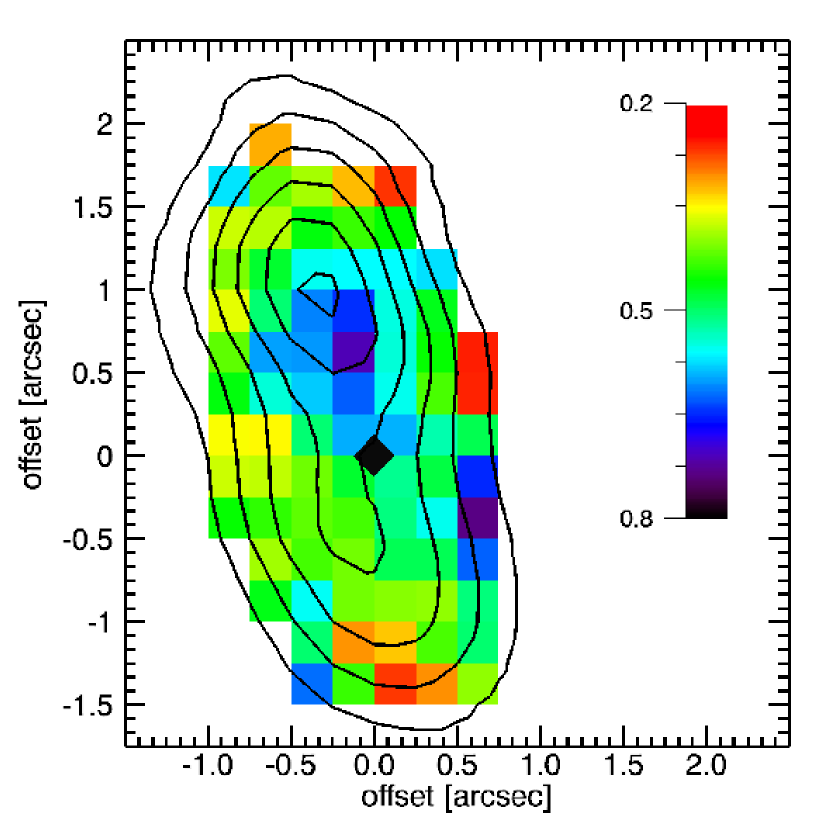
The SPIFFI K-band integral-field spectroscopy of J1 is of superb quality and allows us to map the intrinsic kinematics within J1 using the spectral positions of the H line cores (fitted with Gaussian line profiles) across an area of , with uncertainties of km s-1 (Fig. 7). With a spatial resolution of 0.4″0.6″ in right ascension and declination, respectively, corresponding to seeing disks. Hence, the data set is well resolved spatially. Velocity dispersions of the lines are 55106 km s-1 (corrected for the instrumental resolution). Velocities vary by 190 km s-1 with the steepest overall velocity gradient increasing from north-east to south-west. Although this gradient is continuous, it is not strictly monotonic, and the data suggest velocity shears along two axes, which coincide with the regions of maximum K band surface brightness in the J1c removed data sets (Fig. 7). The differences in the peak velocities in these two dynamical regions are highly significant () and are thus not consistent with a single velocity gradient.
The close spatial alignment between star-formation (traced by the H surface brightness), gravitational potential (traced by the velocity map), and stellar population (traced by the K band continuum and JK color) is intriguing (Fig. 7). This coincidence of the velocity shear, star-formation, and K-band continuum can be naturally explained if J1n and J1s are a close, likely merging, galaxy pair. Moreover, this hypothesis is supported by our population synthesis fits discussed in §4.4, which imply that J1n and J1s are dominated by stellar populations of different ages and extinctions, and they have different velocity dispersions (Fig. 7). At a projected distance of kpc, the internal dynamics of J1n and J1s appear to be driven by their own gravity. The evidence for this is our finding that both have velocity gradients which align well with their axes of the most extended K-band continuum emission. This indicates that the central parts of either components are likely still dominated by their individual potential wells.
We have also mapped the [NII]/H line ratios (Fig. 8) over most of J1, where both lines are detected at significance. Ratios are [NII]/H over most of J1s, in the typical range of metal-rich H II regions and galaxy nuclei in the nearby universe. [NII]/H ratios peak in J1n, about 0.8″ to the north from J1c, and ″ from the H peak. The maximum ratio is [NII]/H, which is significantly larger than the ratios generally found in HII regions (Pettini & Pagel, 2004; Osterbrock, 1989, and references therein), and is more typical of starburst nuclei in the local universe (e.g., Lehnert & Heckman, 1996a). By analogy, this possibly indicates a strong shock component due to an outflow (see §6 for a detailed discussion). [OIII]5007 and H are found (at lower signal-to-noise) near the [NII] surface brightness peaks in J1n and J1s, consistent with this hypothesis.
4.3. Relationship between Gas and Continuum Emission
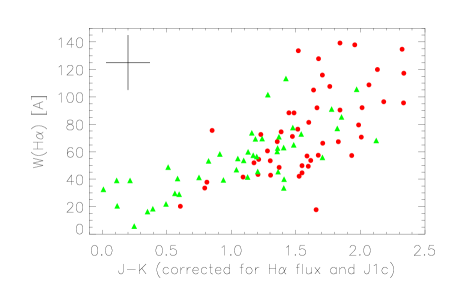
In both J1n and in J1s, the brightest H emitting regions are also the regions with the reddest colors. Rest-frame equivalent widths are Å and are positively correlated with color in J1n and J1s, with significances better than in non-parametric tests (low values indicate a highly significant correlation; Fig. 3). The positive correlation is a clear indication that the reddening is related to star-formation in regions with variable and high extinction rather than the age of the stellar population. If the red colors indicated the age of the stellar population, we would expect that the reddest regions of the galaxy in would be the ones with the lowest H equivalent widths.
In the case of SMMJ14011+0252, however, the highest equivalent widths are reached in the reddest areas, indicating that the color is indeed due to variable and high extinction, rather than an age spread in the stellar populations in both J1n and J1s. In addition, where the surface brightness of line emission is intense enough to allow for a robust measure of H, the reddest regions also have high H/H ratios. This supports the hypothesis that the color variation is more likely due to reddening than to large differences in ages of the stellar populations. Our finding also implies, however, that significant numbers of H photons escape, perhaps a sign for an irregular, clumpy dust distribution. Chapman et al. (2004) reach a similar conclusion based on the differences in structure in high resolution radio maps compared to high resolution imaging in the rest-frame UV. It is also possible that a favorably oriented starburst-driven wind (§6) is giving a less obscured view to some of the starburst region.
4.4. Population Synthesis Models and the Role of J1c
As outlined in the Introduction, the nature of the optical and near-infrared continuum peak J1c is difficult to constrain. It has a nearly circular symmetry which led Smail et al. (2005) conclude that J1c cannot be gravitationally lensed and is thus not at the redshift of SMM140110252 (and in agreement with Swinbank et al., 2004, that some of absorption lines in the Barger et al. spectrum are coincident with optical absorption lines from a galaxy at z=0.25). Moreover, its smooth, featureless light profile does not appear typical for a strongly star-forming dusty galaxy at high redshift seen in the rest-frame UV. Both arguments, although circumstantial, imply that J1c could be a foreground object along the line of sight which is not physically related to the SMG. Unfortunately, the observed wavelengths of some of the optical absorption lines at the redshift of the foreground cluster A1835 are degenerate with UV absorption lines at the redshift of the SMG (Swinbank et al., 2004; Smail et al., 2005), so that the spectrum is not necessarily a unique constraint.
We constucted an azimuthally averaged light profile of J1c from the F850LP ACS image of SMMJ14011+0252. To this one-dimensional profile, we fit a Sersic profile convolved with the PSF (estimated using a nearby star in the ACS image), obtaining a good fit with a Sersic model model of index and a half-light radius, ″. The spatial resolution is ″. We then subtract this fit from the ACS image. Fit residuals are % in a 0.5″ box aperture centered on J1c, and are likely due to deviations in the core of the PSF from our simple Gaussian model and/or extended emission from the sources J1s and J1n contaminating the fitted light distribution of J1c. The left panel of Fig. 9 shows the J1c removed F850LP ACS image.
We estimate the impact of J1c in each waveband by convolving our best-fit Sersic model from the ACS image with the PSF appropriate for each individual band and scaling to the measured peak brightness of J1c. This scaled, smoothed Sersic model is then subtracted from each image centered on the position of J1c. Namely, we obtain magnitudes of R mag, Z mag, J mag, H mag, and K mag extracted from a 3″ aperture centered on J1c in the HST F702W WFPC2 and F850LP ACS images, and the ISAAC J, H, and K band images, respectively. For the best-fit Sersic models to J1c, integrated over 3″ apertures, we find R mag, Z mag, J mag, H mag, and K mag in these bands. We use the fit residuals in each band to constrain whether the light profile varies significantly with wavelength. Overall fit residuals are 15-20% with random spatial distribution, consistent with a light profile of J1c that is not a strong function of wavelength (for illustration we use the K band data in the right panel of Fig. 9). Our goal is to give an upper limit on the overall impact of J1c on the submm source, which might lead to an oversubtraction and is conservative. However, doing the subtraction this way will lead to a region centered on J1c that is essentially at the background average in each image and appear as a hole in the source (Fig. 9). Thus the detailed morphology of J1n and J1s over the region of J1c should not be overinterpreted (i.e., the hole in the light distribution is likely not real and is not therefore a sign of strong shear for example). The S/N and rather coarse sampling in the SPIFFI data do not allow a similar correction for the spectra (except in the case of the H equivalent widths that are enumerated in Fig. 6).
Deriving the magnitudes in the F702W, F850LP, J, H, and K bands based on the scaled Sersic model, we fit the SED of J1c using the stellar population synthesis package of Bruzual & Charlot (2003) for solar metallicity and a Chabrier IMF. The SED is consistent with that of a z=0.25 galaxy with an 9 Gyr old stellar population of total mass M⊙. We do not find any suitable model when placing J1c at , which supports the interloper hypothesis for J1c. For an isothermal sphere and assuming that the projected half light radius is the half mass radius of the galaxy, the stellar mass estimate corresponds to a velocity dispersion which is consistent with km s-1 adopted by Smail et al. (2005).
From the data sets with J1c removed, we investigate the stellar populations in J1s and J1n, assuming continuous star-formation histories, solar metallicity, and a Chabrier IMF. Using only one star-formation history and model is all that is justifiable given the considerable uncertainties in removing J1c, and the overall faintness of J1n and J1s. For J1s, our fits are consistent with a Gyr old stellar population in J1s, mag extinction, and a mass of M⊙ (with the magnification factor ). For J1n, we find a yrs old stellar population, A mags, and a stellar mass of about M⊙. These age estimates are in approximate agreement with what would be estimated from the values of the rest-frame H equivalent widths. Fig. 6 shows that the rest-frame equivalent widths of H are typically about 80 and 120 Å for the most intense H emitting regions of J1s and J1n respectively. Models of continuous star formation and solar metallicity imply ages of a few 100 Myrs or less, with higher equivalent widths corresponding to younger ages (Leitherer et al., 1999). The H to H line ratios imply significant extinction in both J1n and J1s, as discusssed in §4.1.1 and shown in Table 2.
These mass estimates are likely only lower limits. To isolate the individual components, we extract the photometry from square apertures with 1.5″ on each side (which is at least twice the seeing disk in any of the images). From a sample of 20 SMGs and optically faint radio galaxies with ACS imaging, Smail et al. (2004) find half-light diameters D 1.5″- 3″. For =3-5 this implies that we are underestimating the stellar mass by a factor , depending on the exact morphology and light profile of J1n. Moreover, our population synthesis fits might be biased by the strong and clumpy extinction discussed in §4.2. Consequently, we likely underestimate the overall age and extinction and hence the stellar mass. This also raises worries that a significant fraction of the total stellar population might be undetected due to strong extinction, if the most strongly dust-enshrouded areas are optically thick to the rest-frame R-band continuum (observed K band). This concern of course generically applies to photometric studies of dusty high-redshift galaxies. Therefore analyzing spectra appears to be more promising for estimating the physical properties of these dusty systems.
We will in the following adopt M⊙ as the stellar mass of J1n (correcting by a conservative factor due to light not considered in the SED fit). We warn that given the relatively crude manner in which this estimate was made, and the intrinsic difficulty in estimating the mass and star-formation properties in heavily obscured galaxies from UV/blue optical SEDs, our estimates are comparably uncertain.
5. Characteristics of a High-redshift Starburst
5.1. Star-formation Intensity
Observations of low-redshift starburst galaxies suggest a fundamental upper threshold for the star-formation rate in galaxies (Lehnert & Heckman, 1996b; Meurer et al., 1997). Such an upper limit may be indicative of self-regulation processes limiting the gas collapse (and subsequent star-formation) through the negative feedback of superwinds (e.g., Lehnert & Heckman, 1996b, see also §6) or perhaps dynamical processes and disk instabilities (e.g., Meurer et al., 1997). It is therefore interesting to investigate how SMMJ140110252 J1 relates to the “maximal burst” galaxies observed at low redshift.
For low-redshift star-forming galaxies, Meurer et al. (1997) propose an upper bound of SFR M⊙ yr-1 kpc-2 within one half-light radius . The exact value of the maximal star-formation intensity depends on the choice of cosmology, the form of the chosen initial mass function, the relative role of extinction, the ability to measure half-light radii accurately at wavelengths where a substantial fraction of the bolometric luminosity originates, etc., and thus the numerical value of this threshold should not be interpreted too strictly. However, it does provide a useful guide on when star-formation becomes “maximal” – whatever the cause (see also Lehnert & Heckman, 1996a, b; Tacconi et al., 2006). Do extreme stabursts in high-redshift galaxies have similar intensities? We will in the following adrdress this question empirically, comparing the star-formation intensity in SMMJ14011+0252 with low redshift starbursts (Lehnert & Heckman, 1996b), using the same techniques. Such an estimate does not depend on the strength of the gravitational lensing, because surface brightness is conserved and % of the H emission is due to the wind component (§6), which is negligible.
We estimate the half-light area in H, , by counting the pixels in J1n and J1s, respectively, that are above the 50% percentile of the flux distribution (following the method of Erb et al., 2003). In J1n and J1s we find (68 kpc2), and (56 kpc2), respectively. Using the measured H/H decrements from these regions to correct the H emission line fluxes for extinction, we estimate intrinsic H fluxes, in J1n and in J1s, respectively. We follow Kennicutt (1998) with a 1-100 M⊙ Salpeter IMF to estimate star-formation rates, i.e. we adopt SFR = , where the H luminosity is given in Watts. Our adopted IMF gives a total star-formation rate similar to that if we had adopted a more appropriate IMF such as a Kroupa or Chabrier, namely 450 M⊙ yr-1 in J1n and 150 M⊙ yr-1 in J1s, respectively. We thus find star-formation rate densities of 7 M⊙ yr-1 kpc-2 in J1n and 3 M⊙ yr-1 kpc-2 in J1s, respectively. In either case, the intensities are well below the limit suggested by Meurer et al. (1997).
Star-formation rates based on H luminosities tend to be lower by up to about an order of magnitude compared to estimates based on infrared luminosities. This is because the most intense star-forming regions are likely to be optically thick to dust at the wavelength of H, so that the total star-formation rate will be under-estimated. Using the FIR-estimated star-formation rate of Paper I for a 1-100 M☉ Salpeter IMF, 1920 M☉ yr-1, and the measured half-light radius of the H emission, we find M⊙ yr-1 kpc-2. Using the FWHM of the CO emission line region to estimate the diameter of the star-forming region (1.6″0.5″and 2.5″0.5″ Downes, 2006), we find a similar star-formation intensity of M☉ yr-1 kpc-2. Both estimates are within the range of the M☉ yr-1 kpc-2 that Tacconi et al. (2006) found for a sample of SMGs using high resolution CO observations. (To mitigate against the considerable uncertainties in calibrating star-formation intensities from surface brightnesses, we note that the FIR luminosity of J1 from Paper I, L☉, and the CO radius of Downes (2006), correspond to a surface brightness of L☉ in J1, compared to a 90% percentile of the effective surface brightness, L☉ kpc-2, given by Meurer et al., 1997).
In spite of the large uncertainties of each method, none of the estimates for J1 exceeds the star-formation intensities in low redshift “maximal burst” galaxies.
The most fundamental physical motivation to posit a stringent upper bound to the star-formation rate in a self-gravitating system comes from causality. This limit is given by consuming all of the gas (modulo a star-formation efficiency per unit gas mass) within one dynamical time, either a crossing or free fall time scale (see, e.g., Lehnert & Heckman, 1996b). Tacconi et al. (2006) find that none of the SMGs, including SMMJ140110252, violate causality arguments. Specifically, within the context of such a hypothesis, Tacconi et al. find that SMGs form stars with efficiencies similar to those seen in local galaxies and star-forming regions, 0.1-0.3, and within a few dynamical timescales. Our results here suggest that SMMJ140110252 does not violate the stringent causality limits either.
5.2. No “new mode” of star-formation
At low redshift, only ULIRGs reach similarly large infrared luminosities as SMGs, L⊙, whose properties are typically attributed to the effects of massive gas collapse during major mergers (Sanders & Mirabel, 1996). Motivated by the extended nature of star formation in SMMJ140110252, Goldader et al. (2002) hypothesize that there might be an intrinsically more efficient mechanism of star formation at high redshift, with no equivalent in the local universe, which does not require a major merger to trigger extreme star formation.
Our data do not confirm this hypothesis, in fact, they rather point towards SMMJ14011+0252 being a merger (§4.2). As discussed previously, our data do not indicate a higher intensity of star formation than at low redshift, and the half-light radii of H emission are similar to those of low-redshift ULIRGs, correcting for gravitational magnification of SMMJ140110252. For example, the largest H half-light radius we find in the data set of Colina, Arribas, & Monreal-Ibero (2005), in the same way as for SMMJ140110252 (see above), is 2.1 kpc, compared to kpc for J1n (for a magnification ). We conclude that we do not find evidence for a peculiar, more efficient “high-redshift” star-formation mode in SMMJ140110252.
6. A Starburst-driven Superwind at
6.1. Properties of the Superwind
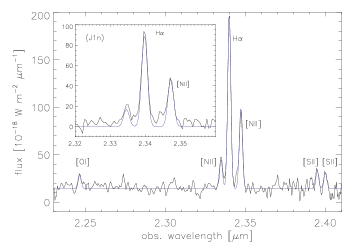
Actively star-forming galaxies with intensities exceeding 0.1 M⊙ yr-1 kpc-2 are known to drive “superwinds”, irrespective of redshift (Heckman, 2003). SMMJ140110252 J1 easily surpasses this limit (§5) and can therefore be expected to drive such a wind. Blue asymmetries in emission line profiles, e.g. H and [NII]6583 line profiles are common in starburst galaxies in the local Universe with substantial evidence for driving vigorous outflows (Lehnert & Heckman, 1996a), and are also the most common evidence for winds at high redshift. Velocity offsets of a few 100 km s-1 in UV absorption lines tracing the ISM relative to the systemic redshift are also frequently used as evidence for winds (Shapley et al., 2003; Swinbank et al., 2005). In J1, rest-frame UV absorption lines are blueshifted relative to H by km s-1 (Ivison et al., 2000; Tecza et al., 2004), and we also observe blue wings of H and [NII]6583 emission lines in J1n (see the inset of Fig. 4). Gaussian fits to the residuals have relative offsets of km s-1 between line wing and core for the H lines and km s-1 for [NII] in J1n. About % of the H flux is in the wing, and % of [NII]6583. J1s does not have a pronounced blue wing.
The wavelength-coverage and quality of our J1 data sets are outstanding for a strongly starforming galaxy at , allowing for a more detailed analysis to firmly establish that starbursts and outflows in high redshift galaxies are causally linked by the same basic mechanism as at low redshift. Starburst-driven winds at low redshift are caused by thermalized ejecta of supernovae and stellar winds producing an over-pressurized, expanding bubble of hot, X-ray emitting gas, which sweeps up, entrains, accelerates, and ionizes the ambient interstellar medium (Heckman et al., 1990). This results in high gas pressures and shock-like optical emission line ratios. Positive correlations between ionization state and line widths have been observed at low-redshift (e.g. Lehnert & Heckman, 1996a; Rupke et al., 2005), implying that the relative importance of shock heating increases as the gas is accelerated to outflow velocities of a few hundred km s-1, where the emission line luminosity rapidly increases with increasing shock speed (Dopita & Sutherland, 1995).
For J1 we can investigate each of these properties explicitly. [NII]6583/H line ratios are in the integrated emission of J1n, which is generally higher than observed in HII regions (photo-ionization by massive stars), and can be easily caused by shocks. The [NII]/H line ratio in the wings of J1n is 0.83 indicating a higher shock contribution in the outflowing gas. We also find a good correlation between [NII]6583/H ratio and [NII]6583 line width in J1n (left panel of Fig. 10), but not in J1s. We also find no correlation with H line widths (right panel of Fig. 10), similar to nearby “superwind” galaxies (Lehnert & Heckman, 1996a).

With the electron densities derived in §4.1.1 we estimate the pressure of the electron gas using the conversion given in Lehnert & Heckman (1996a) and considering that much of the [SII] and [OII] lines fluxes are produced in partially ionized zones of the nebulae (Shull & McKee, 1979): , or P dyn cm-2 for the electron densities cm-3 derived in 4.1.1. This is in excellent agreement with the pressures in the nuclei of nearby starburst galaxies with evidence for driving superwinds (Lehnert & Heckman, 1996a), and is factors higher that the pressure of the local ISM in the Milky Way, providing the necessary prerequisite for an expanding or outflowing gas bubble.
However, compared to low-redshift starburst galaxies, the wind in J1 seems to have a relatively high surface brightness. Maximum H surface brightnesses in the low redshift sample of Lehnert & Heckman (1996a) are pc-2 and for our cosmology would correspond to an observed flux W m-2 pix-1 at the redshift of J1, about an order of magnitude lower than the total H flux in the wing of J1 (% of the total H flux, or W m-2 pix-1). This might be due to a higher gas fraction in J1, leading to a larger covering factor of gas clouds that are being shocked. Tacconi et al. (2006) estimate a gas fraction of in SMGs supporting such speculation.
Since the wind causes a correlation between [NII]6583/H ratio and the [NII] line width, we also investigate its impact on the overall velocity field (Fig. 7), again using correlations between the spatially resolved emission line properties to localize and compare the signatures of mechanical heating and kinematic parameters. The upper and lower panels of Fig. 11 show the correlations between line properties for the H and [NII]6583 lines in J1n, respectively. The data are given separately for spatial pixels with high and low [NII]/H ratios. Empty squares indicate spatial pixels where [NII]/H, filled dots show spatial pixels where [NII]/H. Line widths and fluxes are correlated for [NII], tracing the stronger contribution of mechanical heating in the blueshifted [NII] gas, but none of the other line properties appear to be correlated. In particular, the position of the line centroids are not correlated with flux or line width (middle and right panels), suggesting they are dominated by large-scale gravitationally-driven motion similar to low-redshift starburst galaxies (e.g., Lehnert & Heckman, 1996a). This is the case for pixels with high and low [NII]/H ratios. Fully consistent with the integrated spectrum (Paper I), this shows that gas ionization is dominated by the ionizing photons from the intense star-formation, and that the velocities traced by the H line centroids are not overall significantly altered by the wind.

6.2. Self Regulated Star-Formation?
As discussed previously, there are several arguments about what might be regulating star formation within galaxies (see also, e.g., Tacconi et al., 2006; Lehnert & Heckman, 1996b), including negative feedback from the superwind, if the overpressureized bubble can plausibly provide pressure support. Can this hypothesis explain the variation of velocity dispersions in J1, and limit the rate of star-formation? Adopting a disk geometry, this scenario implies that gas collapse can be balanced if the momentum flux injection, , is comparable to the midplane pressure, . In hydrostatic equilibrium, is,
where and are the surface mass densities of all of the matter and just the gas in units of M⊙ kpc-2 and M⊙ kpc-2, respectively. We use the size of molecular emission (FWHM2.2″0.5″ Downes & Solomon, 2003), the molecular gas mass estimated in Paper I (and references therein), and our dynamical mass estimate, M M⊙(see §8), to estimate a total midplane pressure, dynes cm-2. The pressure provided by the wind can be derived from the total momentum flux of the outflow. Following Heckman et al. (1990) and Lehnert & Heckman (1996a) we parametrize the momentum injection by the wind as dynes, where is the infrared luminosity in units of 1011 L⊙. With the infrared luminosity estimated in Paper I, 2.610, this implies a momentum flux injection rate of 810 dynes, similar to the most powerful local starbursts (Heckman et al., 1990). With the above size estimate, we find 1510-9 dynes cm-2. This implies and for and 3, respectively. Although this is somewhat smaller than unity if taken at face value, given the large uncertainties this is clearly consistent with the notion that star formation may be self-regulated through its own feedback in the most powerful starbursts, in particular at high redshift.
7. The Blue Component J2 – Intrinsic Properties and a Probe for the Dynamical Mass of J1
Our data sets also include component J2 of SMMJ140110252, which is about 1.3″ to the north-west from J1c. J2 is considerably bluer than J1 at observed optical wavelengths (e.g., Ivison et al., 2000). Smail et al. (2005) pointed out that its rest-frame UV colors are similar to those of Lyman-break galaxies, although its redshift is relatively low for such a comparison. Our population synthesis fits (see §4.4) indicate a yr old stellar population with M⊙ stellar mass and mag. This implies an older and more massive stellar population than favored by Motohara et al. (2005), although it is nonetheless a consistent result, because Motohara et al. only compared their photometry with an instantaneous burst and a yrs old continuous star-formation episode.
As noted by previous authors (e.g., Ivison et al., 2001; Tecza et al., 2004), the spectrum of J2 is blueshifted by km s-1 with respect to J1. In addition to detecting H, we also identify [NII]6583 line emission in the K band, and the [OIII]4959,5007 doublet in the H band. H was not detected in J2, probably because of a nearby strong night sky line (see Table 2 for the emission line properties).
These results differ from those of Motohara et al. (2005), who identified H, but not [OIII]. The discrepancy is easily explained by the lower resolution of their data () and unfortunate spectral positions of the emission lines (H is near a strong night-sky line, [OIII]5007 lying within a set of a strong telluric absorption features). We measure a limit on the H flux, Wm-2, compatible with relatively low extinction as indicated by the blue, “LBG-like” colors of J2 (see e.g. Smail et al., 2005), , and an extinction corrected (lensed) H luminosity W, which corresponds to a star-formation rate of M⊙ yr-1. For a magnification , the star-formation rate is M⊙ yr-1, lower than the typical rates in UV-selected, star-forming BX galaxies at similar redshift (e.g. Erb et al., 2003), and two orders of magnitude less than the highest estimates of the star-formation rates in J1.
H emission in J2 extends over and is offset from the continuum peak by ″ to the north-east. Extracting both line and continuum information from the same data cube and the reasonable signal-to-noise of both the line and continuum emission imply that this offset is significant. We do not measure a significant velocity gradient in the H line emitting gas, but measure an intrinsic FWHM km s-1, for a reasonable set of assumptions about the mass distribution, corresponds to a dynamical mass of M M⊙.
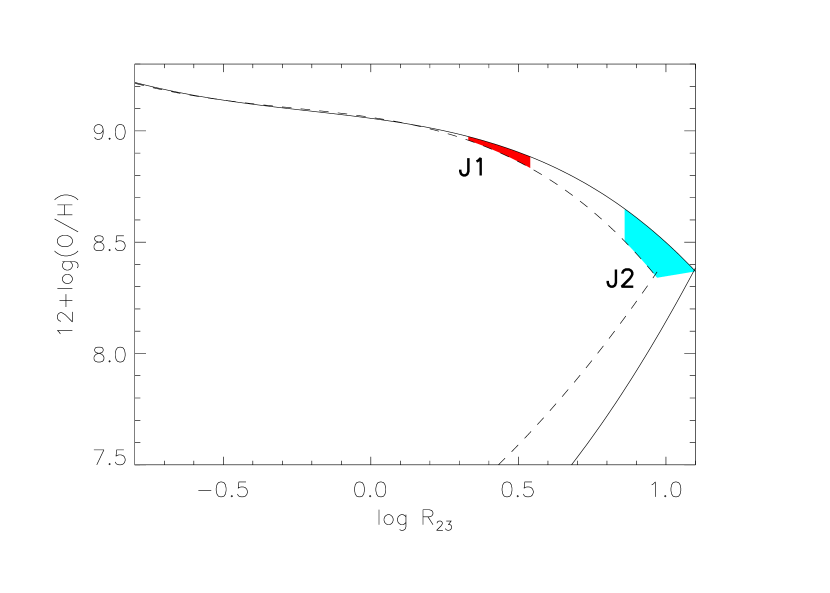
We calculate the [O/H] abundance of J2 from R23 to compare with the J1 abundance discussed in Paper I and to investigate whether the two components have similar or distinct evolutionary histories. As seen in Fig. 12, oxygen abundances are significantly different in J1 and J2, using the 3 upper limit on H to determine the abundance in J2. The [NII]/H ratio of in J2 indicates that the upper branch is appropriate for estimating the metallicities.
The position of J2 in the emission line diagnostic diagrams of Osterbrock (1989) is also interesting. The [SII] line doublet is not detected in J2. The upper limit on the H flux only provides a lower limit for the [OIII]/H ratio. The emission line diagnostic ratios and excitation diagrams indicate comparably high ionization for J2, placing it near the limit of the AGN portion of the diagram. The distinct position of J2 indicates higher ionization or temperature compared to J1, and is likely a direct consequence of the lower metallicity of J2 (and perhaps a concomitant lower dust content).
The orbit of J2 can also be used to estimate an approximate dynamical mass of J1, which is particuarly valuable, as the complex velocity field in J1 makes it difficult to robustly estimate a dynamical mass estimate from the intrinsic kinematics. Following Paper I we add M⊙ in gas to the M⊙ of stellar mass we found in §4.4. J1 appears to dominate the overall baryon budget by about an order of magnitude, which is consistent with the narrow line widths in J2 compared to J1n, and is certainly suggested by our astrometry which places the peak of the CO emission within the emission of J1n. Placing the barycenter on J1n, we use a simple virial estimate for the mass, M⊙, where G is the gravitational constant, is the relative velocity between J1 and J2 in units of 100 km s-1, and is the distance between J1 and J2 in kpc. Since true inclination, eccentricity, form of the potential, etc., are all unconstrained and the physical separation is unknown, the true mass is likely factors of a few larger (both radius and velocity for example are seen in projection).
8. Surface Mass Densities and the Future Evolution of SMMJ14011+0252 and other SMGs
In addition to the high dynamical masses of SMGs (Genzel et al., 2003; Greve et al., 2005), mass densities (Tacconi et al., 2006), their luminosity-weighted ages, high star-formation rates, and possibly strong clustering indicate that they will likely evolve into massive early-type galaxies in cluster environments at low redshift (Smail et al., 2004, and references therein). Interestingly, the characteristics of local galaxies also seem highly dependent on their mass surface densities (and perhaps less so on their overall mass), as suggested by a recent analysis of Kauffmann et al. (2006). They studied nearly 400,000 low-redshift galaxies drawn from the Sloan Digital Sky Survey (SDSS), and find significant differences between the structural parameters of early and late type galaxies which does not strongly depend on the total mass of the galaxy. Namely, they find that concentration parameters and stellar mass surface densities M☉ kpc-2 correspond to the regime of galaxy spheroids and bulges, independent of the total stellar mass of these systems. Above this threshold of mass surface density, they find that star formation is increasingly suppressed (the specific star formation rate is low) and must have ceased many Gyrs ago. As a consequence, Kauffmann et al. (2006) hypothesize that with increasing compactness and surface density of the galaxy, stars were formed in short, vigorous episodes at high redshift, with extended periods of inactivity (Kauffmann et al., 2006, parameterize this in terms of a consumption time scale, t). Substantial growth at later epochs was then only possible through mergers of galaxies with low gas fractions. To identify SMM140110252 and other SMGs as “spheroids in formation”, it is therefore not sufficient to address their large masses or even their dynamical mass densities given their high gas fractions and unknown dark matter distributions. They must also have high stellar mass densities, short gas consumption time scales, and strong feedback suppressing further star-formation. Do SMGs have all these properties?
Our analysis of the stellar mass surface density in SMMJ14011+0252 J1 is that it is at the transition value of M⊙kpc-2 and the dynamical estimate of the mass surface density in SMMJ14011+0252 J1 is M☉ kpc-2, well above the transistion. The stellar masses () and average half-light radius ( kpc) of a large sample of SMGs (e.g., Smail et al., 2004), suggest average stellar mass surface density of M☉ kpc-2. Similar estimates can be made from dynamical mass estimates and sizes from CO interferometric observations (109 M☉ kpc-2 for stars, gas, and possible contributions from dark matter; Tacconi et al., 2006; Greve et al., 2005). It appears that SMMJ14011+0252 and SMGs in general have sufficiently high mass surface densities to be above the critical point in the study of Kauffmann et al. (2006).
Population synthesis fits of the stellar population of SMM140110252 yield ages of up to a few 100 Myrs, similar to the ages of typical radio detected SMGs with spectroscopic redshifts ( few 100 Myrs; Smail et al., 2004). Based on the infrared luminosity and the gas mass, we estimate a gas consumption time scale of about 30-40 Myrs for SMM140110252. From a larger sample of SMGs with CO detections, Greve et al. (2005) set a limit on the gas consumption time scale of 40 Myrs, consistent with that for SMM140110252. Thus individual SMGs appear to be forming most of their stars in intense bursts of moderate duration (a few 100 Myr). In addition, their star-formation appears to be highly “bursty” independent of the duration of the star-formation. The duty cycles of SMGs have been estimated through a variety of methods to about (Chapman et al., 2005; Bouché et al., 2005; Genzel et al., 2003; Tecza et al., 2004; Blain et al., 2004). Again, SMGs seem to form their stars in intense bursts of modest durations with long periods of relative inactivity. To explain the fractions of local galaxies with strong 4000Å breaks, Kauffmann et al. (2006) infer gas consumption time scales of 100 Myrs, similar to estimates of SMGs.
As discussed in §6, SMM140110252 is driving a vigorous superwind. While the importance of starburst driven winds to galaxy evolution is generally agreed upon, they are not thought to be powerful enough or to accelerate material to the escape velocities of the most massive galaxies (Heckman et al., 2000). However, SMM140110252 is driving a wind, which at the very least will lower the overall star-formation efficiency of SMM140110252 (see discussion in §5.1 and §6.2). If this is indeed a general characteristic of SMGs, then the role of winds in their ultimate evolution could be substantial.
Hence, the “submillimeter bright phase” of galaxies is characterized by high surface mass densities, above the interesting dividing point of the characteristics of local galaxies as found by Kauffmann et al. (2006). Their star formation appears to be episodic (duty cycle of 0.1) and of relatively short duration (few 100 Myrs, e.g., Smail et al., 2004), and they have evidence for feedback which we have suggested may regulate the intensity of their star-formation. This adds further evidence that SMGs do indeed have all the characteristics necessary to become local massive early type galaxies.
9. Summary
We presented an integral-field study of the rest-frame optical emission line gas in the SMMJ140110252 J1/J2 complex, allowing unprecedented insight into the nature of a high-redshift starburst and its outflow. Identifying J1c as a z0.25 interloper through Sersic profile and SED fitting, we removed the seeing-matched J1c contamination from the images, and find that J1n and J1s appear as individual components in all wavebands, at a projected distance of a few kpc. The positions of these two components are in excellent agreement with the distribution of H emission in our SPIFFI H map and also with the H velocity field, which is reminiscent of two nearby co-rotating disks which are marginally resolved spatially. Including J2, SMMJ14011+0252 thus appears as a triple system. From the J2 orbital motion, we estimate a dynamical mass of M⊙ for the J1n/J1s complex.
The dust-enshrouded J1n is the most massive component, as indicated by its stellar mass, few M⊙ (compared to M⊙ for J1s and J2), and the bright CO line emission, which coincides with J1n within the astrometric uncertainties. The starburst in J1n is “maximal” with similar intensity ( M⊙ yr-1 kpc-2) comparable to the apparent limit at low redshift. The H half-light radius is similar to the H half-light radii in low-redshift ULIRGs. Overall, star formation in J1n is intense, but its properties do not greatly differ from low-redshift ULIRGs, highlighting the similarity between SMGs and ULIRGs at optical wavelengths, i.e., in the extended gas. Given these similarities and the complex large-scale kinematics, J1 does not appear to be a good candidate for an alternative, highly efficient “high-redshift mode” of star-formation, but appears governed by similar rules as low-redshift galaxies with intense star-formation, although it may be “scaled up” (Tacconi et al., 2006).
The intense starburst in J1 drives a superwind, as evident from blue emission line asymmetries, offsets between rest-frame UV interstellar absorption lines relative to H, and enhanced [NII]6583/H line ratios in J1n. The [NII]/H ratios correlate with [NII] line width, indicating an increasing contribution of mechanical heating as the gas is accelerated in the wind, similar to low redshift starburst-driven winds. Measured densities (from the [OII]3726,3729, [SII]6717,6731 doublets) indicate pressures of dynes cm-2, similar to pressures estimated in the expanding bubbles of over-pressurized hot gas in local starburst galaxies. These results are a direct indication that the basic physics of starburst-driven winds are rather similar at low and at high redshift, and supports the approach of studying local starburst galaxies to better understand the basic mechanisms of high-redshift galaxy formation. The strong wind may explain why H equivalent width and reddening in SMMJ14011+0252 are positively correlated, which is likely a sign of patchy extinction.
The bluer component of the SMMJ140110252 system, J2, is very different from J1, with mass M⊙ estimated from the narrow emission lines and SED fitting. Its gas-phase oxygen abundance, measured from R23, , about 0.4 dex lower than in J1 (Paper I). This signals that the two galaxies have had independent evolutionary histories, and that J2 is likely going to be accreted by the more massive J1n.
The “submillimeter bright phase” of galaxies, which SMM140110252 is now in, is characterized by high surface mass densities, their star formation appears to be episodic and of relatively short durations, and they have evidence for feedback. These are just the characteristics needed to form early type spheroid dominated galaxies in the local Universe (Kauffmann et al., 2006). We find that only J1n has the necessary stellar mass surface density M☉ kpc-2, while the blue components appear less concentrated. With their current star-formation time scales, however, it appears unlikely that they are likely to substantially change the final characteristics of the most massive component J1n.
References
- Baldwin et al. (1981) Baldwin, J. A., Phillips, M. M., & Terlevich, R. 1981, PASP, 93, 5
- Barger et al. (1999) Barger, A. J., Cowie, L. L., Smail, I., Ivison, R. J., Blain, A. W., & Kneib, J.-P. 1999, AJ, 117, 2656
- Blain et al. (2002) Blain, A. W., Smail, I., Ivison, R. J., Kneib, J.-P., & Frayer, D. T. 2002, Phys. Rep., 369, 111
- Blain et al. (2004) Blain, A. W., Chapman, S. C., Smail, I., & Ivison, R. 2004, ApJ, 611, 725
- Bouché et al. (2005) Bouché, N., Lehnert, M. D., & Péroux, C. 2005, MNRAS, 364, 319
- Bremer et al. (2004) Bremer, M. N., Jensen, J. B., Lehnert, M. D., Schreiber, N. M. F., & Douglas, L. 2004, ApJ, 615, L1
- Bruzual & Charlot (2003) Bruzual, G., & Charlot, S. 2003, MNRAS, 344, 1000
- Chapman et al. (2004) Chapman, S. C.,Smail, I., Windhorst, R., Muxlow, T., & Ivison, R. J. 2004, ApJ, 611, 732
- Chapman et al. (2005) Chapman, S. C., Blain, A. W., Smail, I., & Ivison, R. J. 2005, ApJ, 622, 772
- Colina, Arribas, & Monreal-Ibero (2005) Colina, L., Arribas, S., & Monreal-Ibero, A. 2005, ApJ, 621, 725
- Dopita & Sutherland (1995) Dopita, M. A., & Sutherland, R. S. 1995, ApJ, 455, 468
- Downes & Solomon (2003) Downes, D. & Solomon, P. M. 2003, ApJ, 582, 37
- Downes (2006) Downes, D., private communication
- Eisenhauer et al. (2003) Eisenhauer, F., et al. 2003, Proc. SPIE, 4841, 1548
- Erb et al. (2003) Erb, D. K., Shapley, A. E., Steidel, C. C., Pettini, M., Adelberger, K. L., Hunt, M. P., Moorwood, A. F. M., & Cuby, J. 2003, ApJ, 591, 101
- Erb et al. (2006) Erb, D. K., Steidel, C. C., Shapley, A. E., Pettini, M., Reddy, N. A., & Adelberger, K. L. 2006, ApJ, 644, 813
- Fabian et al. (2000) Fabian, A. C., et al. 2000, MNRAS, 315, L8
- Frayer et al. (1999) Frayer, D. T., et al. 1999, ApJ, 514, L13
- Genzel et al. (2003) Genzel, R., Baker, A. J., Tacconi, L. J., Lutz, D., Cox, P., Guilloteau, S., & Omont, A. 2003, ApJ, 584, 633
- Goldader et al. (2002) Goldader, J. D., Meurer, G., Heckman, T. M., Seibert, M., Sanders, D. B., Calzetti, D., & Steidel, C. C. 2002, ApJ, 568, 651
- Greve et al. (2005) Greve, T. R., et al. 2005, MNRAS, 359, 1165
- Heckman et al. (1990) Heckman, T. M., Armus, L., & Miley, G. K. 1990, ApJS, 74, 833
- Heckman et al. (2000) Heckman, T. M., Lehnert, M. D., Strickland, D. K., & Armus, L. 2000, ApJS, 129, 493
- Heckman (2003) Heckman, T. M. 2003, Revista Mexicana de Astronomia y Astrofisica Conference Series, 17, 47
- Ivison et al. (2000) Ivison, R. J., Smail, I., Barger, A. J., Kneib, J.-P., Blain, A. W., Owen, F. N., Kerr, T. H., & Cowie, L. L. 2000, MNRAS, 315, 209
- Ivison et al. (2001) Ivison, R. J., Smail, I., Frayer, D. T., Kneib, J.-P., & Blain, A. W. 2001, ApJ, 561, L45
- Kauffmann et al. (2006) Kauffmann, G., Heckman, T. M., De Lucia, G., Brinchmann, J., Charlot, S., Tremonti, C., White, S. D. M., & Brinkmann, J. 2006, MNRAS, 367, 1394
- Kennicutt (1998) Kennicutt, R. C. 1998, ARA&A, 36, 189
- Lehnert & Heckman (1996a) Lehnert, M. D. & Heckman, T. M. 1996a, ApJ, 462, 651
- Lehnert & Heckman (1996b) Lehnert, M. D. & Heckman, T. M. 1996b, ApJ, 472, 546
- Lehnert et al. (2005) Lehnert, M. D., Förster Schreiber, N. M., & Bremer, M. N. 2005, ApJ, 624, 80
- Leitherer et al. (1999) Leitherer, C., et al. 1999, ApJS, 123, 3
- Liu & Kennicutt (1995) Liu, C. T., & Kennicutt, R. C. 1995, ApJS, 100, 325
- Meurer et al. (1997) Meurer, G. R., Heckman, T. M., Lehnert, M. D., Leitherer, C., & Lowenthal, J. 1997, AJ, 114, 54
- Mihos & Hernquist (1996) Mihos, J. C., & Hernquist, L. 1996, ApJ, 464, 641
- Motohara et al. (2005) Motohara, K., et al. 2005, AJ, 129, 53
- Nesvadba et al. (2006a) Nesvadba, N. P. H., et al. 2006a, ApJ, accepted, astro-ph/0606530
- Nesvadba et al. (2006b) Nesvadba, N. P. H., et al. 2006b, ApJ, accepted, astro-ph/0606527
- Osterbrock (1989) Osterbrock, D. E. 1989, Astrophysics of Gaseous Nebulae and Active Galactic Nuclei, (University Science Books: Mill Valley, CA)
- Pettini et al. (2001) Pettini, M., Shapley, A. E., Steidel, C. C., Cuby, J., Dickinson, M., Moorwood, A. F. M., Adelberger, K. L., & Giavalisco, M. 2001, ApJ, 554, 981
- Pettini & Pagel (2004) Pettini, M., & Pagel, B. E. J. 2004, MNRAS, 348, L59.
- Rudnick et al. (2003) Rudnick, G., et al. 2003, ApJ, 599, 847
- Rupke et al. (2005) Rupke, D. S., Veilleux, S., & Sanders, D. B. 2005, ApJS, 160, 115
- Sanders & Mirabel (1996) Sanders, D. B., & Mirabel, I. F. 1996, ARA&A, 34, 749
- Shapley et al. (2003) Shapley, A. E., Steidel, C. C., Pettini, M., & Adelberger, K. L. 2003, ApJ, 588, 65
- Shull & McKee (1979) Shull, J. M., & McKee, C. F. 1979, 227, 131
- Smail et al. (2000) Smail, I., Ivison, R. J., Owen, F. N., Blain, A. W., & Kneib, J.-P. 2000, ApJ, 528, 612
- Smail et al. (2002) Smail, I., Ivison, R. J., Blain, A. W., & Kneib, J.-P. 2002, MNRAS, 331, 495
- Smail et al. (2004) Smail, I., Chapman, S. C., Blain, A. W., & Ivison, R. J. 2004, ApJ, 616, 71
- Smail et al. (2005) Smail, I., Smith, G. P., & Ivison, R. J. 2005, ApJ, 631, 121
- Swinbank et al. (2004) Swinbank, A. M., Smail, I., Chapman, S. C., Blain, A. W., Ivison, R. J., & Keel, W. C. 2004, ApJ, 617, 64
- Swinbank et al. (2005) Swinbank, A. M., et al. 2005, MNRAS, 359, 401
- Takata et al. (2006) Takata,T., Sekiguchi, K., Smail, I., Chapman, S.C., Geach, J.E., Swinbank, M.A., Blain, A., Ivison, R.J., ApJ, accepted, astro-ph/0607580
- Tacconi et al. (2006) Tacconi, L. J., et al. 2006, ApJ, 640, 228
- Tecza et al. (2004) Tecza, M., et al. 2004, ApJ, 605, L109 (Paper I)
- van Dokkum et al. (2005) van Dokkum, P. G., Kriek, M., Rodgers, B., Franx, M., & Puxley, P. 2005, ApJ, 622, L13
| Region | ID | z | FWHMobs | FWHMint | flux | ||
|---|---|---|---|---|---|---|---|
| (1) | (2) | (3) | (4) | (5) | (6) | (7) | (8) |
| J1n | H | 6563 | 2.5651 0.00052 | 2.3397 0.00047 | 23 1 | 259 19 | 2.030.12 |
| J1n | [NII] | 6583 | 2.5654 0.00053 | 2.3471 0.00048 | 26 2 | 305 32 | 1.050.07 |
| J1n | [NII] | 6548 | 2.5658 0.00058 | 2.3349 0.00053 | 31 6 | 377 75 | 0.530.04 |
| J1n | [SII] | 6717 | 2.5654 0.00068 | 2.3949 0.00063 | 26 10 | 296 113 | 0.260.03 |
| J1n | [SII] | 6731 | 2.5663 0.00093 | 2.4001 0.00087 | 32 18 | 373 209 | 0.290.03 |
| J1n | [OIII] | 5007 | 2.5652 0.00064 | 1.7851 0.00045 | 14 6 | 188 87 | 0.170.02 |
| J1n | H | 4861 | 2.5657 0.00061 | 1.7333 0.00041 | 11 5 | 118 58 | 0.130.02 |
| J1n | [OII] | 3727 | 2.5656 0.00085 | 1.3289 0.00044 | 16 8 | 349 179 | 0.210.03 |
| J1s | H | 6563 | 2.5656 0.00052 | 2.3401 0.00048 | 22 2 | 240 25 | 1.090.07 |
| J1s | [NII] | 6583 | 2.5658 0.00056 | 2.3474 0.00051 | 22 4 | 238 51 | 0.470.04 |
| J1s | [NII] | 6548 | 2.5667 0.0013 | 2.3354 0.0012 | 66 27 | 835 348 | 0.430.03 |
| J1s | [SII] | 6717 | 2.5726 0.00085 | 2.3997 0.00079 | 33 15 | 388 181 | 0.280.02 |
| J1s | [SII] | 6731 | 2.5578 0.00066 | 2.3944 0.00062 | 14 9 | 104 68 | 0.140.03 |
| J1s | H | 4861 | 2.5658 0.00060 | 1.7333 0.00041 | 14 5 | 194 72 | 0.17 0.02 |
| J1s | [OIII] | 5007 | 2.5655 0.00069 | 1.7853 0.00048 | 13 7 | 178 102 | 0.110.02 |
| J1s | [OII] | 3727 | 2.5669 0.00094 | 1.3294 0.00049 | 23 10 | 506 216 | 0.230.02 |
| J2 | [OIII] | 5007 | 2.5636 0.00057 | 1.7843 0.00040 | 13 3 | 50 | 0.28 0.04 |
| J2 | [OII] | 3727 | 2.5649 0.0007 | 1.32860.0003 | 16 5 | 50 | 0.090.007 |
| J2 | H | 4861 | 0 | 0 | 0 | 0 | 0.09 |
| J2 | H | 6563 | 2.5635 0.00055 | 2.3387 0.00050 | 14 3 | 50 | 0.310.04 |
| J2 | [NII] | 6583 | 2.5628 0.0013 | 2.3454 0.0012 | 2429 | 50 | 0.070.02 |
Note. — Column (1) – Regions as defined in Fig. 13. Column (2) – Line identification with wavelength given in Column (3). Column (3) – Rest-frame wavelengths in Å. Column (4) – Observed wavelengths in m. Column (5) – Redshift of the line calculated using the wavelength in Column (3). Column (6) – Full-width at half-maximum measured in Å. Column (7) – Intrinsic FWHMs corrected for instrumental resolution in units of km s-1. Column (8) – Line fluxes in units of 10-20 W m-2.