11email: jvogel@aip.de 22institutetext: Department of Physics, University of Warwick, Coventry, CV4 7AL, UK
An in-depth study of the pre-polar candidate WX LMi
Optical photometry, spectroscopy and XMM-Newton ultraviolet and X-ray observations with full phase coverage are used for an in-depth study of WX LMi, a system formerly termed as a low-accretion rate polar. We find a constant low mass accretion rate, M⊙ yr-1, a peculiar accretion geometry with one spot not being accessible via Roche-lobe overflow, a low temperature of the white dwarf, K and the secondary likely being Roche-lobe underfilling. All this lends further support to the changed view on WX LMi and related systems as detached binaries, i.e. magnetic post-common envelope binaries without significant Roche-lobe overflow in the past. The transfer rate determined here is compatible with accretion from a stellar wind. We use cyclotron spectroscopy to determine the accretion geometry and to constrain the plasma temperatures. Both, cyclotron spectroscopy and X-ray plasma diagnostics reveal low plasma temperatures below 3 keV on both accretion spots. For the low , high plasma at the accretion spots in WX LMi, cyclotron cooling is dominating thermal plasma radiation in the optical. Optical spectroscopy and X-ray timing reveal atmospheric, chromospheric and coronal activity at the saturation level on the dM4.5 secondary star.
Key Words.:
stars: individual: WX LMi– stars: magnetic field – X-rays: stars1 Introduction
Polars are magnetic cataclysmic binaries consisting of a late-type main-sequence star and a strongly magnetic white dwarf locked in synchronous rotation (see Warner (1995) for a comprehensive survey of cataclysmic variable stars). In normal polars accretion happens via Roche-lobe overflow and accretion streams towards the magnetic poles where the accretion energy is released mainly as X-ray thermal radiation, optical cyclotron radiation and a prominent soft X-ray component. The soft component makes them prominent sources in the soft X-ray sky and they were found numerously in the ROSAT all-sky survey. The detection bias is large and the true space density highly uncertain. Recently a few systems with very low accretion rate (a factor 100 – 1000 below the canonical values for Roche-lobe overflow) were uncovered in optical spectroscopic surveys (HQS: Hagen et al. 1995, SDSS: York et al. 2000). They were identified on the basis of highly peculiar optical spectra with broad cyclotron harmonics in emission mimicing quasar emission lines. They could form an important part of the population of close interacting binaries, being either normal CVs in extended low states or pre-CVs on their track towards Roche-lobe overflow. Recently, pushed forward by the work by Schmidt et al. (2005) evidence grows to regard these systems as pre-CVs. They might serve as tracers to uncover the unbiased sample of magnetic CVs.
WX LMi (HS 1023+3900) was discovered by Reimers et al. (1999) from the Hamburg Quasar Survey. From optical and spectroscopic follow-up observations they determined a period of about 167 minutes and two accretion spots with a field strength of 60 MG and 68 MG, respectively. The accretion rate was found to be M⊙/yr, i.e. orders of magnitudes below the normally observed accretion rate in polars. A spectral type of dM4.5 gave a good spectral fit for the secondary and was used to deduce a distance of pc. Schwarz et al. (2001) used optical photometry, performed with the Potsdam 70 cm telescope in UBVRI, to determine a stable long-term ephemeris based on the timings of optical maxima from the primary accretion spot. During the whole monitoring campaign covering half a year the system was in a similar low state of accretion with the one exception of a flare which was located on the active secondary. From the colors at the orbital phase when both accretion spots are invisible the spectral type of the secondary was likewise determined to be M4.5. Using the relative magnitude in the I band at photometric minimum yields a distance of 100 pc.
WX LMi as well as the similar objects termed LARPs (Low Accretion Rate Polars, Schwope et al. (2002)) was not discovered in the ROSAT All Sky Survey despite its relatively short distance. WX LMi was in the off-axis field of two X-ray ROSAT PSPC pointings (10 and 13 ksec) and discovered at a rate of 0.004 cts/sec. The very low number of photons did not allow to extract a proper X-ray spectrum and to determine the origin of the X-rays, being either accretion-induced or from the active corona of the secondary. We thus performed new X-ray observations with XMM-Newton in order to study magnetic accretion in an extreme combination of the parameters, which control the process of energy release, i.e. at very low specific accretion rate and at high magnetic field. The X-ray observations of WX LMi were accompanied by near-ultraviolet observations with the OM onboard XMM-Newton. It was used as a bolometer in order to determine the white dwarf photospheric temperature. This should help to decide if the LARPs are normal polars in an occasional state of very low accretion or pre-cataclysmic binaries that never have been accreting. Our newer X-ray and UV observations are analysed together with phase-resolved optical spectroscopic observations performed already back in 1999. Since the overall brightness of WX LMi does not change, the two data sets can be combined without problem and thus allow a broader picture of the relevant spectral components.
The paper is organized as follows. In Section 2 the new optical and X-ray observations and the reduction steps are described. In Sect. 3 we begin the analysis by an in-depth study of the spectral features from the secondary which constrains the spectral types, the distance, its activity and the binary parameters. In Sect. 3.2 we describe our modeling of the phase-resolved cyclotron spectra, which constrains the locations of the accretion spots and the temperatures in the accretion plasmas. Sect. 3.3 describes our attempts to understand the OM-filter observations and Sect. 3.4 finally gives an analysis of the X-ray spectrum.
| Date | Instrument | Wavelength | Resolution | No. of |
|---|---|---|---|---|
| (Y/M/D) | range [Å] | [Å] | spectrab | |
| 1999/3/9 | TWIN | 3800-9900 | 6/4a | 47 |
| 1999/3/10 | TWIN | 3800-9900 | 6/4a | 56 |
| 1999/3/18 | MOSCA | 3380-8410 | 13 | 29 |
a for the blue/red channel
b integration time 300 seconds each
2 New optical and X-ray observations
2.1 Optical photometry – updated ephemeris
Schwarz et al. (2001) fixed the ephemeris of the system using photometric data covering a period of six month. The primary maxima of the V band data pinned down the epoch of zero phase and the variability of the light curves in VRI was used to establish the period. We performed additional photometric observation with the Potsdam 70cm telescope in V band on April 28 2004 and March 21 2005. These observations revealed the system to be at the same brightness as during our monitoring observations in 1999 and also showed the same variability pattern. A linear regression to all observed primary V band maxima between 1999 and 2005 yield a period of 0.11592364(43) days. Our spectroscopic observations from March 1999 determine the inferior conjunction of the secondary. The epoch of the blue-to-red zero crossing of the NaI-lines (see Sect. 3.1.3) was used as the spectroscopic zero point. This yields the updated ephemeris
| (1) |
where the number in brackets represent the uncertainty. The difference between spectroscopic and photometric phase zero is 0.168 phase units. The phase used in this paper refers to this spectroscopic ephemeris.
2.2 Optical spectroscopy
WX LMi was observed with the Calar Alto 3.5m telescope at two occasions in March 1999. The double-beam spectrograph TWIN was used for the first run in March 9–11, the multi-object spectrograph MOSCA for the second run on March 18/19. Low-resolution gratings with reciprocal dispersions of 144 Å/mm and 108 Å/mm were used for the TWIN observations resulting in a spectral coverage of 3800–6900 Å and 6700–9900 Å in the blue and red channels at a spectral resolution of about 6 and 4 Å, respectively. A series of 47 spectra with exposure time of 5 minutes each were obtained in the night March 9/10 (BJD 2451247.484406 – 2451247.671117), another series of 56 spectra with the same exposure time in the following night (BJD 2451248.375258 – 2451248.596263). All binary phases were thus covered by spectroscopic observations.
Spectrophotometric standards were observed in the same nights and used for calibration of the spectral response. However, the weather conditions were rather poor during the TWIN observations with transparency variations by 100%. Hence, we could not use the standard star observations to put the spectra of WX LMi on an absolute scale, we could just determine the spectral slope. The nearby star GSC2-N23233202253 ( (2000): 10:26:27.5, (2000): +38:45:03, distance to WX LMi: ) was used as comparison star and also placed on the spectrograph’s slit. We tried to use the variable signal of this star for a photometric calibration of the spectra of our target. This attempt turned out not to be successful since the photometric variations showed color-terms, likely to be different between the target and the comparison star (likely/possible reasons for that being a slight misalignement of the spectrograph slit, observation not being performed at the parallactic angle, the different spectral slopes of the target and the comparison).
Instead we used our photometric observations at the 70cm telescope to calibrate our spectra (assuming no overall change of brightness and color). This approach was also not found to be free of problems since the wavelength ranges of the spectrograph channels were too narrow to cover more than one (red) or two (blue) filters completely which made a correction of the color terms rather uncertain.
He/Ar arc lamp spectra were observed for calibrating the dispersion. Flexure of the spectrograph resulted in considerable shifts of line positions on the CCD of up to 0.6 pixels. These were measured in each spectrum individually by correlating the night-sky spectrum with a template. These time-dependent shifts were then approximated by a low-order polynomial and the dispersion relation was shifted per spectrum according to those fits. The late-type stars Gl213, Gl268, and Gl273 were observed as possible template stars for the main-sequence secondary in WX LMi through wide and narrow slits in the night of March 10.
We followed a similar observational strategy for the MOSCA observations by placing the same comparison star on the spectrograph’s slit and obtained 29 exposures of 5 minutes each in the night March 18/19 between UT 22:45 and 1:41 (BJD 451256.454120 – 2451256.576432), i.e. we covered a bit less than one orbital cycle of the 167 min binary. The B500 grism was used as a disperser resulting in a spectral coverage 3380 – 8410 Å with about 13 Å (FWHM) resolution. Similar to the TWIN observations, small remaining shifts of the positions of the night sky lines in each spectrum were used to improve the dispersion relation which was originally based on HgNeAr arc lamp spectra.
Also the MOSCA observations suffered from large transparency variations by almost 100%. This time these variations could rather successfully corrected for with the help of the comparison star observed through the same slit. A further complication arose from the fact that no spectrophotometric standard stars could be observed during that night. A photometric calibration of the MOSCA spectra was achieved by assuming that the orbital mean spectrum of WX LMi was unchanged between the TWIN and the MOSCA observations, an assumption which is justified by our long-term photometry (Schwarz et al., 2001). Division of the uncalibrated mean MOSCA spectrum by the calibrated mean TWIN spectrum yielded an instrumental response curve for the MOSCA observations.
2.3 XMM-Newton X-ray and ultraviolet observations
We performed ultraviolet and X-ray observations of WX LMi with XMM-Newton in April 2004 for about 30 ksec, covering 3 orbital cycles. Calibrated photon event tables for all detectors were computed with SAS version 6.5. Since the spectrum turned out to be very soft, the SAS task epreject was used to extend the usable energy range down to 0.12 keV. Barycentric correction was applied using barycen. The spectra were extracted from the event tables with SAS tasks evselect and especget. The light curve was obtained running the edetect_chain pipeline on time selected event tables containing all events ocurred in a given orbital phase interval.
The EPIC PN was operated in full frame imaging mode, yielding 800 counts from the source. Both EPIC MOS cameras were operated in partial window mode, yielding both 200 counts. The observing time with the OM was spent in nearly equal shares with the U and UVW1 filters centered on 3440 Å and 2910 Å, respectively. The detector was used in fast mode for the full observation. The mean countrates in the U and UVW1 filters were 2.12 s-1and 0.75 s-1, respectively.
| Sp | |||||||
|---|---|---|---|---|---|---|---|
| 4 | -0.613 | 0.220 | 7.53 | 4.37 | 3.08 | 103 | 130 |
| 4.5 | -0.676 | 0.179 | 7.95 | 4.46 | 2.62 | 85 | 104 |
| 5 | -0.740 | 0.147 | 8.37 | 4.56 | 2.15 | 70 | 82 |
3 Analysis
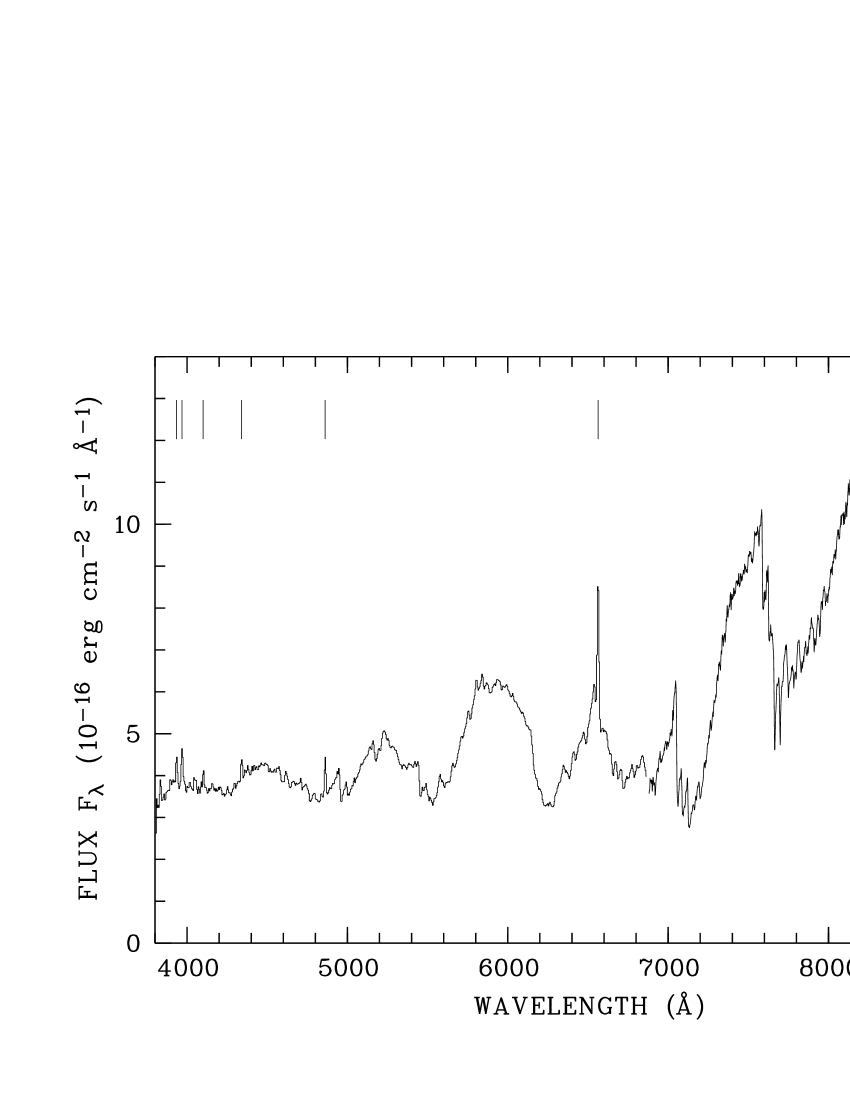
Fig. 1 shows the mean orbital spectrum of WX LMi obtained with the TWIN (longward 6800 Å) and MOSCA spectrographs. It shows the same features as described by Reimers et al. (1999), i.e. an M dwarf dominating the red spectral range, a white dwarf which is responsible for the spectral upturn in the blue range and several pronounced cyclotron lines, the most prominent one at 5950 Å. The higher spectral resolution and the partly better signal provided by the observations presented here allows individual spectral features to be resolved and studied. The most prominent ones are the H-Balmer emission lines and the NaI absorption lines at 8183/94 Å. We therefore begin our analysis with an optical spectroscopic study focusing on the secondary star and the optical cyclotron spectrum.
3.1 The secondary in WX LMi – optical spectroscopy
3.1.1 Spectral type of the secondary
In order to determine the spectral type of the secondary we make use of
the TWIN spectra obtained in the red channel.
The spectral type is not determined straightforwardly due
to the wavelength- and phase-dependent background component from the white
dwarf (photospheric and beamed cyclotron radiation from two accretion spots).
The remaining calibration uncertainties, as described above, gave rise to some
additional complication.
We firstly shifted all spectra to radial velocity zero using the sine fit to
the Na radial velocity curve (see below). We then selected only those
spectra which were not too heavily affected by atmospheric absorption,
i.e. those with the best signal-to-noise ratio, and calculated an average
spectrum.
We adapted a non-magnetic model atmosphere of the white dwarf
to the average spectrum in a wavelength region free of any cyclotron emission
and subtracted the same scaled model spectrum from all selected observed
spectra. This left us with phase-dependent spectra containing only the
secondary and the cyclotron lines.
In order to constrain the spectral type of the secondary
we decided to use the narrow-band spectral indices TiO5 and
VO-a (Cruz & Reid (2002), Kirkpatrick et al. (1999)).
According to those papers these indices correlate best with the spectral
type. We also tried the PC3 index (Martín et al., 1999) although we did regard the
results less reliable since the two continuum side bands have a relatively
large separation and the index is therefore much more sensitive to variations
of the underlying cyclotron radiation.
We determined the indices for all spectra, eliminated those indices where the
spectral features were found superposed on a cyclotron line and finally
calculated average indices. The TiO5 index thus determined was ,
the VO-a index , and the PC3 index to .
The given errors reflect the statistical
uncertainty and the uncertainty which originates from the subtraction of the
white dwarf model spectrum. The measured indices resulted in spectral types
of M5.0, M4.5, and M4.5. We finally adopted a spectral
type of M4.5 with an uncertainty of half a subclass. This new
determination of the spectral type based on spectral data with sufficient
resolution is in good agreement with the estimates of Reimers et al. (1999)
and Schwarz et al. (2001) based on spectroscopy with much lower resolution
and broad-band optical photometry, respectively.
Beuermann et al. (1998) have shown that the color can be used as
tracer of the spectral type. A parameterization of the Sp- relation
was given as a third-order polynomial. Due to the high field strenght in WX LMi the -Band
is likely uncontaminated by cyclotron radiation (see Fig. 12 for the wavelength of
the cyclotron fundamental for both poles), thus allowing to determine a spectral
type of M4 for (Schwarz et al., 2001) and
(2MASS database) in accordance with the above value. Beuermann et al. (1998)
have also shown that most CV secondaries with between 2 and 5 hours
are cooler than expected for Roche-lobe filling ZAMS stars.
Nuclear evolution prior to mass transfer and lack of thermal equilibrium
due to mass loss were mentioned as possible causes of this discrepancy.
We will argue below that both options likely do not apply here
suggesting the presence of a Roche-lobe underfilling main-sequence secondary
in WX LMi.
3.1.2 The distance to WX LMi
The composite nature of the emission from cataclysmic variables, particular in the optical, makes it difficult to perform a straightforward distance measurement. We do not make use of Roche lobe geometry, since the secondary is possibly somewhat underfilling. The simple use of the distance modulus also doesn’t seem to be appropriate, since the secondary is clearly deformed as evidenced from ellipsoidal modulations (Fig. 4, bottom panel). We assume that the secondary in WX LMi is a ZAMS star with solar metallicity and make use of the surface brightness - spectral type and - spectral type relations compiled by Beuermann & Weichhold (1999). We use radii from the compilations of Beuermann et al. (1999). Absolute magnitudes and masses for the possible spectral types are derived from Delfosse et al. (2000). The results are summarized in Table 2.
The distance via the surface brightness assumes that the 2MASS -band magnitude is solely due to the secondary star. The measured flux deficit in the TiO feature was corrected for the contribution of the white dwarf at this wavelength. For the most likely spectral type, M4.5, our distance estimates give 85 and 100 pc, respectively, with a relatively large spread of about 20 pc. We regard the derived distance via the relation somewhat more reliable, since the photometric data are not affected by the calibration problems of our spectroscopy. If the secondary would behave like most of the CV secondaries at the given , the radii would be larger than given in Tab. 2 and the distance would increase. We thus use in the following a distance of 100 pc to WX LMi.
3.1.3 Emission and absorption line radial velocity variations
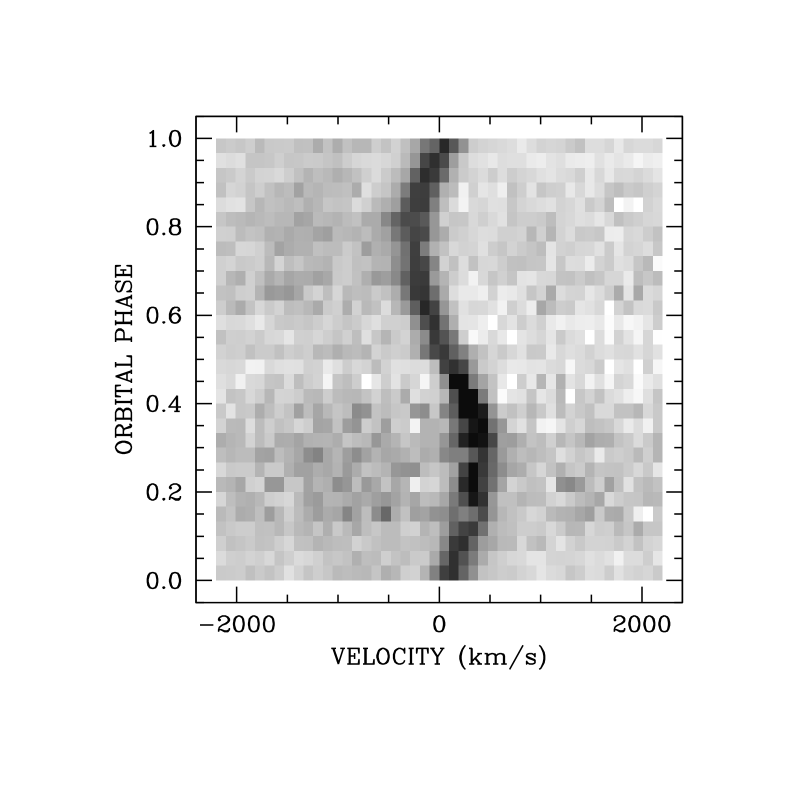
Our final reduced spectra were phase-averaged and arranged as an apparent trailed spectrogram using our improved orbital period and the phase of inferior conjunction of the secondary as determined below. A cutout of the spectra centered on the H emission lines and the NaI absorption lines is shown in Fig. 2. Wavelength was transformed to radial velocity in the diagrams. The lines from both species are clearly detected through the complete orbital cycle.
The NaI-doublet is clearly resolved in the TWIN spectra. Radial velocity measurements were performed by fitting double Gaussians with fixed wavelength separation to the observed line profiles. Those attempts were not always successful due to the low signal to noise ratio in several of the spectra. For the determination of the radial velocity curve we neglected spectra below a certain S/N level and were thus left with a total of 65 spectra.
Despite the lack of sufficient resolution the H lines of WX LMi seem to consist of just one line. Contrary to polars in their high accretion states, which show even at our spectral resolution more complex line profiles. H line positions in the individual spectra were thus determined by fitting single Gaussians. The H lines were detected also in all MOSCA spectra and line positions were determined by fitting Gaussians in 26 spectra.
The radial velocity curves of NaI and of H at both occasions could be successfully fitted with sine curves. A summary of the radial velocity measurments is given in Table 3. The epoch of the blue-to-red zero crossing of the NaI-lines at BJD = 2451247.50425(27) determines inferior conjunction of the secondary and spectroscopic phase zero throughout this paper. The number in parentheses gives the uncertainty in the last digits of the ephemeris zero point.
| Line | Date | (km/s) | |
|---|---|---|---|
| NaI (TWIN) | March 9–11 | ! | |
| H (TWIN) | March 9–11 | ||
| H (MOSCA) | March 18/19 |
We could not discover any significant variation of the width of the NaI-lines. There is a tendency of a 20% increase of the NaI-line flux at phase 0.5 with respect to phase 0.0. However, the flux measurements of the NaI-lines are rather uncertain due to a too low signal-to-noise ratio of the individual spectra and we didn’t analyse this line property in more detail.
The tight phase relation between the H and the NaI lines suggests a common origin on the secondary star. This is supported by the absence of any further emission line component in H which could be attributed to an accretion stream or disk. The H emission line is assigned completely to the photospheric activity of the secondary star.
We regard the radial velocity amplitude of the NaI lines as proper measurements of the projected orbital velocity of the secondary. Irradiation effects, which distort the radial velocity curves in high-accretion rate polars, play an insignificant role in WX LMi. The observed velocity amplitudes of H in the TWIN and MOSCA spectra are inconsistent with each other and with NaI. Hence, the centers of activity on the secondary were located away from the center of mass and were time variable on a scale of a few days.
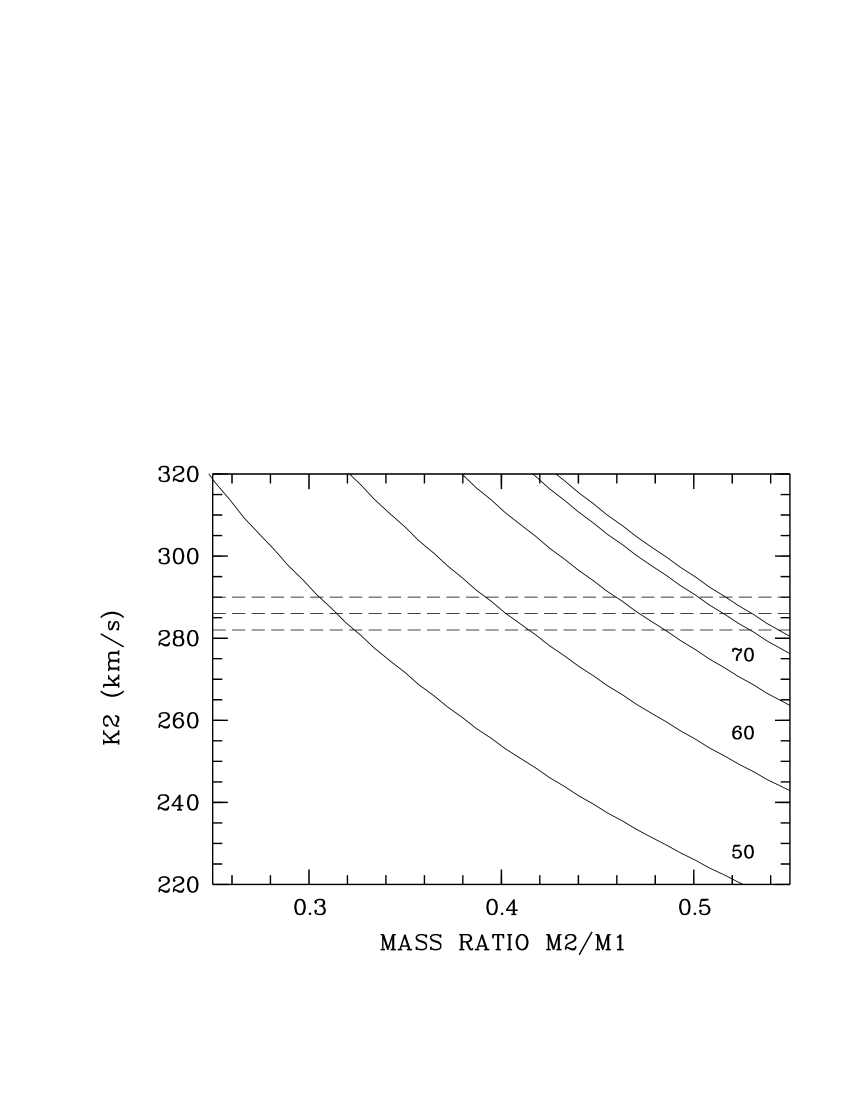
The observed radial velocity amplitude gives some constraints on the mass ratio and the mass of the white dwarf (see Fig. 3). The absence of an eclipse constrains the orbital inclination to assuming a Roche-lobe filling secondary. For a Roche-lobe underfilling star the inclination could be even higher. With the ZAMS assumption for the secondary and the corresponding masses as listed in Tab. 2 the minimum mass of the white dwarf is .
3.1.4 Emission line fluxes as activity indicators
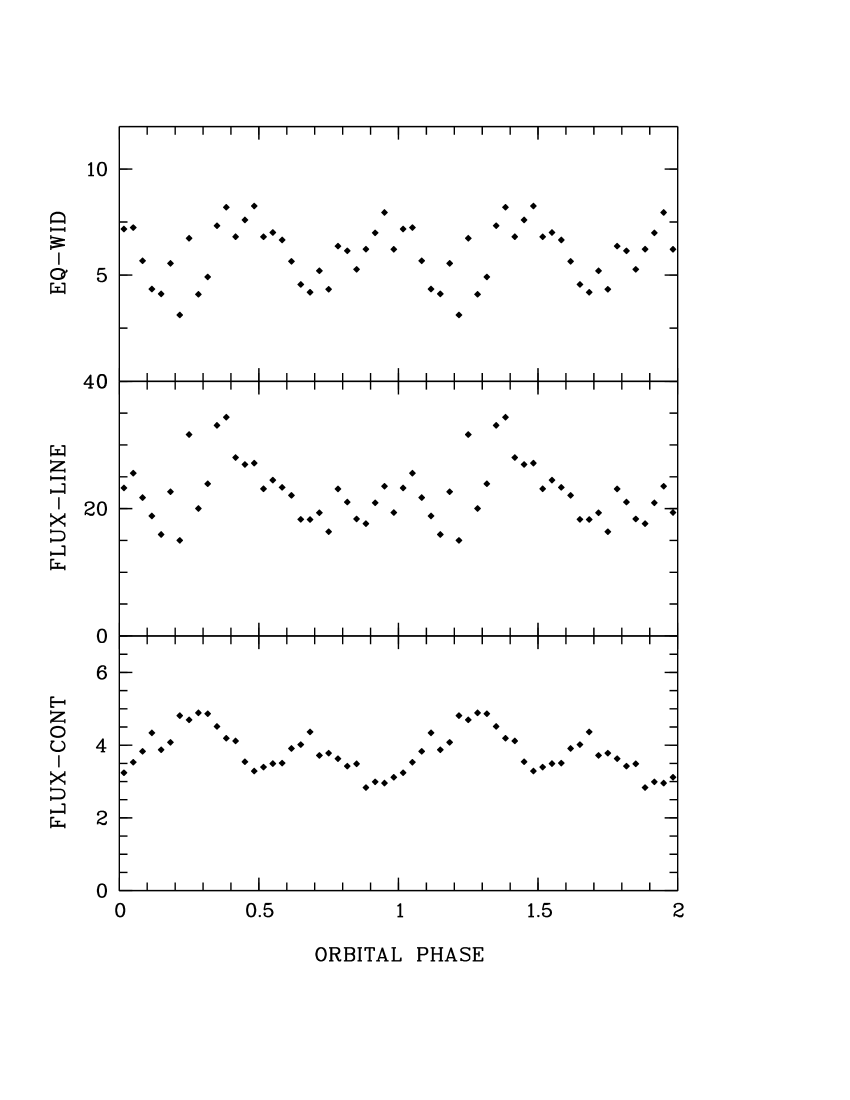
The H and Ca H&K emission lines are regarded as originating from the active photosphere and chromosphere of the secondary. We arranged our observed spectra like a trailed spectrogram by phase-averaging the orginal spectra into 30 phase bins. We then shifted the spectra to radial velocity zero and subtracted the scaled spectrum of the single, non-active M4.5 star Gl 268. The remaining flux in the spectral region around H consisted of the smoothly varying continuum from the white dwarf and the line flux without Doppler shift and thus allowed a straightforward measurement of the line flux. The H emission line flux was related to the continuum of the scaled Gliese star at this wavelength in order to determine the equivalent width of the line. The results of this procedure are displayed in Fig. 4.
The continuum emission light curve shows a double-humped structure with minima at phase 0 and 0.5, respectively, very reminiscent of ellipsoidal light variation. The -band light curve of the scaled template spectrum shows modulations of mag. Using nightfall111http://www.hs.uni-hamburg.de/DE/Ins/Per/Wichmann/ Nightfall.html we made some attempts to model this pattern. At a temperature of 3300 K for Sp M4 one needs a Roche-lobe filling secondary and a large inclination angle of order 70° in order to get such a big amplitude. However, the photometric accuracy achieved by us does not allow to draw firm conclusions on the filling factor of the secondary, on the temperature or the inclination. E.g. the maxima of the continuum light curve are differing by 0.15 mag, probably a leftover from our calibration uncertainties.
The line flux itself does not show a clear phase-dependent variability pattern, whereas the eqivalent width again shows a pronounced doubled-humped structure with maxima at phase 0 and 0.5, respectively. The variied between 4 and 8 Å. The subtraction of the template M-star spectrum had some uncertainty, using a possible different scaling raised up to 10 Å. These numbers were clearly smaller during the MOSCA observations with a variation through the binary orbit between 1 and 4 Å.
Walkowicz et al. (2004) investigated the strength of activity via H measurements for a large number of SDSS stars. They parametrise the strength with a factor, . For spectral types M4 – M4.5 the factor is and becomes for the TWIN observations.
Recently, West et al. (2004) and Silvestri et al. (2005) studied large number of either single (West et al., 2004) or common proper motion WD/MS binaries (CPMBs, Silvestri et al. (2005)) drawn from the SDSS. The large majority of 90% of the Silvestri et al. (2005) CPMBs have an close to 0 (their Fig. 2). The mean H luminosity of the West et al. sample at spectral type M4–M5 is (their Fig. 4 and Tab. 1). These figures clearly put the secondary in WX LMi among the more active stars in its category. The comparison between our MOSCA and TWIN observations showed the H activity remarkably variable on a timescale of a month or shorter.
The Ca ii H&K lines appear as distinct features only in the radial-velocity corrected average spectrum of WX LMi (Fig. 1). They can only hardly be recognised in the original spectra where they are immersed in the noise. A continuum under the emission lines was determined interactively on a graphics screen and the excess flux regarded as Ca ii H&K emission line flux (with a negligible contamination from hydrogen H). This gave an integrated flux of erg cm-2 s-1 and a luminosity of for an assumed distance of 100 pc. Piters et al. (1997) have studied the relation between coronal and chromospheric emission from cool stars in near-simultaneous ROSAT all-sky survey and Mount Wilson data and found a good correlation between these two activity indicators. Would the secondary follow this relation (their Fig. 4), we would expect an X-ray luminosity of , far higher than observed (see below).
Vice versa, the observed X-ray lumonisity of WX LMi implies a Ca ii luminosity 4 orders of magnitude less than observed, would the star follow the Piters et al. relation. These estimates and comparisons suggest, that either the relation between coronal and chromospheric luminosities does not apply to the case of the fastly rotating M star in WX LMi or a very high variability of the activity parameters of WX LMi or a combination of both. The implied X-ray luminosity based on the observed Ca ii luminosity would be higher than the typical accretion-induced luminosity in a high accretion polar. Probably we have encountered WX LMi in a state of unusual high chromospheric activity during the MOSCA observations.
3.2 Optical cyclotron radiation
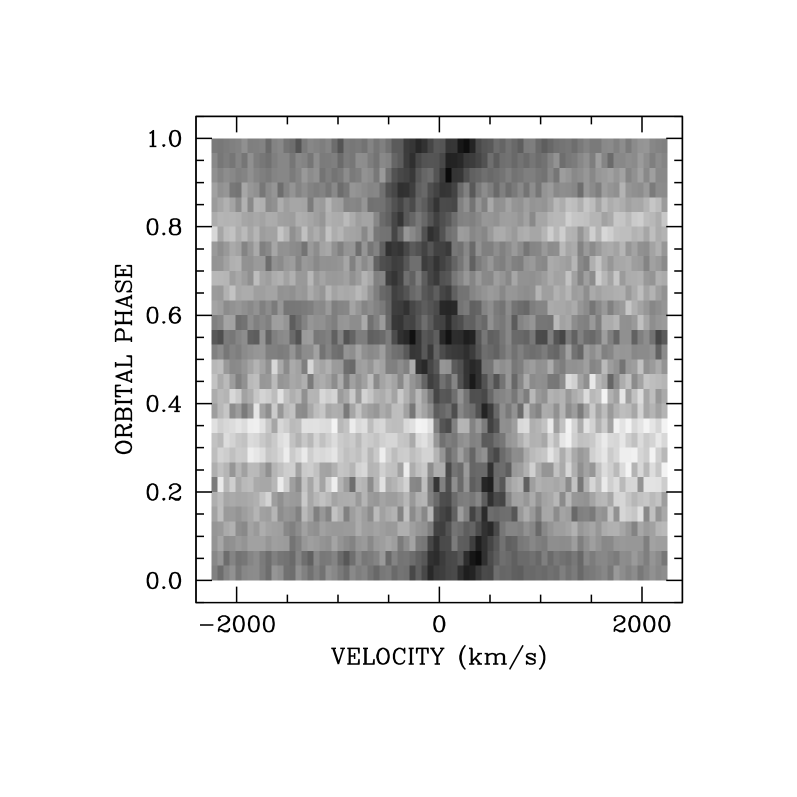
The cyclotron spectra from the two accretion regions on the white dwarf in WX LMi were extracted from the original data in a similar manner as described by Reimers et al. (1999). We firstly corrected the spectra to radial velocity zero, arranged the spectra as a trailed spectrogram by phase-averaging the spectra into 30 phase bins of same length (this left 4 bins unpopulated in the MOSCA data), and subtracted suitably scaled spectra of our template Gl 268 (M4.5). This gave us spectra containing mainly photospheric radiation from the white dwarf and cyclotron radiation from the accretion spots (see Fig. 10 for a graph of the spectral decomposition). In the following we are using the terms ‘accretion region’ and ‘pole’ synonymously, just for brevity since we know about the differences.
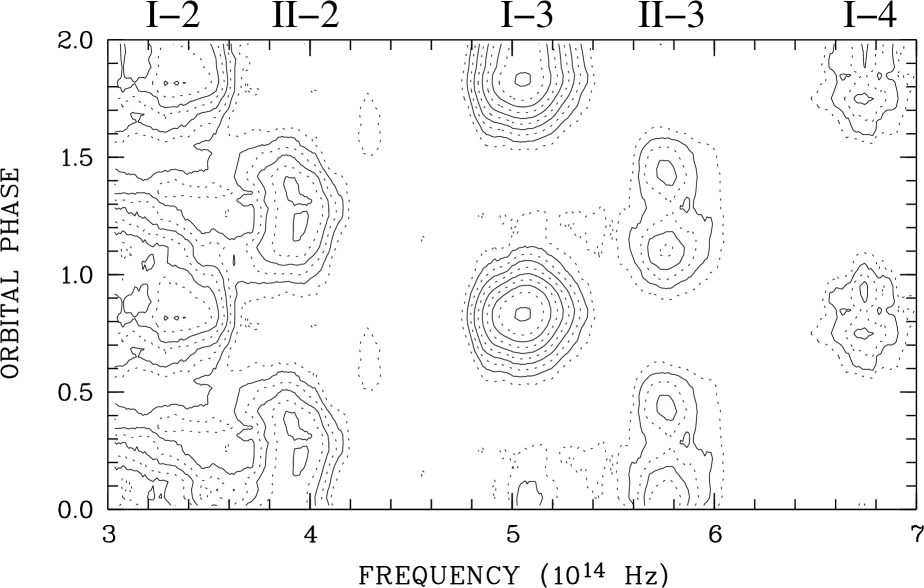
Assuming a flat light curve from the rotating white dwarf, a mean white dwarf spectrum was composed from spectral regions free of cyclotron radiation and subtracted from all phase-binned spectra. Those difference spectra are regarded as of pure cyclotron origin. They were arranged as a trailed spectrogram and are shown on a logarithmic intensity scale in Fig. 5. Actually, the described procedure was performed for the red and blue TWIN spectra and the MOSCA separately and the trailed spectrogram shown in Fig. 5 is a composite of those. The MOSCA data are used for the blue end of the spectra, Hz, since their signal-to-noise ratio was superior to the TWIN spectra in that wavelength region. The feature at Hz () is a leftover from the M star subtraction.
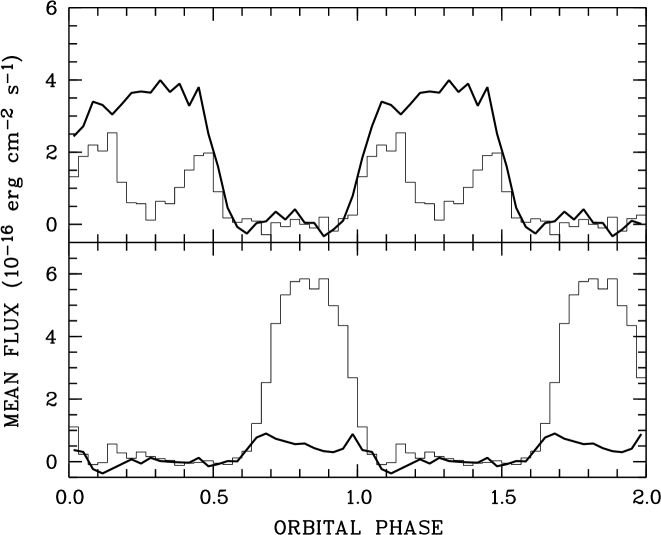
Fig. 5 may be compared with the corresponding Fig. 3 of Reimers et al. (1999). As a novel feature we discover the cyclotron harmonic from the primary pole at Hz in the MOSCA data. All other cyclotron harmonics appear very similar in strength, shape and position to those shown by Reimers et al. (1999). Light curves for individual harmonics were computed by averaging the trailed spectrogram over certain wavelength ranges. The light curves for the and harmonics from the brighter primary and the and harmonics from the fainter secondary pole are shown in Fig. 6. Since the continuum subtraction for the lowest frequencies was not completely satisfying, the light curve for the harmonic of the primary pole is ignored for the detailed analysis. The light curves from both poles are double-humped for the higher harmonics, an effect of cyclotron beaming in an optically thin plasma. The light curves of the lower harmonics are single-humped with maximum brightness centered between the two beamed humps from the higher harmonics, indicating considerable optical depth in those harmonics. From the centers of the bright phases, and , the azimuth of both accretion spots were determined to and .
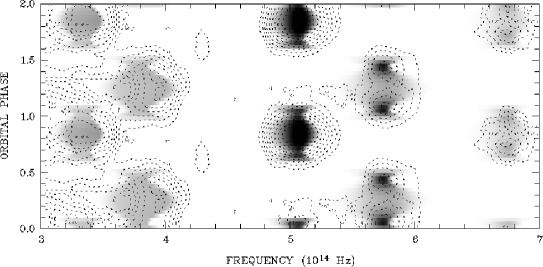
We modeled the phase-dependent spectra assuming homogeneous, isothermal conditions in the plasma (Chanmugam & Dulk, 1981). A number of parameters determine the model spectra: the field strength , the temperature , the plasma density coded with the density parameter , the orbital inclination , the co-latitude of the field in the accretion spot , and the azimuth of the field in the spot. The visibility of an emission region as a function of phase is further determined by the latitude and azimuth of the accretion spot and the vertical extent of the emission region. For simplicity, we assumed the field in the spot being normal to the surface of the star, i.e. we set and . We further neglected any vertical extent but allowed the point-like emission region raised to some height above the star’s surface. The orbital inclination was fixed at 70°. The difference in azimuth between the two regions was determined from the bright phase centers to .
With these simplifications, we cannot expect to reach a perfect fit, particularly not to the light curves of individual harmonics which are shaped by the geometry of the accretion region, the viewing geometry, optical depth and cyclotron beaming. However, the main features of both cyclotron line systems as a function of phase could be reproduced (see Fig. 7) by our model with the following set of parameters: MG, , keV, Rwd, with typical uncertainties of MG, , keV, Rwd, and . Some of the parameters are coupled to others, e.g. if one raises the temperature one has to lower the density parameter in order to match the observed turnover from optically thick to thin radiation. The values given here are slightly different from those given in Schwope et al. (2002) based on an analysis of the Reimers et al. data. The differences reflect mainly the modeling uncertainties and not a difference in the data. These were found to be consistent with each other. The new data provide as addiditonal constraint the beamed fourth harmonic from the second pole.
In our modeling, the co-latitude was chosen according to the observed phase separation, of the two beamed humps in either the (prime pole) or the harmonic (secondary pole). The value of is related to the orbital inclination and the length of the self-eclipse of an accretion spot, , via . With the values of and fixed we had to assume a certain height of the region in order to reflect the length of the bright phase which lasts longer than the phase separation of the beams. The more extended visibility of the individual spots was used by Schwarz et al. (2001) for their estimate of the accretion geometry. They determined the colatitude of both spots as from light curve modeling for a point source on the surface on the WD. Using the beaming proporties of the harmonic from the second pole the range of possible values for the colatitude of the second pole was extended up to , which is in agreement with our results. Since we are using solely the beaming properties of the cyclotron radiation for both spots our results seem to give more reliable constraints than the assumption of simple geometrical foreshortening.
These results are unusual as far as the spot locations and the plasma temperatures and densities are concerned. The two spots are both located in the ‘southern’ hemisphere of the white dwarf, a result already mentioned by Schwarz et al. (2001). The opening angle between the two spots is of order , i.e. the two spots could be located at the two footpoints of the same dipolar fieldline. If so, the southern latitude of both spots hints to an off-centered field configuration. The slight difference between the field strengths in the two spots seems to underline this, although the strong radial dependence of the field strength does not allow to draw firm conclusions about the field at the proper footpoints at zero height. One pole lies in the same sector where most poles in high-accretion rate polars are found (see Cropper (1988) Fig. 2), i.e. the sector leading the secondary in phase. The other pole is away by from the line connecting both stars and away from the direction of a hypothetical accretion stream.
The temperatures cannot be determined with very high accuracy. They are constrained by the width of the observed highest harmonic. At temperatures higher than about 3 keV the predicted line width becomes larger than observed even for point-like emission regions. Since in nature there will be a spread in and , we regard 3 keV as strict upper limit. Thus the temperatures found by us are among the lowest found in cyclotron spectra of polars (if WX LMi may be termed as such). They are more than an order of magnitude below the shock jump temperature for an assumed 0.6 M⊙ white dwarf. The low temperatures together with the low density parameters imply that both cyclotron emission regions are dominated by cyclotron cooling. It seems unlikely, that an accretion shock exists in WX LMi, the accretion spots are more likely heated by particle bombardment. The bombardment models by Fischer & Beuermann (2001) relate the accretion rate per unit area, , to the field strength and the maximum electron temperature. According to their Fig. 5, one needs for an 0.6 M⊙white dwarf with and MG a specific mass accretion g cm-2 s-1in order to be deeply in the bombardement regime.
The mean integrated cyclotron flux calculated from the observable parts of the cyclotron spectra are erg cm-2 s-1 and erg cm-2 s-1, respectively. The correcting factors for the unobserved parts of the cyclotron spectrum and for the beaming pattern are rather uncertain, we assume . We further assume, that the cyclotron luminosity can be calculcated as and get for the sum of both poles ergs-1. The implied mass accretion rate of M⊙ yr-1 is extremely low and is of the same order as the wind mass loss rate of the secondary star.
Given the total and the specific mass accretion rates, one may ask for the minimum area over which accretion may happen in order to be in the bombardement regime. Equating and using g cm-2 s-1, M⊙ yr-1, and cm we obtain for two equally sized circular accretion spots a radius of just 40 km or .

3.3 XMM-Newton X-ray and ultraviolet observations
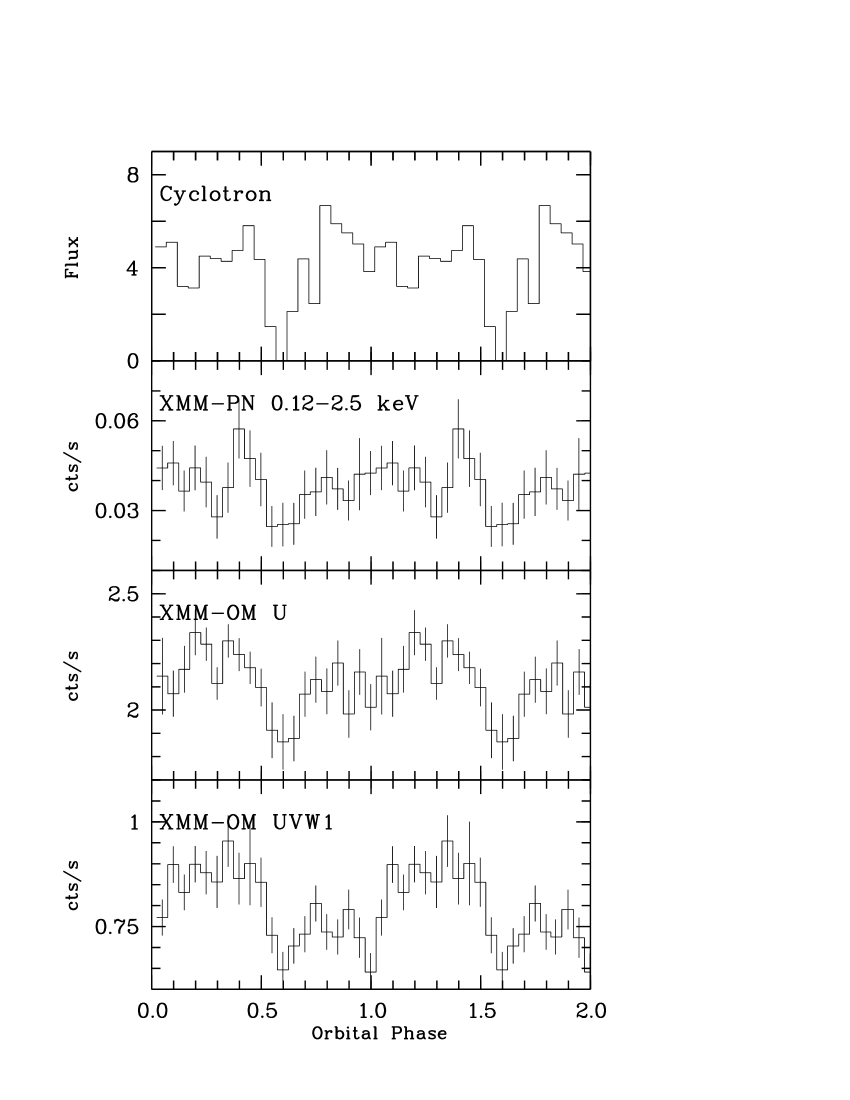
The main results of the observations with XMM-Newton are summarized in Figs. 8 and 11. Fig. 8 shows the PN X-ray light curve as well as the light curves for both OM filters. Along with the new satellite data the summarized flux of the and harmonics from the primary accretion spot and the and harmonics from the secondary accretion spot is shown. The data are binned into 20 phase bins. Around phase 0.6 when both accretion spots are self-eclipsed, the cyclotron flux drops to zero. The OM and PN light curves exhibit a clear variability correlated with the cyclotron flux, and thus the visibility of the accretion spots on the white dwarf, which is analysed in more detail in the following section.
3.3.1 UV - the white dwarf atmosphere
The UV-observations with the OM were designed to estimate the temperature of the white dwarf and of the heated photosphere below the accretion spots. The basic assumption is that the UV light is completely dominated by photospheric radiation from the white dwarf’s surface. Any variability is thus assigned to temperature inhomogeneities of the atmosphere. We spent each half the available observation time for the U (3440 Å) and UVW1 (2910 Å) filters. We detected a clear, phase-dependent variability of the OM count rate in both filters correlated with the visibility of the accretion spots (see Fig. 8). The ratio of the count rates between the two filters, however, was constant within the errors indicating only marginal T-variations.
White dwarf model spectra for pure H, , non-magnetic atmospheres in the temperature range 8000 K – 100000 K (Gänsicke et al., 1995) were folded through the response curves of the OM with the different filters thus predicting a count rate in the given filter. The count rate ratio between the two filters as a function of temperature is shown in Fig. 9. The ratio is a sensitive function of below 30000 K. In order to test the reliability of our ‘bolometer’ we retrieved calibration observations of the well-studied white dwarfs BPM 16274 and GD 153 from the XMM-Newton Science Archive. Their count rate ratios are also shown in the Figure.
The resulting count rate ratio predicts a temperature of K for GD 153 in agreement with values found in references listed in the white dwarf data base222http://procyon.lpl.arizona.edu/WD/, K. The derived temperature of K for BPM 16274 is somewhat lower than the values of K found in the literature. We thus estimate the accuracy of the filter ratio method of order 10%.
The observed count rate ratio around phase , when both spots are hidden from the observer, is . This high ratio cannot be reproduced by our model atmospheres. The observed ratio indicates a softer spectrum, i.e. cooler atmosphere than the lower limit of 8000 K of our models. Synthetic magnetic white dwarf model spectra with dipolar field structure for a pole field strength of 60 MG – kindly provided by S. Jordan – reduced this discrepancy, but also led to no satisfying result. It need to be said, however, that the model spectrum of a magnetised atmosphere used the temperature structure of a non-magnetic atmosphere, hence we cannot quantify to what extent the magnetic model matches the observations better than the non-magnetic.
It is worth noting at this stage, that we could not identify any depression (a line or a trough) in the optical continuum of the observed white dwarf spectrum, which could be even only tentatively identified as a Zeeman signal. We guess, that the low and/or a complex field structure are responsible for this observation.
We conclude that of the white dwarf is almost certainly below 8000 K. Even without using the count rate ratio as an indicator for the temperature the measured count rate in the UVW1 filter around phase gives an upper limit for the flux and thus the temperature of the white dwarf. Therefore one has to assume that the whole white dwarf is seen, without contribution from the heated pole caps. If we fix the distance at 100 pc as derived in section 3.1.2 and use a mean polar white dwarf mass of 0.6 (Wickramasinghe & Ferrario, 2000), the lower limit of 8000 K of our nonmagnetic model atmospheres gives a flux which is about 12% higher than the measured flux in the UVW1 filter. We use the mass-radius-relation from Nauenberg (1972), which is sufficient for very cool white dwarfs (Panei et al., 2000). Any additional contribution from the accretion spots decreases the flux contributed by the white dwarf and thus its temperature. A significantly higher temperature would only be possible for a very massive white dwarf or if it were much further away than the derived distance of 100 pc.
The different spectral components in the optical and near ultraviolet are illustrated in Fig. 10 which shows the mean optical spectrum, the scaled spectrum of the M4.5 template (Gl268), the blue TWIN spectrum after subtraction of the M dwarf (white dwarf plus cyclotron radiation), the two UV measurements and suitably scaled magnetic and non-magnetic white dwarf model spectra for K.
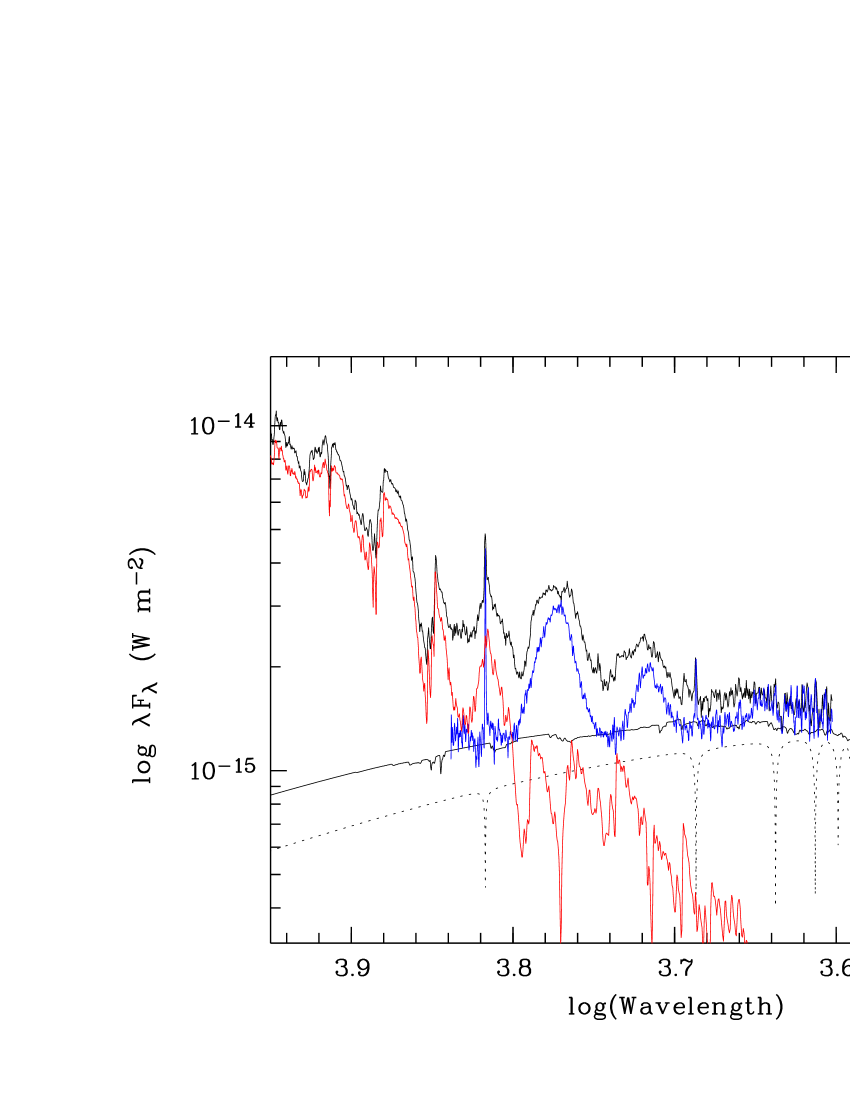
Reimers et al. (1999) determined the temperature of the white dwarf in WX LMi to be K. Our new determination differs significantly. Reimers et al. substracted a dM4.5e (G3-33) spectrum from a mean spectrum when both spots are self-eclipsed. The spectral energy distribution of the remaining spectrum was then compared with synthetic spectra for white dwarfs with a magnetic field of 60 MG. The temperature dependence of the continuum slope in the wavelength range between 4000 to 6000 Å used by them is not very pronounced. Due to the much smaller contribution of the secondary to the total flux in the UV, the use of the OM data seems more reliable to us for a determination of the white dwarf’s temperature and we thus reject their temperature estimate. A white dwarf with a temperature of K would have been clearly detected in the OM, even at a distance of 140 pc.
The unusual cool temperature of the white dwarf fits well in the current knowledge of all LARPs. Table 5 summarizes the white dwarf temperatures as determined so far. Apart from SDSS0837 all white dwarfs are cooler than 11000 K, which otherwise seems to be a lower limit for the white dwarfs in normal CVs (Gänsicke, 2000). Without any prior accretion the temperature of the white dwarf in WX LMi implies a cooling age in the order of 109 years (Chabrier et al., 2000) as a lower limit. Schreiber & Gänsicke (2003) deduced a typical duration of the post common envelope phase of about 2 Gyr. Thus, CVs on the initiation of accretion due to Roche-lobe overflow should contain very cool white dwarfs. The low temperature also restricts the accretion rate in the past to have been less than 10-11 M⊙ yr-1, at least for periods shorter than the thermal timescale of the heated envelope (Townsley & Bildsten, 2003). Both limits support the assumption that WX LMi and the LARPs in general are pre-CVs before the onset of Roche-lobe overflow.
The UV light curves in Fig. 8 show a clear variability correlated with the visibility of the accretion spots, a clear indication for heated pole caps. Surprisingly the secondary spot seems to be hotter than the primary pole, which is inconsistent with the picture obtained from the optical spectra and the X-ray light curve. The reason for this is rather unclear. We can exclude a cyclotron contamination because the OM U-filter is centered between harmonics 4 and 5 of the second pole.
The hardness ratio for the OM filters shows no significant variability which is somewhat confusing since our interpretation of photometric variability of the UV requires also a hardness ratio variability. However, we cannot completely exclude that those expected count rate ratio variations are below our sensitivity threshold and cannot test this due to the lack of suitable model atmospheres.

.
| Model | NHPa | kT (MEKAL) | kT (BB) | n | Fluxc | |
|---|---|---|---|---|---|---|
| [keV] | [eV] | [cm-2] | [ergs cm-2 s-1] | |||
| wabs (MEKAL) | 3.44 | 1.3e-15 | 0.620.02 | 5.6e-6 | 4.2E-14 | |
| wabs (BB+MEKAL) | 1.42 | 2.6e-2 | 0.660.02 | 117 11 | 1.0d | 4.6E-14 |
| wabs (MEKAL+MEKAL) | 0.98 | 0.51 | 0.260.02 | 1.2e-12 | 5.4E-14 | |
| 0.820.05 |
a null hypothesis probability, b in units of 1e20, c integrated flux 0.1-5 keV, d frozen
3.4 The X-ray light curves and spectra
The EPIC-PN light curve shows orbital phase-dependent modulation with a pronounced minimum at the time, when both accretion spots are hidden from the observers view. While the cyclotron flux drops to zero around , the X-ray flux remains at the constant minimum flux. We ascribe the residual flux around that phase to the corona of the secondary star.
The average count rate of WX LMi is too small to make a phase-dependent spectral analysis feasible. Fig. 11 shows the orbital mean spectra obtained with EPIC-PN and EPIC-MOS. Essentially all the X-ray flux emerges below 2 keV. We fitted the combined PN and MOS spectra with XSPEC. Our results are summarized in Table 4. A first approach with a single MEKAL model for a coronal and/or accretion plasma, molding emission from the secondary and from the accretion region with one temperature led to no satisfying fit. Motivated by the presence of a soft blackbody-like and a hard thermal component in high accretion rate polars, our next attempt included a black-body component. The fit was improved, but the temperature of eV for the black body is higher than in any other polar observed so far and thus seems implausible. A satisfactory fit was achieved using a two component MEKAL model. The temperatures of keV and keV are well within the regime that one could expect for a coronal plasma. The temperature thus determined would be very low for the accretion plasma of a normal-accreting polar. It is however in the same range as the temperatures derived from the analysis of the cyclotron emitting plasma.
To make a possible distinction between the two components (accretion plasma and corona) we extracted spectra according to the time intervals when only one of the two spots is directed towards the observer. The spectral fits of those two separated spectra yielded no significant differences between each other and compared to the overall mean spectrum. Also, we could not detect any significant variation in the X-ray hardness ratio as a function of orbital phase. Hence, we cannot discern between the coronal and the accretion plasma on the basis of possible spectral differences with the given number of photons.
Figure 12 shows the spectral energy distribution from the near infrared to the X-ray regime for the individual spectral components. The graph shows , i.e. the values plotted are representing the contributions to the total energy output from the system. Red squares indicate the contribution of the secondary, which dominates the system absolutely. Black rhombs indicate the OM data and, together with the dashed line, indicate the contribution from the white dwarf, which can purely be observed in the ultraviolet. The spectrum shown in blue is the summed cyclotron spectrum from both poles. Arrows indicate the position of the cyclotron fundamental which are located in the -band and between the and bands, respectively, i.e. the -band is likely uncontaminated by cyclotron radiation. The X-ray spectrum, shown as black solid line, is a mix of thermal plasma radiation from the accretion poles and the coronal plasma. Accretion-induced radiation is clearly dominated by the cyclotron component.
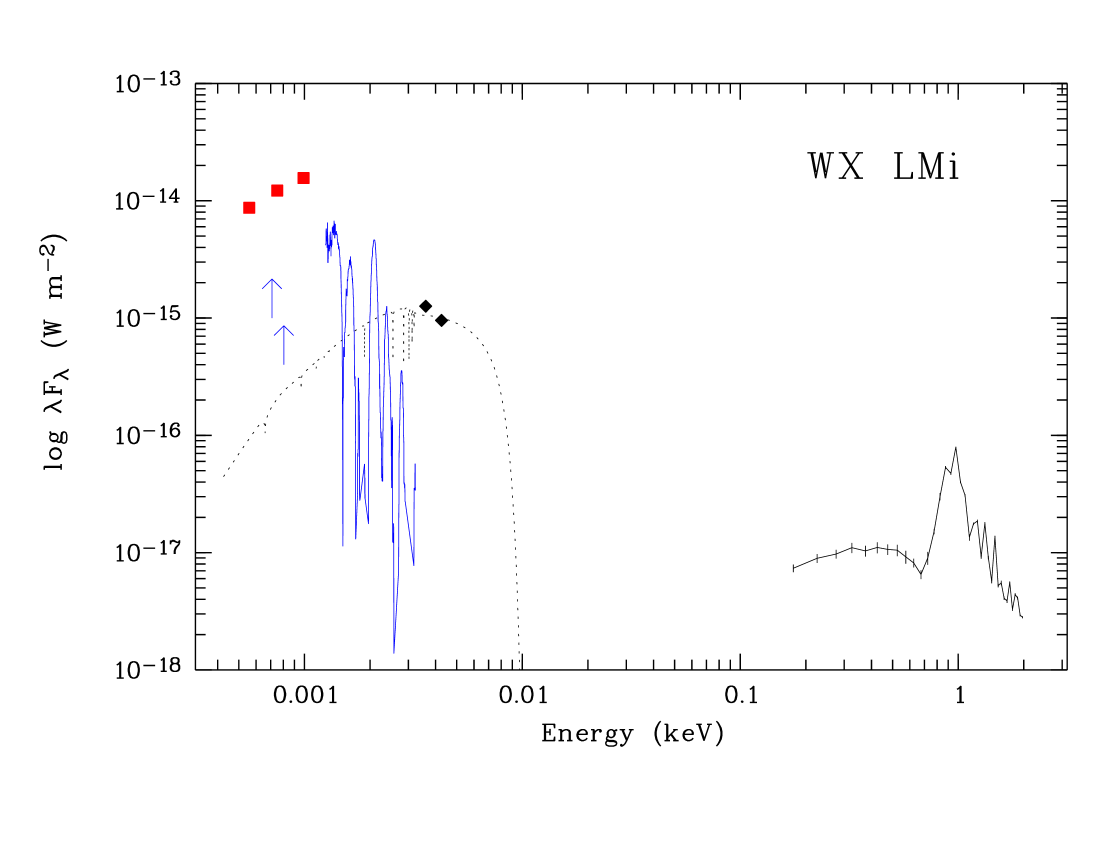
The unabsorbed flux (0.1 - 5 keV) for the two component MEKAL fit is erg cm-2 s-1. For a distance of 100 pc this yields an X-ray luminosity of erg s-1. Based on the variability of the X-ray light curves we assume that the secondary and the accretion regions contribute roughly equal X-ray flux and luminosity to the observed X-ray spectrum, i.e. we get erg s-1.
3.4.1 The secondary in X rays
Our estimate of the X-ray luminosity of the secondary star makes a comparison
with the X-ray activity of normal late-type dwarfs possible. The latter is
correlated with the stellar rotation (Pallavicini et al., 1981; Pizzolato et al., 2003).
According to Leggett et al. (1996) the bolometric luminosity of our
assumed M4.5 secondary is = 3.9 1031 erg
s-1. The X-ray flux attributed to the secondary,
erg s-1, results in
/.
This result is only weakly dependent on the assumed spectral type, i.e. for
an M3 secondary we get .
Pizzolato et al. (2003) studied the relation between
coronal X-ray emission and the rotation period. They confirmed the existence
of two regimes, one in which the rotation period is related to the X-ray
emission and one in which a constant saturated X-ray to bolometric luminosity
is attained (their diagrams 5 and 6). This claim for the latest spectral types
rests on rather small number of stars. The X-ray luminosity determined for the
secondary of WX LMi falls well on the constant branch of their diagrams,
suggesting saturation of the activity.
| Object | Period | Spectral type | Comparisonb | Distance | Referencec | ||||
|---|---|---|---|---|---|---|---|---|---|
| [pc] | [erg/s] | [103 K] | |||||||
| WX LMi | 2.78 | M4.5 | Gl268 | 100 | 3.86e31 | 3.2e28a | 0.8 | 8 | 4 |
| HS0922 | 4.07 | M3.5 | Gl494 | 190 | 1.97e32 | 7.5e29 | 3.8 | 10 | 1,3 |
| SDSS0837 | 3.18 | M5 | LHS377 | 330 | 3.43e30 | - | - | 14 | 3 |
| SDSS1324 | 2.6 | M6 | GJ1111 | 450 | 3.18e30 | 1.4e29 | 46 | 6 | 1,2,3 |
| SDSS1553 | 4.39 | M5 | LHS377 | 130 | 3.43e30 | 1.4e29 | 41 | 5.5 | 1,2,3 |
| SDSS2048 | 4.2 | M3 | Gl388 | 260 | 8.93e31 | 7.9e29 | 0.9 | 7.5 | 3 |
The same comparison can be made for the other low accretion rate polars as well. Table 5 compiles the parameters from the literature. Among the other systems only SDSS1553 has a clear X-ray detection and the source was found clearly above the Pizzolato et al. relation. However, the luminosity variations for the late spectral types in the compilation of Leggett et al. (1996) are large. Taking into account the uncertainty for the spectral type of the secondary, SDSS1553 could satisfy the Pizzolato et al. relation as well. Otherwise this could indicate additional X-ray emission from the accretion plasma, although the PN light curve shows no variability, contrary to the optical light curve (Szkody et al., 2004). For SDSS1324 only an upper limit was obtained from XMM observation (Szkody et al., 2004) and for HS0922 there is an upper limit from a ROSAT PSPC observation (Reimers & Hagen, 2000). SDSS2048 could be identified with a RASS source, but there are other optical objects within the error circle (Schmidt et al., 2005), which makes the identification as an X-ray source ambiguous. If we take the upper limit as face value, it falls on the relation by Pizzolato. Hence, one (WX LMi) of the two objects with a proper X-ray detection seems to behave like a normal main-sequence star as far as X-ray activity is concerned and lends support to the picture of saturated activity, the other leads to no definite conclusion, concerning the uncertainty in Lbol.
4 Main results and discussion
We have presented a photometric and spectroscopic analysis at optical, ultraviolet and X-ray wavelengths of WX LMi, a system termed in the past as a low-accretion rate polar (LARP). This designation was chosen due to its similarity to the polars, normal accreting magnetic CVs, as far as its stellar constituents and the magnetic field strength are concerned.
Our main results can be summarized as such: WX LMi harbours a highly active secondary star of spectral type dM4.5 . The acitvity is obvious from photospheric H and chromospheric Ca ii lines, which vary in phase with the orbital motion of the secondary, although not centered on the stellar disk. Activity is detected also at X-ray wavelengths at a level comparable to other late-type stars at saturation.
The phasing of the H-lines sheds some new light on old observations of polars in their low states. Faint residual Hemission moving in phase with the secondary (traced with the Nalines) was observed e.g. in UZ For (Schwope et al., 1997) or MR Ser (Schwope et al., 1993), although typically at a different velocity than the Nalines. While H-emission was typically interpreted in terms of irradiation, it may be that those low state polars revealed their active secondaries. Low-state spectrophotometry of polars thus might further constrain the activity-rotation relation in a rather unexplored regime. This active secondary could be an explanation for the missing magnetic white dwarf + main-sequence binaries in current catalogs (Liebert et al., 2005). If the magnetic white dwarf captures the wind from the active secondary, the emission of cyclotron radiation in the optical clearly vitiates the color selection criteria and/or the spectral composition. It requires a strongly magnetic white dwarf ( 50 MG) to efficiently capture the wind, but the LARPs could mitigate the lack of those binaries at least for the case of highly magnetic white dwarfs.
At the given orbital period, h, one would according to Beuermann (2000) expect a secondary of spectral type M3 rather than M4.5. In this respect the secondary seems to behave as those in normal accreting polars which also are observed typically ’too cool to comfort’ (Friend et al., 1990). However, the standard explanation assuming the secondaries being driven out of thermal equilibrium does not seem to work here, since the low temperature of the white dwarf, K, implies the absence of or a very low accretion rate in the past. If WX LMi and its relatives would be just in an occasional low state of accretion the expected temperature should be above 11000 K (Gänsicke, 2000), as for the white dwarfs in normal CVs. The observed accretion rate is too small for a long-term equilibrium mass transfer (Webbink & Wickramasinghe, 2005). Also, the location of the second pole in WX LMi makes accretion via Roche-lobe overflow rather unlikely.
As suggested already by Schwarz et al. (2001) for WX LMi and Schmidt et al. (2005) for similar systems found in the SDSS the secondary is likely somewhat underfilling. Thus our analysis of WX LMi fully supports the view of LARPs as pre-Polars, post-common-envelope systems prior to Roche lobe contact, like already concluded by Webbink & Wickramasinghe (2005) and Schmidt et al. (2005). We nevertheless detected ellipsoidal light modulations which in principle could be used to constrain the inclination and the filling factor, provided spectrophotometric data with higher accuracy could be obtained.
We re-determine the distance to be pc. The accretion luminosity, which is dominated by optical cyclotron radiation with a minor contribution from X-ray thermal plasma emission, implies a low mass transfer rate of M⊙ yr-1. Such low mass transfer rates are likely compatible with the wind mass loss rate from the active secondary. Schmidt et al. (2005), adopting a scenario by Li et al. (1995), proposed a ‘magnetic siphon’ channeling all material in the wind down to the pole caps with very little wind loss. The actual accretion geometry, determined by us from the orbital phases of the cyclotron features, doesn’t seem to play an important role, once the magnetic field is sufficiently strong.
Schwarz et al. (2001), modeling optical light curves and taking the beaming properties for the second spot into account, located the spots near the equator. We refine this model by a phase-dependent study of the cyclotron beaming for both spots. Primary and secondary accretion spot are located on the ‘southern’ hemisphere, i.e. away from the observer’s hemisphere, indicating a field structure different from a centered dipole. The field strengths in the two spots are 61.4 MG and 69.6 MG, respectively.
At such high field strength and low accretion rates as predominating in LARPs probably no accretion shock forms. As shown by our deconvolution of the spectral energy distribution for the infared to the X-ray regime, the plasma cools mainly via cyclotron radiation instead of bremsstrahlung as in high-accretion rate polars lending full support to the bombardement solution by Fischer & Beuermann (2001).
WX LMi as the brightest of the new class of pre-polars is a suitable target for spectropolarimetric observations at a 10m class telescope in order to search for polarized signal from the white dwarf’s photosphere and to perform detailed modeling of the accretion plasma on its poles.
Acknowledgements.
We thank S. Jordan for providing a grid of model spectra of magnetic white dwarfs. We also thank our anonymous referee for helpful comments and for pointing some inconsistent wording in the original version of the paper. JV is supported by the Deutsches Zentrum für Luft- und Raumfahrt (DLR) GmbH under contract No. FKZ 50 OR 0404. BTG was supported by a PPARC Advanced Fellowship.References
- Beuermann (2000) Beuermann, K. 2000, New Astronomy Review, 44, 93
- Beuermann et al. (1999) Beuermann, K., Baraffe, I., & Hauschildt, P. 1999, A&A, 348, 524
- Beuermann et al. (1998) Beuermann, K., Baraffe, I., Kolb, U., & Weichhold, M. 1998, A&A, 339, 518
- Beuermann & Weichhold (1999) Beuermann, K. & Weichhold, M. 1999, in ASP Conf. Ser. 157: Annapolis Workshop on Magnetic Cataclysmic Variables, ed. C. Hellier & K. Mukai, 283–+
- Bragaglia et al. (1995) Bragaglia, A., Renzini, A., & Bergeron, P. 1995, ApJ, 443, 735
- Chabrier et al. (2000) Chabrier, G., Brassard, P., Fontaine, G., & Saumon, D. 2000, ApJ, 543, 216
- Chanmugam & Dulk (1981) Chanmugam, G. & Dulk, G. A. 1981, ApJ, 244, 569
- Cropper (1988) Cropper, M. 1988, MNRAS, 231, 597
- Cruz & Reid (2002) Cruz, K. L. & Reid, I. N. 2002, AJ, 123, 2828
- Delfosse et al. (2000) Delfosse, X., Forveille, T., Ségransan, D., et al. 2000, A&A, 364, 217
- Fischer & Beuermann (2001) Fischer, A. & Beuermann, K. 2001, A&A, 373, 211
- Friend et al. (1990) Friend, M. T., Martin, J. S., Connon-Smith, R., & Jones, D. H. P. 1990, MNRAS, 246, 637
- Gänsicke (2000) Gänsicke, B. T. 2000, Reviews of Modern Astronomy, 13, 151
- Gänsicke et al. (1995) Gänsicke, B. T., Beuermann, K., & de Martino, D. 1995, A&A, 303, 127
- Hagen et al. (1995) Hagen, H.-J., Groote, D., Engels, D., & Reimers, D. 1995, A&AS, 111, 195
- Kirkpatrick et al. (1999) Kirkpatrick, J. D., Reid, I. N., Liebert, J., et al. 1999, ApJ, 519, 802
- Leggett et al. (1996) Leggett, S. K., Allard, F., Berriman, G., Dahn, C. C., & Hauschildt, P. H. 1996, ApJS, 104, 117
- Li et al. (1995) Li, J., Wickramasinghe, D. T., & Wu, K. 1995, MNRAS, 276, 255
- Liebert et al. (2005) Liebert, J., Wickramsinghe, D. T., Schmidt, G. D., et al. 2005, AJ, 129, 2376
- Martín et al. (1999) Martín, E. L., Delfosse, X., Basri, G., et al. 1999, AJ, 118, 2466
- Nauenberg (1972) Nauenberg, M. 1972, ApJ, 175, 417
- Pallavicini et al. (1981) Pallavicini, R., Golub, L., Rosner, R., et al. 1981, ApJ, 248, 279
- Panei et al. (2000) Panei, J. A., Althaus, L. G., & Benvenuto, O. G. 2000, A&A, 353, 970
- Piters et al. (1997) Piters, A. J. M., Schrijver, C. J., Schmitt, J. H. M. M., et al. 1997, A&A, 325, 1115
- Pizzolato et al. (2003) Pizzolato, N., Maggio, A., Micela, G., Sciortino, S., & Ventura, P. 2003, A&A, 397, 147
- Reimers & Hagen (2000) Reimers, D. & Hagen, H.-J. 2000, A&A, 358, L45
- Reimers et al. (1999) Reimers, D., Hagen, H.-J., & Hopp, U. 1999, A&A, 343, 157
- Schmidt et al. (2005) Schmidt, G. D., Szkody, P., Vanlandingham, K. M., et al. 2005, ApJ, 630, 1037
- Schreiber & Gänsicke (2003) Schreiber, M. R. & Gänsicke, B. T. 2003, A&A, 406, 305
- Schwarz et al. (2001) Schwarz, R., Schwope, A. D., & Staude, A. 2001, A&A, 374, 189
- Schwope et al. (1993) Schwope, A. D., Beuermann, K., Jordan, S., & Thomas, H.-C. 1993, A&A, 278, 487
- Schwope et al. (2002) Schwope, A. D., Brunner, H., Hambaryan, V., & Schwarz, R. 2002, in ASP Conf. Ser. 261: The Physics of Cataclysmic Variables and Related Objects, ed. B. T. Gänsicke, K. Beuermann, & K. Reinsch, 102–+
- Schwope et al. (1997) Schwope, A. D., Mengel, S., & Beuermann, K. 1997, A&A, 320, 181
- Silvestri et al. (2005) Silvestri, N. M., Hawley, S. L., & Oswalt, T. D. 2005, AJ, 129, 2428
- Szkody et al. (2004) Szkody, P., Homer, L., Chen, B., et al. 2004, AJ, 128, 2443
- Townsley & Bildsten (2003) Townsley, D. M. & Bildsten, L. 2003, ApJ, 596, L227
- Vennes et al. (1997) Vennes, S., Thejll, P. A., Galvan, R. G., & Dupuis, J. 1997, ApJ, 480, 714
- Walkowicz et al. (2004) Walkowicz, L. M., Hawley, S. L., & West, A. A. 2004, PASP, 116, 1105
- Warner (1995) Warner, B. 1995, Cataclysmic variable stars (Cambridge Astrophysics Series, Cambridge, New York: Cambridge University Press, —c1995)
- Webbink & Wickramasinghe (2005) Webbink, R. F. & Wickramasinghe, D. T. 2005, in ASP Conf. Ser. 330: The Astrophysics of Cataclysmic Variables and Related Objects, ed. J.-M. Hameury & J.-P. Lasota, 137–+
- West et al. (2004) West, A. A., Hawley, S. L., Walkowicz, L. M., et al. 2004, AJ, 128, 426
- Wickramasinghe & Ferrario (2000) Wickramasinghe, D. T. & Ferrario, L. 2000, PASP, 112, 873
- York et al. (2000) York, D. G., Adelman, J., Anderson, Jr., J. E., et al. 2000, AJ, 120, 1579