The chemical content of nearby galaxies from planetary nebulae: NGC 147††thanks: Based on observations obtained at the Gemini Observatory, which is operated by the Association of Universities for Research in Astronomy, Inc., under a cooperative agreement with the NSF on behalf of the Gemini partnership.
Abstract
We report the results of spectroscopic observations, obtained with the GEMINI Multi-Object Spectrograph, of 8 planetary nebulae (PNe) in the dwarf spheroidal (dSph) galaxy NGC 147, a companion of M 31. The physico-chemical properties of the six brightest PNe (Corradi et. al., 2005) were derived using both the empirical icf method and photoionization modelling with cloudy. Different aspects of the evolution of low and intermediate mass stars in a low-metallicity environment are analysed using relationships between chemical abundances. In addition, certain features of the chemical evolution of NGC 147 were examined. In particular, the mean metallicity of PNe, O/H=8.06 (corresponding to [Fe/H]PNe), is close to the metallicity of the old stellar population, [Fe/H]= (i.e. Butler & Martínez-Delgado, 2005), suggesting a negligible chemical enrichment during a substantial amount of time. Finally, the luminosity-metallicity relationship for the dwarf galaxies of the Local Group is discussed. The location in the luminosity-metallicity diagram of dSphs does not exclude their formation from old dwarf irregular (dIrs) galaxies, but it does exclude their formation from the present time dIrs, since the differences between their metallicities are already present in their older populations. The offset in the luminosity-metallicity relationship indicates a faster enrichment of dSphs, and together with the different average abundance ratio [O/Fe] demonstrates the different star formation histories for these two types of galaxies.
keywords:
Galaxies: abundances - Local Group - Individual (NGC 147)1 Introduction
The rich variety of galaxies in the Local Group (LG) provides an opportunity to study in detail the formation and evolution of the most common types of galaxies in the Universe. One remarkable open question related to the evolution of dwarf galaxies is: are dwarf ellipticals and spheroidals the evolved descendants of previous star-forming dwarfs? This hypothesis can be tested through the metallicity-luminosity relation for LG dwarfs (Skillman et al., 1989). The key problem with this relation is that there are large uncertainties in the [O/Fe] assumed for non star-forming galaxies (Richer & McCall, 1995). A way to address this problem is by deriving the chemical abundances of a significant sample of LG dwarf galaxies using emission-line objects, such as PNe, which are present from early- to late-type galaxies. In fact PNe and H ii regions have been used to address this issue by a few groups (Richer & McCall, 1995; Stasinska, Richer & McCall, 1998; Magrini et al., 2005). Our motivation for this paper is to contribute to such a study by discussing new spectroscopic data for NGC 147 from the GEMINI telescope.
NGC 147, together with NGC 205 and NGC 185, is one of the three brightest dwarf companions of M31. At variance with NGC 185, NGC 147 is gas and dust free. The amount of H i in NGC 205 and NGC 185 is significantly higher than in NGC 147, in which the H i column density is at least a factor of 10 lower than in the other two galaxies. The dust clouds that are prominent in NGC 205 and NGC 185 are also lacking in NGC 147 (Young & Lo, 1997). NGC 147 and NGC 185 have similar star formation histories and are dominated by their old stellar populations, while NGC 205 shows several peculiarities, including a younger population (Mateo, 1998).
The stellar metallicity of NGC 147 is relatively well known. Based on deep V and I photometry of the central regions, Davidge (1994) has shown that NGC 147 is moderately metal-poor ([Fe/H]=). Its colour-magnitude diagram indicates the presence of old red giant branch (RGB) stars, as well as some stars formed at intermediate epochs, like asymptotic giant branch (AGB) stars about 5 Gyr old. Using RGB colours, Han et al. (1997) give two slightly different metallicities for the inner (up to 1.5 from the centre) and outer (from 1.5 to 4) fields of the galaxy, namely and , respectively. They point out that there is a weak tendency of increasing metallicity with galactocentric radius in the outer field. Han et al. (1997) also stress the presence of an AGB population with an age of several Gyrs, and the absence of main sequence stars with MV 1, suggesting that the star formation in NGC 147 ceased at least 1 Gyr ago. On the other hand, Nowotny et al. (2003) used a four-colour photometry to analyse the late-type stellar content of this galaxy and that of NGC 185, separating AGB stars of different chemistry (O- and C-rich, i.e., M- and C-type stars). From the mean RGB colour indices, they conclude that the metallicity of NGC 147 is [Fe/H]= and that of NGC 185 is [Fe/H]=.
In summary, following the above arguments and the work by Mateo (1998), while NGC 147 and NGC 185 are very similar in terms of their stellar content, star formation history and absolute luminosity, their metallicity is different.
In this paper, we present the determination of chemical abundances in NCG 147 using PNe. These data allow us to address some aspects of the chemical evolution of the galaxy, its consequences for the luminosity-metallicity relation of the LG dwarfs, as well as the properties of the PNe themselves. In fact, it appears that NGC 147 and NGC 185 also have different PNe populations: PNe in NGC 185 are systematically brighter than those in NGC 147 (Corradi et. al., 2005). Note that lower limits for the O/H abundances of the PNe in NGC 185 and NGC 205 were determined by Richer & McCall (1995).
The paper is organized as follows. The Multi Object Spectroscopy (MOS) data and their reduction are discussed in Section 2. In Section 3, we present the derivation and analysis of the PNe physical parameters and chemical abundances. These are then discussed in Sect. 4 using different relationships, and in Sect. 5 they are compared with the stellar metallicity and the age-metallicity relation. Section 6 is devoted to the luminosity-metallicity relation for dwarf spheroidals and irregulars. Finally, our conclusions are presented in Section 7.
2 Data Acquisition and Reduction
Seven of the nine PNe identified in NGC 147 from narrow band photometry by Corradi et. al. (2005) were observed spectroscopically using the GEMINI Multi-Object Spectrograph North (GMOS-N).
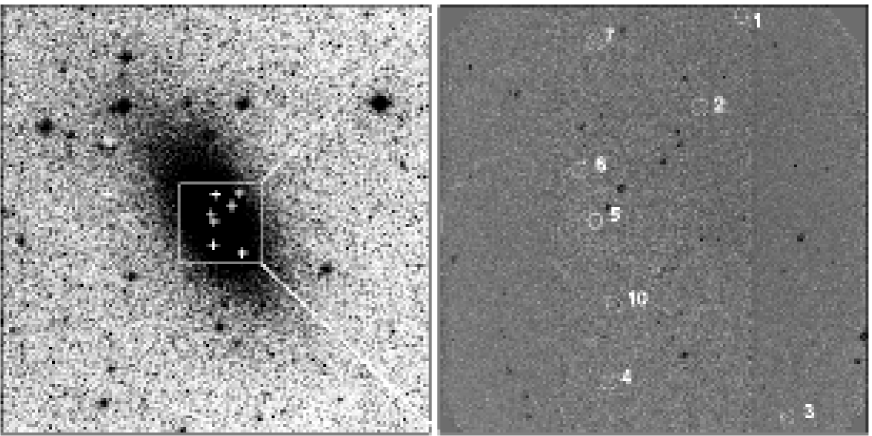
The pre-imaging needed to build the MOS mask was also obtained with GMOS-N on August 14, 2005. Images were taken using a narrow-band H filter and a broad-band continuum filter R, whose central and are 655/6.9nm and 657/83nm, respectively. The exposure times were 2300s in H and 260s in R. The seeing was 0.7 arcsec. These images were used to produce a continuum-subtracted image to determine the position of the long-slits and to create a MOS mask containing seven PNe. In addition, a new PN was identified with the GMOS pre-imaging and consequently inserted in the spectroscopic observations. The identification of the original 7 PNe in the MOS mask are those given by Corradi et. al. (2005) in their Table 1, and named PN1 to PN7. The coordinates of the new PN, called PN 10, are: R.A.=00 33 11.87, Dec=+48 28 11.7 (J2000.0). Figure 1 shows the image of NGC 147, marking the position of the 8 PNe studied in this work.
The GMOS-N in its spectroscopic mode was used in two different nights to obtain the PN spectra. The “red” spectra were taken on October 31, 2005 with the R400+5305 grating, in two exposures of 1800s each. As for the “blue” spectra, data were obtained on December 3, 2005, with the B600+G5303 grating, in 22800s exposures. In both configurations the slits widths were 1 arcsec, and the pixel binning was 22 (spectralspatial). The spectral and spatial resolutions were: 0.3 nm and 0′′.094 pix-1, respectively, with B600 and 0.8 nm and 0.′′134 pix-1 with R400. The seeing during the “blue” and “red” spectroscopic observations was 0.5 arcsec and 0.7 arcsec, respectively.
A CuAr calibration was obtained with the B600+G5303 grating, but the only CuAr exposure taken with R400+5305 was not good enough to be used for wavelength calibration. Because of that, we have calibrated all the “red” spectra using a list of skylines. This method gives a satisfactory wavelength calibration, thanks to the large number of skylines in the red part of the spectra. An exposure of the spectroscopic standard star G191B2B was taken with each configuration around the date of the observation of the spectra, and these exposures were applied in the flux calibration of our data. Data were reduced using the Gemini GMOS data reduction script and longslit tasks, both being part of the IRAF package.
The selected slit length varies from one PN to another according to the field crowdedness. Also, different slit distances from the bisector of the mask in the North-South direction correspond to a different wavelength coverage. Typically, the “blue” spectra covered a spectral range from 300–350 nm to 570–650 nm. In the case of the “red” spectra, they covered from 500-620 nm to 920–1050 nm. Note that there is some wavelength overlap between the “blue” and “red” spectra. As an intense emission line was not always found in the overlap zone, we used the spectra of PN3 which contains the H line in both “red” and “blue” spectra to obtain a scale factor of 0.8 for all PNe. This scale factor was applied to the fluxes measured in the “red” spectra in order to get the fluxes reported in Table 1. In fact, from our previous experience with multi-object spectroscopy, we have noticed that differences of the scale factors are generally small, amounting to about 5-10%. We have also evaluated which is the error that we are adding to the measured fluxes due to the uncertainty in the matching. This error amounts to about 7%, which can be considered a characteristic measure of the uncertainty on the scale factors.
Note that in PN5 only the fluxes of the [O iii] 495.9 nm and 500.7 nm lines were measured, so that this PN does not appear in the following analysis. Errors in the fluxes were calculated taking into account the statistical error in the measurement of the fluxes, as well as systematic errors of the flux calibrations, background determination, and sky subtraction. Table 2 shows the estimated percentage errors for a range of line fluxes (relative to H=100) in each PN. Here, and throughout the paper, quoted uncertainties are 1- errors.
3 Data analysis
3.1 Extinction and Physical Parameters
The observed line fluxes were corrected for the effect of the interstellar extinction using the extinction law by Mathis (1990) with =3.1. We used as a measurement of the extinction, which is defined as the logarithmic difference between the observed and de-reddened H fluxes. Since the “blue” part of the spectra, which contains also the H and H lines, is affected by larger uncertainties, the was determined comparing only the observed Balmer I(H)/I(H) ratio with its theoretical value, 2.85 (Osterbrock, 1989). For the higher signal to noise spectrum of PN4, whose H line was lost in the gap between two CCDs, the I(H)/I(H) was used to compute the extinction. The values of and their 1- errors are shown in the last row of Table 1. is related to E(B-V) through the following relation: =0.4 Rβ E(B-V), where Rβ=3.7. The average value of the extinction of the PNe =0.070.07 gives E(B-V)=0.050.10, which is comparable with the reddening value E(B-V)=0.173 derived by Schlegel, Finkbeiner & Davis (1998) toward NGC 147, from dust infrared emission features. Patchiness of dust and gas toward NGC 147 (Sohn et al., 2006) might be the reason of appreciable variations of the reddening throughout the galaxy area.
The extinction-corrected intensities (given in the middle column of Table 1) were then used in order to obtain the densities and temperatures for each PN. As we can see in Table 1, [S ii]671.6,673.1, usually used as an electron density estimator, was measured only in PN4, PN6 and PN10 (and an upper limit is given for PN1). As for the temperature estimation, we were able to use the I(495.9+500.7)/I(436.3) ratio, giving [O iii], for all the PNe but PN10 (also note that only an upper limit is given for PN6). In the particular case of PN4, two other temperature estimators were also used, namely I(654.8+658.3)/I(575.5) for [N ii] and I(372.6+372.9)/I(732.0+733.0) for [O ii]. The derived electron densities and temperatures, and their errors, are listed in the upper part of Table 3.
This is the first direct determination of the physical parameters of emission line objects in NGC 147, which prevents us to perform any external comparison.
3.2 Empirical icf abundances
Chemical abundances were derived from the emission-line intensities using the Ionization Correction Factors (icf) method. The icf were computed following the prescriptions by Kingsburgh & Barlow (1994).
As mentioned above, the [O iii] 436.3 nm emission line was measured with a sufficiently high signal to noise ratio in five PNe, namely PN1, 2, 3, 4, and 7. There, [O iii] could be directly determined. In one case, PN6, we could estimate an upper limit to the [O iii] 436.3 nm emission line, and consequently an upper limit to [O iii].
For PN 10, we could not measure this temperature diagnostic emission line, and therefore we could not derive its chemical abundances. Finally, as noted before, in the spectrum of PN5, only the [O iii] doublet 495.9,500.7 nm could be detected, preventing any further analysis. In PN4, [O iii] was used in computing chemical abundances with the icf method for ions which are ionized twice or more times, and [N ii] for singly ionized species.
The icf method was applied to the six PNe with an electron temperature measurement. Formal errors on the icf abundances were computed taking into account the uncertainties in the observed fluxes, in the electron temperatures and density, and in the , as done in Gonçalves et al. (2003) and Magrini et al. (2005). The ionic and total abundances, as well as the ionization correction factors, are reported in Table 4.
3.3 cloudy photoionization modelling
PNe were also modelled using the photoionization code cloudy 95.06 (Ferland et al., 1998). The complete procedure is described in Magrini et al. (2004). Here we remind the most important parameters and assumptions. The input parameters for cloudy are i) the energy distribution, ii) the luminosity of the central star, iii) the nebular geometry, iv) the hydrogen density, NH, and v) the chemical abundances. At the large distance of NGC 147, PNe are not resolved and we assumed the most simple geometry of spherical symmetry with constant density. The energy distribution of the central star was set to that of a blackbody (BB). In fact, as described by Magrini et al. (2004), the model atmospheres by Rauch (2003) give similar results in terms of chemical abundance determinations. Dust grains were added to the models, since they have an important effect, particularly on the temperature structure of the PNe (see, for instance, Gonçalves et al., 2004). This effect depends on the type of grain (graphite and/or silicate), the grain abundances, and the grain-size distribution, being more relevant in the inner regions of the nebula (see Dopita & Sutherland, 2000). Dust type and size distribution adopted are those typical of Galactic PNe, with ISM gas-phase depletion due to grains following van Hoof et al. (2004).
The BB temperature T⋆ was derived using Ambartsumian’s method (Ambartsumian, 1932), i.e. using the Heii(468.6)/Hi(486.1) line flux ratio, or the ([Oiii]495.9+[Oiii]500.7)/Heii468.6 line ratio method (Gurzadyan, 1988). This is done only for the first iteration, in the following ones the BB temperature was adjusted as to match the Hei/Heii line ratio.
The luminosity L⋆ of the central star was set to reproduce the photometric absolute flux of the [O iii] 500.7 nebular line, as given in Corradi et. al. (2005). The external and internal radii of the shell, Rin and Rext, were varied to match the ratio of lower and higher excitation ions, as [O iii]/[O ii]. Density was derived from the [S ii] 671.7/673.1 intensity ratio, which was measured in PN1, PN4, and PN6. For the remaining PNe, it was assumed to be equal to 5000 cm-3, which can be considered a typical value for Galactic PNe (see e.g. Stanghellini & Kaler, 1989). In addition, we made some tests varying the density by 1000 cm-3 with both the icf and cloudy methods, obtaining negligible changes in the computed abundances. We assumed the average non-Type I Galactic PNe abundances from Kingsburgh & Barlow (1994) as initial chemical abundances. The parameters of the best cloudy model (for the central star T⋆, L⋆, and for the nebula NH, Rin, Rext) are shown in the second half of Table 3.
Subsequently, chemical abundances were varied to match the observed and predicted intensities within 5% for the lines brighter than H and 10% for the other lines. As explained above, we considered dust in our modeling. This inclusion came from the necessity of finding a good agreement between the empirical and cloudy temperatures. The abundances of C, O and Fe (the most important coolants) were also slightly modified to refine the match with the empirical Te. It is clear from Table 3 that the model Te is similar to the empirical one, with the exception of PN4. In the latter case, we have three different empirical measurements of the electron temperature. Our simple model with uniform density is not capable of reproducing the empirical temperatures, likely because of different conditions in different zones of the nebula. We therefore decided to reproduce just the the average of [O iii] and [N ii]. No other simple assumption for the radial profile (e.g. decreasing with radius) was able to reproduce satisfactorily the observed line intensities.
The results of the best-fitting cloudy models, in terms of chemical abundances (and their errors) are shown in Table 5. Note that icf abundances are in good agreement with those derived using cloudy, whose mean values for the different elements, in units of 12 + log X/H, are: He/H=11.02; O/H=8.06; N/H=7.70; Ne/H=6.68; S/H=6.35; and Ar/H=5.13.
4 Chemical abundance patterns
PNe are formed by stars ranging from 0.8 to 8 M⊙, which loose their chemically enriched envelopes during the AGB evolution. Relationships between chemical abundances of He/H, N/O, N/H and O/H are known to exist in Galactic PNe (cf. Henry, 1990). Extragalactic PNe are important because they allow us to test if these relationships also hold in different environments. In particular, PNe belonging to dwarf galaxies permit to extend these relations to very low metallicities.
The relation between log N/O and He/H for the PNe of NGC 147 (except PN3, for which only a crude limit of N/H could be derived) is shown in Figure 2, where our cloudy chemical abundances are compared with the models by Marigo (2001), built for initial metallicities of Z=0.008, and new models by Marigo (private communication) for Z=0.001 and Z=0.004. The lower metallicity models (Z=0.001 and Z=0.004) predict, for progenitor masses below 3M⊙, an enhancement of O/H compared to N/H, producing a N/O abundance ratio that decreases with He/H. For higher mass progenitors, N/O increases quickly and significantly as the result of hot-bottom burning. In the model with Z=0.008, the N/O ratio remains almost constant for initial masses below 3M⊙. The metallicity of NGC 147 is Z=0.002 (cf. Davidge, 1994; Han et al., 1997; Nowotny et al., 2003). Taking into account the errors of the He abundances and of the N/O ratio, the NGC 147 PNe are consistent with the Z=0.001 and Z=0.004 tracks. PN4 and PN7 might be consistent with a higher metallicity, and consequently a more recent formation.

The correlation between log N/O and 12 + log N/H is shown in Figure 3 for PNe belonging to several LG galaxies. This relation is well defined for PNe with a slope close to unity, suggesting that the increase of N/O with N/H is due to the increase of N, which is mainly produced by the CN cycle, without modifying the oxygen abundance through the ON cycle. Theoretical predictions of N/O vs. N/H for different masses of the progenitor stars and metallicity (Groenewegen & de Jong 1994, for the LMC metallicity; and Marigo 2001; for Z=0.001 and Z=0.004) are also shown. Note that Type I PNe which experienced hot bottom burning conversion of C to N, are located outside the relation. The PNe of NGC 147 are in agreement with the general behaviour of the LG PNe. Following the classical definitions of Galactic Type I PNe, N/O and He/H (Peimbert & Torres-Peimbert, 1983) or the more stringent one N/O (Kingsburgh & Barlow, 1994), the NGC 147 sample does not include Type I PNe. However, it has to be noted that the original definition of Type I PNe only holds for the metallicity of the Galaxy (Magrini et al., 2004). The absence of Type I PNe would not be surprising if we consider that they are typically associated to younger progenitors (Corradi & Schwarz, 1995) while the predominant stellar population in this galaxy is very old.

Figure 4 shows the log O/H vs. 12 + log N/O for a sample of LG PNe. There is not a clear correlation between these two quantities, as already noted in previous works (cf. Henry, 1990; Richer, 2006).

5 The chemical evolution of NGC 147
The elemental abundances shown in Table 4 and Table 5 can also be compared with the metallicity measured in stars of this galaxy. Given that icf and cloudy abundances are in good agreement, we use the cloudy O/H mean value, as given in the last row of Table 5, that considers six PNe.
In principle, O/H can be converted into [Fe/H] using the following relation: [Fe/H]PNe=[O/H]PNe obtained by Mateo (1998). This relation is useful for comparing samples of galaxies, but less valid considering galaxies individually. Even on a statistical sense, this transformation is uncertain ( dex; Mateo, 1998). Keeping in mind this strong limitation, the mean O/H that we obtained for NGC 147, gives [Fe/H]PNe= ([O/Hsolar=8.66; Asplund, 2003), in agreement with metallicities of the RGB population (Davidge, 1994; Han et al., 1997; Nowotny et al., 2003), discussed in Sect. 1. Moreover, when we plot [Fe/H]PNe in terms of the galactocentric distance (not shown here), the weak gradient with metallicities increasing from the central to the outer zones of the galaxy, argued by Han et al. (1997), is not confirmed. In summary, this crude agreement between PNe metallicities and old-population metallicity would suggest that NGC 147 did not experience a significant chemical enrichment during a long period of time.
As described in Section 3.3, the modelling with cloudy allowed us to estimate stellar parameters as the luminosity and temperature of the central stars. The model T⋆ and L⋆ are listed in Table 4 and can be located in the T⋆-L⋆ diagram. Their location are then compared with the available H-burning and He-burning evolutionary tracks, for Z= and Z= (Vassiliadis & Wood, 1994), as shown in Figure 5. From the loci of the central stars in the H-R diagram, we can estimate the central star masses, which range from 0.56 to 0.59 M⊙. Using the initial to final mass relationship adopted by Vassiliadis & Wood (1994), we find that the masses of the progenitor stars were between 0.9 and 1.0 M⊙. Stars with these main sequence masses and with an initial metallicity of Z=0.001 were born about 10 to 7 Gyr ago (Charbonnel et al., 1999). This is in agreement with what is known about the star formation history of NGC 147. As described in Sect. 1, the colour-magnitude diagrams suggest the presence of old RGB stars and of a small number of intermediate-age AGB stars with an age of about 5 Gyr.

From the study of chemical evolution of dwarf spheroidal galaxies, it is known that these galaxies are characterized by one or two long bursts of star formation (Lanfranchi & Matteucci, 2003). The low gas content is the result of gas consumption by star formation and gas removal by an efficient galactic wind.
A detailed comparison of the PNe abundances obtained in this paper with those for the other two bright dwarf companions of M31 is not possible. The only other available PNe study for these galaxies is in fact that of Richer & McCall (1995), who have observed only two PNe in NGC 205, one of them giving 12 + log O/H=8.21 and the other 8.11. In the case of NGC 185 (Richer & McCall, 1995), the [O iii]4363 nm line was not detected in any of the PNe, thus the derived abundances are quite uncertain. Richer & McCall (1995) applied empirical methods, derived from properties of PNe in the Magellanic Clouds and the Milk Way, to correct their lower limits of O/H, concluding that their values underestimate the O/H abundances of these two galaxies by 0.37 dex. After this correction, they obtained 12 log O/H=8.60 and 8.20 for NGC 205 and NGC 185, respectively, which are comparable to the value of 8.06 that we find for NGC 147 (within the uncertainties).
6 The luminosity-metallicity relationship of dIrs and dSphs
It has been proposed that dwarf spheroidal galaxies are formed through the removal of the gas in dwarf irregulars, either through ram pressure stripping, supernova driven winds or star formation (Kormendy & Djorgovski, 1989). In this scenario, as described by Richer & McCall (1995), once the gas finished and the star formation stopped, the old dIr-like galaxies fade in luminosity as their stellar population ages. According to this, dSphs are expected to have, at a given luminosity, a higher metallicity than dIrs. The luminosity-metallicity relationship has been deeply studied for dIr galaxies by several authors (Skillman et al., 1989; Richer & McCall, 1995; Larsen et al., 2001; Van Zee et al., 2006; Lee et al., 2006). One of the most recent compilation of oxygen abundance in nearby low luminosity gas rich galaxies, dIrs, is by Van Zee et al. (2006). The weighted least-squares fit to the luminosity vs. metallicity data for the fifty dIr galaxies within 50 Mpc with an oxygen abundance determination is
| (1) |
While oxygen abundances can be derived relatively easily for gas rich galaxies using H ii regions, it is quite difficult to obtain them for non-star forming dSph galaxies. On the other hand, for these galaxies the stellar iron abundances are known. The comparison of dSph metallicity with dIr oxygen abundances is thus dependent on the [O/Fe] adopted. This ratio depends in turn on the star formation history (Gilmore & Wyse, 1991). To overcome the problem, Richer & McCall (1995) proposed to use PNe as probes of the stellar oxygen abundance in both dIrs and dSphs. PNe are in fact present in all types of galaxies and, with few exceptions Magrini et al. (2005, cf. Sextans A PNe), they do not produce oxygen, and thus they are representative of the stellar progenitor oxygen abundance.
Figure 6 shows the luminosity-metallicity relationship obtained using oxygen abundances of H ii regions. the continuous line is the fit by Van Zee et al. (2006). The oxygen abundances of PNe in dIrs are marked with stars and those of PNe in dSphs with filled circles. The average oxygen abundance of PNe in NGC 147 is marked with a filled square. Note that the dIr PNe abundances are in good agreement with the luminosity-metallicity relation from H ii regions, with the exception of the only PN of Sextans A, where oxygen dredge-up occurred (see Magrini et al., 2005). On the other hand, the oxygen abundances of dSph PNe exceed those predicted by eq. 1: at a given luminosity, dSphs have a higher metallicity than dIrs.
The similarity of the oxygen abundance found in PNe belonging to dIr galaxies to that found in the ISM (H ii regions) suggests that the observed PNe in dIrs, which are also the brightest, are the products of rather recent star formation. At variance, the mean abundance in the PN population of dSph galaxies, where star formation ceased long ago, should be closer to the mean abundance of the stellar populations in that galaxy. Considering, thus, the difference of the age of the PN populations in dIrs and dSphs, the true difference between the oxygen abundances referred to the same epoch in dwarf irregulars and spheroidals might be larger than what Figure 6 indicates. The offset in the luminosity-metallicity diagram does not rule out the possibility that dSph galaxies come from primordial dIrs-like progenitors that consumed all their gas content and then faded in luminosity (cf. Richer & McCall, 1995). On the other hand, the metallicity offset is against the hypothesis that dwarf spheroidals form from present-time dwarf irregulars. As discussed by Grebel (2005), dwarf irregulars and dwarf spheroidals may have been very similar initially, but the early evolution of the two types differed greatly, with dwarf spheroidals forming more stars and enriching themselves more, as observed from their stellar population –which is more metal rich than those of dIrs.
If we also consider the [O/Fe] ratio, as discussed extensively by Richer & McCall (1995), large differences of this ratio in dIrs and dSphs are found (see their Table 6). [O/Fe] is larger in dSphs than in dIrs, reflecting the higher gas consumption rate of the dSphs and therefore a substantially different star formation history. The [O/Fe]=0.44 of NGC 147, computed adopting [Fe/H]=-1 by Davidge (1994) and solar abundances of iron and oxygen by Asplund (2003), point in this direction.
In conclusion, the offset in the luminosity-metallicity relationship indicates a faster enrichment of dSphs, and together with the different average abundance ratios [O/Fe] highlights different star formation histories for these two classes of galaxies.

7 Conclusions
Using the icf method as well as cloudy photoionization modelling, we have analyzed new GEMINI MOS data for the PNe of NGC 147, one of the most remarkable dwarf spheroidal companions of Andromeda. The physical parameters and the elemental abundances of He, O, N, Ne, Ar and S, for the six brightest PNe identified in this galaxy by Corradi et. al. (2005) have been determined.
We find that, adopting the definition in the Galaxy, there are no Type I PNe in the NGC 147, an expected result, since Type I PNe are typically associated to younger and massive progenitors, while the predominant stellar population in this galaxy is old.
From the literature, the comparison of the near-IR photometry of the AGB stars in the three brightest M31 dwarf companions shows that ages of 1 and 0.1 Gyr are predicted for the most recent star formation in NGC 185 and NGC 205, respectively, while the last event that formed stars in NGC 147 occurred some 1 to 3 Gyr ago (Davidge, 2005; Han et al., 1997). In terms of the stellar metallicity, the three galaxies have similar median photometric abundances: [Fe/H]=-1.110.08 (NGC 185); -1.060.04 (NGC 205); and -10.03 (NGC 147) (Butler & Martínez-Delgado, 2005).
Our determination of the oxygen abundance for the PNe of NGC 147, is comparable (within the uncertainties) to those of NGC 185 and NGC 205. The O/H abundance converts to [Fe/H]PNe=-0.97, which is similar to the stellar metallicity of NGC 147. This similarity between intermediate-age PNe population and the old stellar population of the galaxy implies that no significant chemical enrichment has occurred during a long period of time.
Finally, the luminosity-metallicity for the dwarf galaxies of the Local Group is analyzed. We conclude that the location in the luminosity-metallicity diagram of dSphs exclude their formation from present-time dIrs, and together with the abundance ratio [O/Fe] points to different star formation histories for these two classes of galaxies.
Acknowledgments
We would like to thank M. Richer, the referee of this paper, for his valuable comments and suggestions which significantly improved the paper. We acknowledge M. Perinotto for using his program to perform a fast evaluation of the chemical abundances that we then compared with our own evaluation. The work of DRG is supported by the Brazilian Agency FAPESP (03/09692-0 and 04/11837-0), and that of LM by the Italian National Institute of Astrophysiscs (INAF).
References
- Ambartsumian (1932) Ambartsumian V. A., 1932, Poulkovo Obs. Circ 4, 8
- Asplund (2003) Asplund M., 2003, CNO in the Universe, ed. C. Charbonnel, D. Schaerer, & G. Meynet (San Francisco: ASP), ASP Conf. Ser., 304, 275
- Butler & Martínez-Delgado (2005) Butler D. J., & Martínez-Delgado D., 2005, AJ, 129, 2217
- Charbonnel et al. (1999) Charbonnel C, Dappen W., Schaerer D., Bernasconi P. A., Maeder A., Meynet G., Mowlavi N., 1999, A&AS, 135, 405
- Corradi & Schwarz (1995) Corradi R. L. M., & Schwarz H. E., 1995, A&A, 293, 871
- Corradi et. al. (2005) Corradi R. L. M., et al., 2005, A&A, 431, 555
- Davidge (1994) Davidge T. J., 1994, AJ, 108, 2123
- Davidge (2005) Davidge T. J., 2005, AJ, 130, 2087
- Dopita & Sutherland (2000) Dopita M. A., & Sutherland R. S., 2000, ApJ, 539, 742
- Ferland et al. (1998) Ferland G. J., Korista K. T., Verner D. A., Ferguson J. W., Kingdon J. B., & Verner E. M., 1998, PASP 110, 761
- Gilmore & Wyse (1991) Gilmore G., & Wyse R. F., 1991,ApJ, 367,L55
- Gonçalves et al. (2003) Gonçalves D. R., Corradi R. L. M., Mampaso A., & Perinotto M., 2003, ApJ, 597, 975
- Gonçalves et al. (2004) Gonçalves D. R., Mampaso A., Corradi R. L. M., Perinotto M., Riera A., López-Martín L., 2004, MNRAS, 355, 37
- Grebel (2005) Grebel, E. K. 2005, in Stellar Astrophysics with the World’s Largest Telescopes: First International Workshop on Stellar Astrophysics with the World’s Largest Telescopes, ed. J. Mikolajewska and A. Olech (New York: American Institute of Physics), AIP Conference Proceedings, 752, 161
- Groenewegen & de Jong (1994) Groenewegen M. A. T., & de Jong T., 1994, A&A, 282, 127
- Gurzadyan (1988) Gurzadyan G. A., 1988, ApSS, 149, 343
- Han et al. (1997) Han M., Hoessel J. G., Gallagher, J. S. III, Holtsman J., Stetson P. B., 1997, AJ 113, 1001
- Henry (1990) Henry R. B. C., 1990, ApJ, 356, 229
- Kingsburgh & Barlow (1994) Kingsburgh R. L., & Barlow M. J., 1994, MNRAS 271, 257
- Kormendy & Djorgovski (1989) Kormendy J, & Djorgovski S., 1989, ARA&A, 27, 235
- Jacoby & Ciardullo (1999) Jacoby G. H., Ciardullo R,, 1999, ApJ, 515, 169
- Lanfranchi & Matteucci (2003) Lanfranchi G. A., Matteucci F., 2003, MNRAS, 345, 71
- Larsen et al. (2001) Larsen T. I., Sommer-Larsen J., Pagel B. E. J., 2001, MNRAS, 3223, 555
- Lee et al. (2006) Lee H., Skillman E. D., Cannon J. M., Jackson D. C., Gehrz R. D., Polomski E. F., Woodward C. E., 2006, ApJ, 647, 970
- Leisy & Dennefeld (2006) Leisy P. & Dennefeld M., 2006, A&A, 456, 451
- Leisy et al., (in prep.)
- Magrini et al. (2004) Magrini L., Perinotto M., Mampaso A. & Corradi R. M. L., 2004, A&A 426, 779
- Magrini et al. (2005) Magrini L. Leisy P., Corradi R. M. L., Perinotto M., Mampaso A. & Vílchez J. M., 2005, A&A 443, 115
- Marigo (2001) Marigo P., 2001, A&A, 370, 194
- Mateo (1998) Mateo M. L., 1998, ARA&A 36, 435
- Mathis (1990) Mathis J.S. 1990, ARA&A 28, 37
- Nowotny et al. (2003) Nowotny W., Kerschbaum F., Olofsson H., Schwarz H. E., 2003, A&A, 403, 93
- Osterbrock (1989) Osterbrock D. E., 1989, in Astrophysics of Gaseous Nebulae and Active Galactic Nuclei (Mill Valley: Univ. Science Books)
- Peimbert & Torres-Peimbert (1983) Peimbert M., Torres-Peimbert, S., 1983, IAU Symp. 103, Planetary Nebulae, ed. D. R. Flower (Kluwer, Dordrecht), p. 233
- Perinotto, Morbidelli & Scatarzi (2004) Perinotto M., Morbidelli L., Scatarzi A., 2004, MNRAS, 349, 793
- Rauch (2003) Rauch T., 2003, A&A 403, 709
- Richer (2006) Richer M. G., 2006, to appear in the proceedings of the IAU symposium 234, April 3-6 2006, held in Hawaii
- Richer & McCall (1995) Richer M. G., & McCall M. L., 1995, ApJ, 445, 642
- Richer et al. (1999) Richer M. G., Stasinska G., & McCall M. L., 1999, A&AS, 135, 203
- Skillman et al. (1989) Skillman E. D., Kennicutt R. C., Hodge P. W., 1989, ApJ, 347, 875
- Schlegel, Finkbeiner & Davis (1998) Schlegel, D. J., Finkbeiner, D. P., Davis, M., 1998, ApJ, 500, 525
- Sohn et al. (2006) Sohn Y.-J., Kang A., Rhee J., Shin M., Chun M.-S., & Kim Ho-Il, 2006, A&A, 445, 69
- Stanghellini & Kaler (1989) Stanghellini L., & Kaler J. B., 1989, ApJ 343, 811
- Stasinska, Richer & McCall (1998) Stasinska G., Richer M. G., McCall M. L., 1998, A&A, 336, 667
- van Hoof et al. (2004) van Hoof P. A. M., Weingartner J. C., Martin P. G., Volk K., & Ferland G. J., 2004, MNRAS, 350, 1330
- Van Zee et al. (2006) Van Zee L., Skillman E. D., Haynes M. P., 2006, ApJ, 637, 269
- Vassiliadis & Wood (1994) Vassiliadis E., & Wood P. R., 1994, ApJS, 92, 125
- Young & Lo (1997) Young L. M., & Lo K. Y., 1997, ApJ, 476, 127
- Zijlstra et al. (2006) Zijlstra A. A., Gesicki K., Walsh J. R., Péquignot D., van Hoof P. A. M., Minniti D., 2006, MNRAS, 369, 875
| PN1 | PN2 | PN3 | PN4 | |||||||||
|---|---|---|---|---|---|---|---|---|---|---|---|---|
| Ion | F | I | ICLOUDY | F | I | ICLOUDY | F | I | ICLOUDY | F | I | ICLOUDY |
| 372.7 [O ii] | 5.3 | 5.3 | 15.0 | 8.3 | 8.5 | 30. | - | - | - | 27.5 | 30.1 | 30.1 |
| 383.5 H9 | - | - | - | - | - | - | - | - | - | 4.5 | 4.9 | 7.3 |
| 386.8 [Ne iii] | - | - | - | 30.4 | 30.6 | 30.2 | 8.6 | 8.6 | 8.4 | 9.7 | 10.5 | 10.5 |
| 388.9 Hei, H8 | - | - | - | - | - | - | 73.6 | 73.6 | - | 8.5 | 9.2 | 10.5 |
| 396.7 [Ne iii],H7 | - | - | - | 58.2 | 59.5 | - | 62.9 | 62.9 | - | 17.8 | 19.2 | 16.0 |
| 410.1 H | - | - | - | - | - | - | - | - | - | 23.6 | 25.1 | 26.0 |
| 434.0 H | 36.9 | 37.1 | 47.1 | 41.5 | 42.0 | 47.2 | 33.8 | 33.8 | 46.6 | 44.1 | 46.0 | 47.0 |
| 436.3 [O iii] | 11.5 | 11.6 | 9.5 | 17.4 | 17.6 | 16.0 | 16.0 | 16.0 | 15.5 | 1.5 | 1.6 | 3.7 |
| 447.1 Hei | - | - | - | - | - | - | - | - | 4.0 | 4.1 | 7.9 | |
| 468.6 Heii | 10 | 11 | 16.6 | 3.5 | 3.5 | 4.9 | 14.1 | 14.1 | 13.4 | 1.7 | 1.7 | 1.8 |
| 486.1 H | 100. | 100. | 100. | 100. | 100 | 100 | 100. | 100 | 100 | 100. | 100. | 100. |
| 495.9 [O iii] | 244.4 | 244.1 | 235.1 | 308.3 | 307.6 | 291.0 | 255.4 | 255.4 | 242.1 | 120.4 | 119.5 | 121.4 |
| 500.7 [O iii] | 710.7 | 709.6 | 707.7 | 865.6 | 862.6 | 875.4 | 712.2 | 712.2 | 729.0 | 364. | 359.8 | 365.3 |
| 575.5 [N ii] | - | - | - | - | - | - | - | - | - | 1.6 | 1.5 | 0.8 |
| 587.6 Hei | 14.5 | 14.4 | 14.0 | 13.0 | 12.7 | 12.4 | 6.4 | 6.4 | 6.7 | 22.9 | 21.4 | 21.2 |
| 654.8 [N ii] | - | - | - | - | - | - | - | - | - | 17.4 | 15.8 | 15.1 |
| 656.3 H | 288.9 | 285.0 | 278.6 | 293.6 | 285.0 | 274.0 | 260. | 260. | 258. | 315. | 285. | 281. |
| 658.4 [N ii] | 6 | 6 | 6.0 | 17.1 | 16.6 | 16.2 | 1 | 1 | 1.1 | 49.6 | 44.8 | 44.5 |
| 667.8 Hei | - | - | - | - | - | - | - | - | 2.5 | 2.2 | 6.0 | |
| 671.7 [S ii] | 1.3 | 1.2 | 1.2 | - | - | - | - | - | - | 1.4 | 1.3 | 1.3 |
| 673.1 [S ii] | 2 | 2 | 2.0 | - | - | - | - | - | - | 2.1 | 1.9 | 2.0 |
| 706.5 Hei | - | - | - | - | - | - | - | - | - | 1.8 | 1.6 | 1.6 |
| 713.5 [Ar iii] | - | - | - | 1.3 | 1.2 | 1.3 | 1. | 1. | 1.1 | 1.6 | 1.4 | 1.5 |
| 728.1 Hei | - | - | - | - | - | - | - | - | - | 0.5 | 0.5 | 0.6 |
| 732.0 [O ii] | - | - | - | - | - | - | - | - | - | 2.4 | 2.1 | 1.2* |
| 733.0 [O ii] | - | - | - | - | - | - | - | - | - | 1.4 | 1.2 | 1.2* |
| 906.9 [S iii] | - | - | - | 0.57 | 0.54 | 0.61 | - | - | - | - | - | - |
| 953.2 [S iii] | - | - | - | - | - | - | 2 | 2 | 0.3 | - | - | - |
| 0.020.003 | 0.040.01 | 0.00.02 | 0.140.02 | |||||||||
| PN6 | PN7 | PN10 | |||||||
|---|---|---|---|---|---|---|---|---|---|
| Ion | F | I | ICLOUDY | F | I | ICLOUDY | F | I | ICLOUDY |
| 372.7 [O ii] | 35 | 35 | 74.0 | 5 | 5 | 17.0 | 65 | 73 | - |
| 396.7 [Ne iii],H7 | - | - | - | 21.6 | 22.7 | 16.0 | - | - | - |
| 410.1 H | - | - | - | 14.2 | 14.8 | 26.1 | - | - | - |
| 434.0 H | - | - | - | 34.3 | 35.3 | 47.0 | - | - | - |
| 436.3 [O iii] | 12 | 12 | 7.0 | 6.8 | 7.0 | 7.7 | - | - | - |
| 447.1 Hei | - | - | - | - | - | - | - | - | - |
| 468.6 Heii | 5.8 | 5.8 | 6.3 | 4.0 | 4.1 | 4.8 | - | - | - |
| 486.1 H | 100. | 100. | 100. | 100. | 100. | 100. | 100. | 100 | - |
| 495.9 [O iii] | 186.9 | 186.9 | 216.2 | 257.8 | 256.5 | 253. | 200.4 | 198.7 | - |
| 500.7 [O iii] | 659.5 | 659.5 | 650.1 | 788.3 | 782.0 | 761.5 | 627.8 | 619.7 | - |
| 575.5 [N ii] | - | - | - | - | - | - | - | - | - |
| 587.6 Hei | 5.8 | 5.8 | 6.8 | 20.9 | 20.0 | 19.7 | - | - | - |
| 654.8 [N ii] | 41.1 | 41.1 | 36.3 | - | - | - | 24.2 | 21.7 | - |
| 656.3 H | 284.2 | 284.2 | 280.0 | 304.9 | 285. | 281.0 | 318.6 | 285. | - |
| 658.4 [N ii] | 109.1 | 109.1 | 107.2 | 1.4 | 1.3 | 1.3 | 76.9 | 68.7 | - |
| 667.8 Hei | - | - | - | 2.5 | 2.3 | 5.6 | - | - | - |
| 671.7 [S ii] | 6.0 | 6.0 | 5.9 | - | - | - | 22.7 | 20.2 | - |
| 673.1 [S ii] | 10.1 | 10.1 | 10.1 | - | - | - | 17.2 | 15.3 | - |
| 706.5 Hei | - | - | - | 1.3 | 1.2 | 1.2 | - | - | - |
| 713.5 [Ar iii] | 4.6 | 4.6 | 4.5 | 1. | 0.9 | 0.9 | 1.6 | 1. | - |
| 0.00.02 | 0.10.04 | 0.160.05 | |||||||
| Line Fluxes | PN1 | PN2 | PN3 | PN4 | PN6 | PN7 | PN10 |
|---|---|---|---|---|---|---|---|
| 1–5 | 27 | 30 | 26 | 23 | 35 | 25 | 37 |
| 5–15 | 22 | 26 | 20 | 17 | 28 | 23 | 29 |
| 15–30 | 18 | 22 | 16 | 14 | 23 | 15 | 25 |
| 30–200 | 12 | 17 | 12 | 10 | 15 | 11 | 21 |
| 200–500 | 07 | 11 | 06 | 05 | 08 | 06 | 15 |
| 500–1000 | 05 | 7 | 05 | 03 | 05 | 04 | 09 |
| Parameter | PN1 | PN2 | PN3 | PN4 | ||||
|---|---|---|---|---|---|---|---|---|
| Empirical | cloudy | Empirical | cloudy | Empirical | cloudy | Empirical | cloudy | |
| [O iii](K) | 138002600 | 13300 | 152004000 | 15100 | 159002700 | 16300 | 92001400 | 12000 |
| [N ii](K) | - | - | - | - | - | - | 149003000 | 12000 |
| [O ii](K) | - | - | - | - | - | - | 160006000 | - |
| [S ii](cm-3) | 4700: | - | - | - | - | - | 2800600 | 3000 |
| (cm-3) | - | 5300 | - | 5000 | - | 5000 | - | 2600 |
| T⋆(K) | - | 91300 | - | 75000 | - | 110000 | - | 70000 |
| L⋆/L ⊙) | - | 2.1 | - | 2.5 | - | 2.5 | - | 3.425 |
| Rin (cm) | - | 11.9 | - | 12. | - | 12. | - | 12. |
| Rext(cm) | - | 16.6 | - | 16.9 | - | 17.4 | - | 18. |
| Parameter | PN6 | PN7 | PN10 | |||
|---|---|---|---|---|---|---|
| Empirical | cloudy | Empirical | cloudy | Empirical | cloudy | |
| [O iii](K) | 14800 | 12000 | 124003600 | 12000 | - | - |
| [S ii](cm-3) | 50001800 | - | - | - | 10035 | - |
| (cm-3) | - | 5800 | - | 5000 | - | - |
| T⋆(K) | - | 84000 | - | 71000 | - | - |
| L⋆/L ⊙) | - | 1.8 | - | 3.275 | - | - |
| Rin (cm) | - | 12. | - | 12. | - | - |
| Rext(cm) | - | 16.6 | - | 17.3 | - | - |
| PN1 | PN2 | PN3 | PN4 | PN6 | PN7 | |
| He+/H+102 | 8.61.0 | 7.51.0 | 3.80.8 | 14.92.0 | 3.41.0 | 14.02. |
| He++/H+102 | 0.88 | 0.30.1 | 1.20.5 | 0.20.1 | 0.50.2 | 0.40.2 |
| He/H102 | 9.44 | 7.81.1 | 5.01.3 | 15.12.1 | 3.91.2 | 14.42.2 |
| 12 +log(He/H) | 10.97 | 10.90.10 | 10.700.11 | 11.180.06 | 10.590.14 | 11.160.07 |
| CLOUDY | 11.1 | 11.030.23 | 10.830.17 | 11.220.14 | 10.760.22 | 11.270.15 |
| O+/H+107 | 2.9 | 4.4 | - | 57.25. | 13.7 | 5.0 |
| O++/H+105 | 9.25.4 | 9.54.7 | 7.33.3 | 8.53.6 | 8.34.3 | 20.710. |
| ICF(O) | 1.067 | 1.028 | 1.21 | 1.01 | 1.15 | 1.03 |
| O/H105 | 9.86. | 9.84.9 | 8.84.0 | 9.13.9 | 11.15. | 21.310. |
| 12 +log(O/H) | 8.00.31 | 8.00.24 | 7.940.21 | 7.950.3 | 8.040.21 | 8.320.22 |
| CLOUDY | 8.120.13 | 8.000.16 | 8.100.12 | 7.980.14 | 8.280.14 | 8.160.12 |
| N+/H+107 | 2.3 | 6.63.7 | 0.40.4 | 52.13. | 150.50. | 2.32. |
| ICF(N) | 342 | 222 | - | 15.9 | 8. | 91. |
| N/H105 | 7.8 | 14.7 | - | 8.25. | 12.2 | 2.1 |
| 12 +log(N/H) | 7.89 | 8.16 | - | 7.910.3 | 8.09 | 7.3 |
| CLOUDY | 7.4 | 7.59 | 5.7 | 7.80 | 7.95 | 7.2 |
| Ne++/H+106 | - | 6.13.0 | 1.91.0 | 6.42.9 | - | - |
| ICF(Ne) | - | 1.07 | 1.21 | 1.08 | - | - |
| Ne/H106 | - | 7.43.0 | 2.31.9 | 6.95.3 | - | - |
| 12 +log(Ne/H) | - | 6.870.20 | 6.360.51 | 6.830.30 | - | - |
| CLOUDY | - | 6.910.21 | 6.370.17 | 6.760.16 | - | - |
| S+/H+108 | 2.8 | - | 3.20.1 | 4.41.7 | 16.6 2. | - |
| S++/H+107 | - | - | - | - | - | 0.30.2 |
| ICF(S) | 4.85 | - | - | 1.44 | 2.49 | 9.5 |
| S/H107 | 24. | - | - | 6.32.3 | 44.8. | 11.73. |
| 12 +log(S/H) | 6.38 | - | - | 5.80 | 6.64 | 6.06 |
| CLOUDY | 6.56 | 4.86 | 4.28 | 5.79 | 6.54 | 5.98 |
| Ar++/H+107 | - | 0.30.2 | 0.30.2 | 1.00.3 | 1.2 1.3 | 0.7 0.4 |
| ICF(Ar) | - | 1.9 | 1.9 | 1.08 | 1.87 | 1.03 |
| Ar/H107 | - | 0.60.5 | 0.60.5 | 1.050.6 | 2.32.6 | 0.7 0.4 |
| 12 +log(Ar/H) | 4.78 | 4.78 | 5.02 | 5.36 | 4.84 | |
| CLOUDY | - | 4.86 | 4.86 | 5.07 | 5.51 | 4.96 |
| He/H | O/H | N/H | Ne/H | S/H | Ar/H | |
|---|---|---|---|---|---|---|
| PN1 | 11.1 | 8.12 0.13 | 7.4 | - | 6.56 | - |
| PN2 | 11.03 0.23 | 8.05 0.16 | 7.59 0.25 | 6.91 0.21 | 4.86 | 4.86 0.27 |
| PN3 | 10.83 0.17 | 8.10 0.12 | 5.7 | 6.37 0.17 | 4.28 | 4.86 0.23 |
| PN4 | 11.22 0.14 | 7.98 0.14 | 7.80 0.16 | 6.76 0.16 | 5.79 0.22 | 5.07 0.21 |
| PN6 | 10.76 0.22 | 8.28 0.14 | 7.95 0.20 | - | 6.54 0.26 | 5.51 0.26 |
| PN7 | 11.21 0.15 | 8.16 0.12 | 7.20 0.23 | - | 5.98 | 5.01 0.23 |
| mean | 11.02 | 8.06 | 7.70 | 6.68 | 6.35 | 5.13 |