Dust yields in clumpy SN shells: SN 1987A revisited
Abstract
We present a study of the effects of clumping on the emergent spectral energy distribution (SED) from dusty supernova (SN) shells illuminated by a diffuse radiation source distributed throughout the medium. These models are appropriate for Type II SNe older than a few hundred days, when the energy input is dominated by -rays from 56Co decay.
The fully 3D radiation transport problem is solved using a Monte Carlo code, mocassin, and we present a set of models aimed at investigating the sensitivity of the SEDs to various clumping parameters. We find that, contrary to the predictions of analytical prescriptions, the combination of an optical and IR observational data set is sufficient to constrain dust masses even in the case where optically thick clumps are present.
Using both smoothly varying and clumped grain density distributions, we obtain new estimates for the mass of dust condensed by the Type II SN 1987A by fitting the optical and infrared spectrophotometric data of Wooden et al. (1993) at two epochs (day 615 and day 775). When using amorphous carbon grains, our best fits to the observational data imply that about 2.010-4 M⊙ of dust had condensed in the envelope of SN1987A by day 615 and between 2.010-4 and 4.210-3 M⊙ by day 775. We find that the absence of a silicate emission or absorption feature in the observed mid-IR spectra implies that no more than 15% of the dust formed around SN 1987A can have been in the form of silicate particles. Our models require larger dust masses for the case of graphite grains, namely between 4.210-4 and 6.610-4 M⊙ at day 615 and between 4.510-4 and 7.510-4 M⊙ at day 775. From our numerical models we derive dust masses for SN 1987A that are comparable to previous analytic clumped graphite grain mass estimates, and at least two orders of magnitude below the 0.1–0.3 M⊙ that have been predicted to condense as dust grains in primordial core collapse supernova ejecta. This low condensation efficiency for SN 1987A is in contrast to the case of SN 2003gd, for which a dust condensation efficiency as large as 0.12 has recently been estimated.
keywords:
supernovae: individual: SN 1987A1 Introduction
The production of dust in the ejecta of core-collapse supernovae (CC-SNe) is supported by observations (Lucy et al., 1989; Bouchet & Danziger, 1993; Wooden et al., 1993; Elmhamdi et al., 2003; Sugerman et al., 2006), while theoretical studies of dust condensation in primordial CC-SNe have predicted that 0.1–0.3 of dust could be produced (Kozasa, Hasegawa & Nomoto, 1991; Todini & Ferrara, 2001). Evidence for dust formation by (at least) some SNe comes from precise isotopic abundance ratio studies of grain inclusions found in meteorites, with many (including graphite and silicon carbide inclusions) exhibiting isotopic distributions that differ significantly from those found in the Sun and Earth (e.g. Clayton, Amari & Zinner, 1997; Travaglio et al., 1999). However, direct evidence that SNe play a major role in the dust budget of galaxies is still sparse, since of the few supernovae that have been probed for dust production, most appear to have formed much less dust than predicted by models. For example, analyses of the photometric and spectroscopic evolution of SNe 1987A and 1999em from 400–800 days after outburst yielded estimates of a few of dust formed per SN (Lucy et al., 1989; Wooden et al., 1993; Elmhamdi et al., 2003), which translates into condensation efficiencies, defined here as (mass of refractory elements condensed into dust)/(mass of refractory elements in ejecta), of (Lucy et al., 1989; Woosley & Weaver, 1995). In contrast, for SNe to have produced the majority of the of dust found in high-redshift () quasars (Bertoldi et al., 2003; Maiolino et al., 2004; Robson et al., 2004; Hirashita et al., 2005), their condensation efficiency must have been around 0.2 (Morgan & Edmunds, 2003).
In the cases of both SNe 1987A and 1999em, the above investigators all separately noted that the dust masses could be significantly larger if the dust was clumped rather than distributed homogeneously throughout the ejecta. The presence of clumped dust is supported by the wavelength-independent circumstellar extinction seen in some SNe (Lucy et al., 1991; Elmhamdi et al., 2003), and by the theoretical expectation that Rayleigh-Taylor instabilities should form in post-shock ejecta (Chevalier & Klein, 1978; Herant & Woosley, 1994). Sugerman et al. (2006) confirmed this hypothesis for dust formation within SN 2003gd, by demonstrating with three-dimensional Monte-Carlo radiative transfer (RT) models that clumpy, inhomogeneous dust models can require up to an order of magnitude more mass, than implied by either analytic estimates or by homogeneous dust models, to produce a given optical extinction and mid-infrared (IR) excess. Sugerman et al. found that clumped models implied that up to of dust had formed in the ejecta of SN 2003gd by day 678, corresponding to a dust condensation efficiency of up 0.12, which is interestingly close to the efficiency of 0.2 required to match high redshift dusty sources.
Since the previous, rather low, dust mass estimates for SN 1987A were based on analytical techniques, we were therefore motivated to re-analyse the available observational data for this object using modelling techniques similar to those used by Sugerman et al. for SN 2003gd. In addition to allowing for clumped dust distributions, we also study the effects that the geometry of the medium and the spatial distribution of the luminosity source have on the emerging spectral energy distributions (SED) and, as a consequence, on dust masses determined by fitting RT models to observations. Radiative transfer in an inhomogeneous medium has been the subject of a number of studies, including the simplest approach of a two-phase medium consisting of dense clumps embedded in a less dense interclump medium (ICM). These studies employed a combination of analytical techniques and Monte Carlo modelling with dust models of varying complexity, in order to study dust in different phases of the interstellar medium (ISM) and in protogalactic and galactic environments (e.g. Natta & Panagia, 1984; Boisse, 1990; Neufeld, 1991; Hobson & Scheuer, 1993; Hobson & Padman, 1993; Witt & Gordon, 1996; Gordon, Calzetti & Witt, 1997; Wolf, Fischer, & Pfau, 1998; Városi & Dwek, 1999).
All the models presented in this work were performed using the 3D Monte Carlo RT code mocassin (Ercolano et al., 2003a; Ercolano, Barlow & Storey, 2005), which can account for both (primary and secondary) components of the radiation field in a fully self-consistent manner through absorption, re-emission and scattering of photons. This is necessary if one wants to deal with the transfer through inhomogeneous clumpy distributions, both for the case of a diffuse illuminating source distributed through the medium or for the case of a central illuminating source. Section 2 describes the basic assumptions used for the modelling, while the results of our parameter investigation are presented and discussed in Section 3. In Section 4, we readdress the issue of the mass of dust formed by SN 1987A, constraining our models primarily with the observations between 0.3 m and 30 m published by Wooden et al. (1993, hereafter W93).
2 Modelling Strategy
Using both smoothly varying and clumped grain density distributions, the 3D Monte Carlo radiative transfer (RT) code mocassin (Ercolano et al., 2003a; Ercolano, Barlow & Storey, 2005) was used by Sugerman et al. (2006) to derive the mass of dust condensed by the Type II SN 2003gd, by fitting optical (B, V, R, I) and Spitzer Space Telescope 3.6m, 4.5m, 5.8m, 8.0m, and 24m fluxes observed at two epochs (days 499 and 678 after outburst). Their results clearly showed that analytical analyses of optical and IR data, as well as RT models with smoothly varying dust density distributions, can underestimate the dust mass by an order of magnitude or more compared to models that allow for clumping. luc89; luc91 provided evidence that optically thick clumps may exist in the envelope of SN 1987A, implying that the dust mass may be underestimated by SED-based smooth density distribution models. These authors argued that amorphous part dust was required by the wavelength-dependent blueward shift of various emission lines, while clumps are required to explain the wavelength independent reddening effect of the dust. Successively, W93 summarised the evidence for significant clumping in the ejecta of SN 1987A, which was provided by observations ranging from -ray and X-ray to infrared wavelengths. We have therefore revisited the observational data for SN 1987A, employing a similar modelling strategy to that used for SN 2003gd, i.e. we assume that dust condensed in clumps within the ejecta, with the heating source distributed within the remnant shell. Our models are appropriate for Type II SNe older than a few hundred days, when the energy input is dominated by -rays from 56Co decay (Bouchet & Danziger, 1993, W93). We consider two clumping models, designed to represent the extreme cases of likely clumping behaviour: (i) the diffuse heating source is mixed with the dust grains, which are present in both the clumps and in the interclump medium (ICM); and (ii) the diffuse illumination source is confined to the virtually dust-free ICM, with all dust grains confined to the clumps. The latter model appears the most physically plausible, given that the outer C, O, and Si-rich shells, where carbonaceous and silicate grains are expected to form, should never completely mix with the inner 56Ni/56Co zone (Arnett et al., 1989). Only macroscopic mixing has been found in the clumpy ejecta of the Type II supernova remnant Cas A (Douvion, Lagage & Cesarsky, 1999), suggesting that the element layers were not homogeneously mixed. For completeness, we also consider a “smooth”, clump-free model.
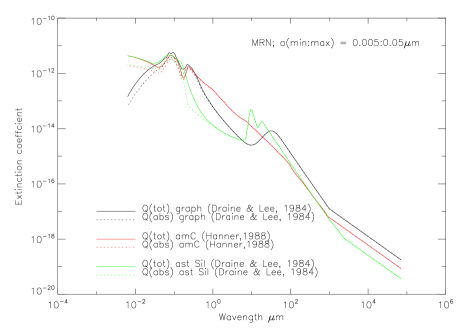
Moseley et al. (1989) reported early IR observations (day 265 and 267) and found no evidence for any emission from dust that might have formed in the SN ejecta or from pre-existing dust in the surrounding medium. A variety of observations indicated that the onset of dust formation in the ejecta of SN 1987A occurred at about day 530 (Lucy et al., 1991, W93). Given that the featureless 10-m spectrum of SN 1987A after day 530 (W93; Roche, Aitken & Smith, 1993) precludes a significant silicate contribution, the dust was assumed to be either amorphous carbon (optical constants from Hanner, 1988) or graphite (optical constants from Draine & Lee, 1984). In view of theoretical predictions that supernova grain size distributions should be relatively lacking in large particles (Todini & Ferrara, 2001), we adopted a standard (Mathis, Rumpl & Nordsieck, 1977, hereafter MRN) ISM grain size distribution, N() , but with the grain radii truncated at the upper end, such that = 0.005 m and = 0.05 m. We found however that for the models presented in Section 3, the SEDs predicted by considering a full MRN distribution versus a truncated size distribution are quite similar and that the choice of either did not affect the general results of this paper. Following our parameter investigation, we determine best fits to the W93 day 615 and day 775 spectra for all three dust configurations (smooth, Clumpy i and Clumpy ii) and in Section 4 present revised dust mass estimates for SN 1987A on days 615 and 775.
2.1 The 3D mocassin code
The 3D Monte Carlo photoionisation and dust RT code mocassin was described and benchmarked in (Ercolano et al., 2003a; Ercolano, Barlow & Storey, 2005). We used version 2.02.21 of the code in its dust-only RT mode, which allows a multi-grid resolution approach in order to increase the spatial resolution in the clumps. The radiation field is described by discrete monochromatic packets of energy (Abbott & Lucy, 1985), whose trajectories through the shell (mapped on multiple Cartesian grids) are characterised by absorption, re-emission and scattering events, according to the local medium opacities and emissivities. To ensure that energy conservation is strictly enforced at each location, all energy packets are followed until they escape the shell, contributing to the emergent SED.
The initial frequencies of the energy packets, emitted in this case by an extended diffuse source, are determined by sampling the probability density functions (PDF’s) obtained from the blackbody distribution for the temperature of the source. The total bolometric luminosity, , integrated over the diffuse source equals that of an equivalent centrally-located point source and the energy carried by each individual energy packet in unit time is simply , where is the total number of energy packets employed in the simulation.
2.2 The dust density distribution
Our models consist of a spherical shell, with inner radius , outer radius and a density profile. Two basic dust density distributions are considered: one where the density varies smoothly as and the other with dense homogeneous clumps embedded in a less dense ICM, with a density profile varying as . The clumps have radius and a volume filling factor, . The density contrast between the clumps and the ICM is defined by , where and are the clump and ICM dust densities at the inner edge of the shell. The absolute dust density in the clumps is therefore constant for all clumps, regardless of their radial distance, meaning that the density contrast with the ICM is larger at larger shell radii. Our choice to employ this model is based upon the assumption that as early as a few hours after outburst, post-shock ejecta become Rayleigh-Taylor unstable (Chevalier & Klein, 1978; Herant & Woosley, 1994), forming a clumpy distribution. The clumps would then simply move outward with the original imprint of density enhancement remaining intact. The clump positions are assigned stochastically, with the probability of a given grid cell being occupied by a clump being proportional to . The total number of clumps in a given model is controlled by the volume covering factor, , and the clump size parameter, which is kept constant at a value of = /30.
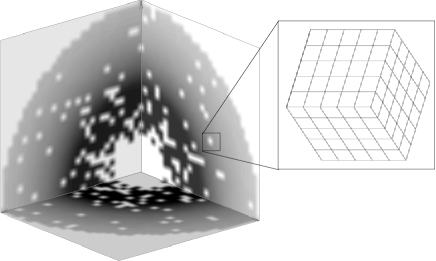
The smooth models use 613 cells to describe the SN shell, although we make use of the assumed symmetrical nature of the object and restrict our simulations to only one eighth of the total volume, reflecting the packets at the Cartesian planes (Ercolano et al., 2003b). Figure 1 shows a 3D representation of the density distribution in the clumpy models, consisting of cross-sections taken along the positive domains of the orthogonal Cartesian planes. The clumpy models also use a mother grid of 613 cells to describe the ICM, whilst each individual clump is described by a subgrid of 53 cells which occupies the volume of a mother grid cell. We experimented with higher resolution grids and subgrids and found that they had negligible consequences on our final results.
For clumpy model configurations i and ii we first vary the dominant clump parameters and show the effects of these variations on the emergent SEDs and equivalent optical depths, defined in Section 2.3 below.
2.3 The diffuse illuminating source and equivalent optical depths
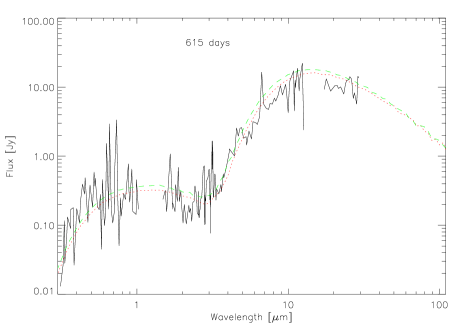
The illuminating source is adopted to have a total bolometric luminosity at day 615 (from Figure 3 of W93) radiating as a blackbody of = 7000 K. We experimented with lower blackbody effective temperatures and came to the conclusion that the observations could be best fitted by a value of Teff = 7000 K, which may be interpreted as the superposition of the 5000-5500 K optically thick ‘hot’ component and the H i bound-free continuum component identified in the W93 fits to the SN 1987A observations (their Figure 2). We also note that for the same epoch (day 616) Suntzeff & Bouchet (1990) and Bouchet & Danziger (1991) found and , respectively. However in this work, we adopt the lower luminosity value which is consistent with and returns the better fit to W93’s data, as shown in Figure 2, where we compare the SEDs obtained by identical smooth density models of day 615, but with different bolometric luminosity. The red-dotted line is for a model with model and the green-dashed line is for a model with . The input parameters for all models will be discussed in more details in the following sections. The diffuse source is distributed either throughout the medium, including in the clumps (the Clumpy i models, in which the diffuse heating source intensity follows the dust density); or located only in the ICM (the Clumpy ii models), such that each radiating cell emits a luminosity proportional to the local interclump medium density.
In the case of a SN shell illuminated by a diffuse source of radiation distributed within the shell, optical depths calculated along a line of sight from the centre of the sphere have little observational relevance. To account for the fact that the photons emitted from different locations within the shell will encounter very different opacities, we calculate the effective optical depth, , from the ratio of the emerging unattenuated flux at for the case where there is no dust present, , to the emergent flux after attenuation by dust in the shell, :
| (1) |
This method is completely independent of geometry and therefore does not require averaging along a discrete number of lines of sight; furthermore it automatically takes into account the effects of photons scattering off the grains, which increases their path lengths through the shell, thus increasing the probability of their being absorbed by dust before escaping.
3 Results: the effect of clump parameters on the emergent SEDs
3.1 Clumpy i models: diffuse heating source and dust located in both the clumps and in the ICM
In this section we present results obtained from clumpy models where both clumps and ICM radiate with luminosity proportional to the local medium density. The effects of varying the volume filling factor of the clumps, , the clump-to-ICM density ratio, , and the dust mass, on the emerging SEDs and effective optical depths of the models are illustrated in figures 3 to 5. The SEDs are plotted as dimensionless, distance- and luminosity-independent spectral shapes, or relative flux, /, versus in microns..
Figure 3 shows that increasing the volume filling factor of the clumps has dramatic effects on the effective optical depth and therefore on the emergent SEDs, for models with = 100 and the same total dust mass = 5.610, with the individual dust clumps each having a mass of 10. When = 0.05, each of these clumps has a centre-to-edge radial optical depth in the R-band of 1.22 for the amorphous carbon models. The same clumps containing graphite grains (Draine & Lee, 1984), rather than amorphous carbon grains, would have a centre-to-edge radial optical depth in the R-band of 0.46.
It is clear that an increase of the clump volume filling factor causes a decrease in the effective optical depth of the models, with less optical radiation being reprocessed at IR wavelengths. This somewhat counter-intuitive effect is in fact a direct result of the luminosity source being embedded in the clumps, so for constant and , an increase in implies a decrease in the clump dust density and thus a reduction of the optical depth through each knot, facilitating the escape of photons emitted by a given knot. This is opposite to the behaviour of models which have a central source of radiation, or ones in which only the ICM radiates, as described in the next section.
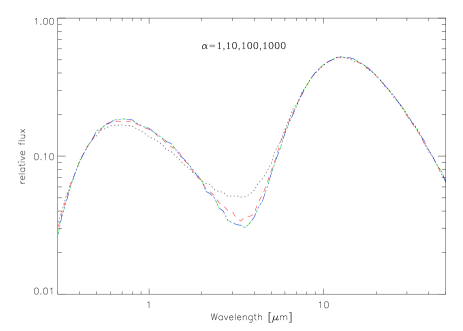
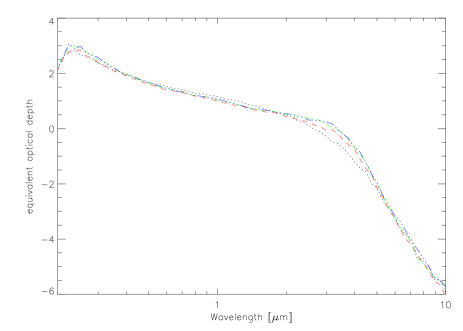
In figure 4 we show the SEDs (left panels) and the equivalent optical depths (right panels) for models with a constant = 0.05 and a total dust mass in all clumps of = 5.610, for different values of . Variations in do not appear to have large effects on the emerging SEDs, except perhaps for the = 1 model (red-dotted line), where there is no dust density enhancement in the clumps with respect to the ICM. We note, however, that the ICM dust density follows an dependency, whereas the density of the clumps stays constant with distance from the centre, implying that the clump to ICM density ratio increases as the square of the distance from the centre.
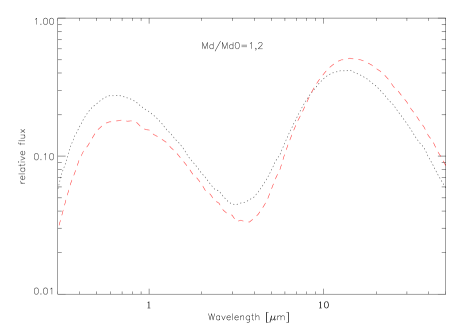
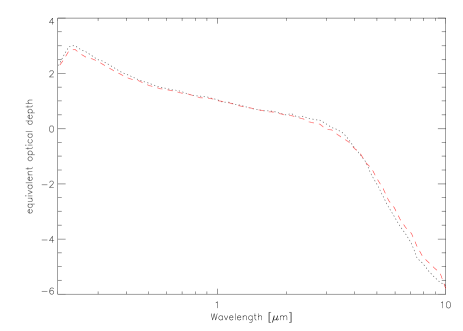
The main point is that for a model where the intensity of the diffuse heating source follows the dust density, dust grains cannot be hidden in optically thick clumps. An increase in dust mass, e.g. a factor of two, will change the optical and IR SED dramatically, as shown in figure 5, where in the left- and right-hand panels we plot the emergent SEDs and equivalent optical depths for models where and stay constant at values of 0.1 and 100, respectively, and the total dust mass varies from 510 to 110. Finally, it is clear that for these models a degeneracy exists between and total dust mass , which cannot be resolved solely by SED observations.
3.2 Clumpy ii: radiation from dust-free ICM and dust confined to clumps only
We now present the results obtained from clumpy models ii having exactly the same clump distribution as for i, but this time assuming that dust is only present in the clumps and that the luminosity source is only embedded in the ICM. The parameter tends to infinity for these models, so we only investigate the effects of varying and on the emerging SEDs and equivalent optical depths.
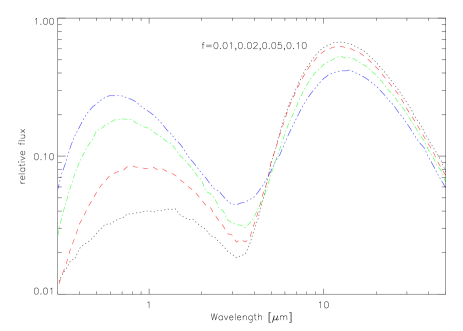
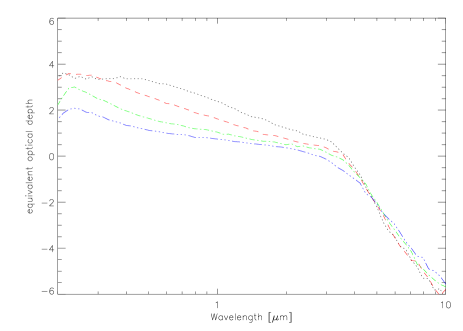
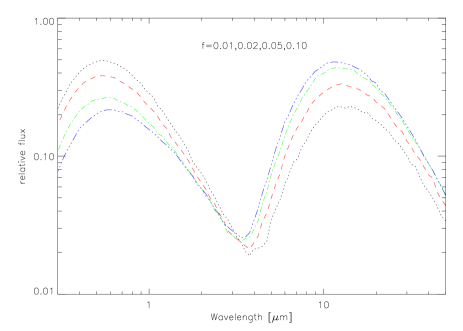
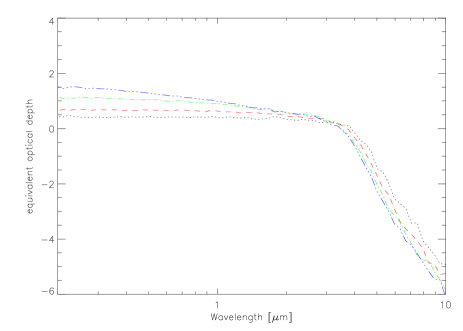
The left and right panels of figure 6 show the SEDs and equivalent optical depths corresponding to models with constant total dust mass = 3.510 and = 0.01 (black, dotted), 0.02 (red, dashed), 0.05 (green, dash-dot) and 0.1 (blue, dash-dot-dot). The left and right panels of figure 7 show the SEDs and equivalent optical depths corresponding to models with constant = 0.1 and between . For the reference model, with = 0.1 and and = 3.510, each clump has a mass of 3.510 and a centre-to-edge radial optical depth in the V-band of 1.33 and 0.41, for the amorphous carbon and graphite models, respectively.
It is clear from figure 6 that directly controls the effective optical extinction, i.e. the amount of radiation intercepted by the clumps and reprocessed at IR wavelengths. The behaviour of the SEDs and equivalent optical depths here is the same as for a centrally located source and opposite to that shown by the Clumpy i models where the heating radiation is emitted within both clumps and ICM.
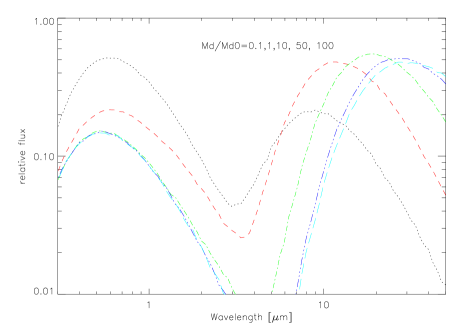
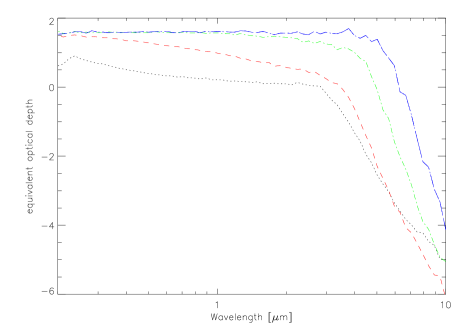
In the current case of a dust-free ICM with the dust confined to clumps, for optically thick clumps the equivalent optical depth in the visual region is governed only by the covering factor of the clumps, which determines the amount of radiation intercepted by the clumps. This would imply that the actual dust mass in the clumps would be unconstrained by the measured extinction in the optical and that virtually unlimited amounts of dust could be hidden in optically thick clumps. This is apparent in figure 7, where it can be seen that the models with 10, 50 and 100 3.510 show the same SED between 0.3m and 2m. However the quantity of dust in the clumps still has a significant effect on the grain temperature distribution and therefore on the appearance of the SED at IR wavelengths. The larger the dust mass for a given , the cooler the average grain temperature and therefore the greater the shift of the reprocessed radiation peak to longer wavelengths.
So, for the Clumpy ii case the total dust mass is not unconstrained, even when the clumps are optically thick. If both optical and IR observational data are available, it appears that the best modelling strategy for optically thick clumps, when segregation between the dust and the heating source is assumed, is (i) to start with a large dust mass (enough for the clumps to be optically thick in the visual region) and to vary until a fit is achieved for the optical part of the SED; (ii) keeping fixed, to vary the dust mass until a fit to the IR part of the SED is also achieved. If the dust mass is reduced to the point where the optical SED starts changing again, this implies that the clumps are becoming optically thin. This may be acceptable, or one may try a lower covering factor and restart the fitting process.
4 SN 1987A revisited
| Day 615 | Day 775 | |||||
| 5.7 | 1.6 | |||||
| 7000 | 7000 | |||||
| cm | 5 | 5.7 | ||||
| 2 | 2 | |||||
| Amorphous Carbon | Smooth | Clumpy i | Clumpy ii | Smooth | Clumpy i | Clumpy ii |
| – | 100 | – | 100 | |||
| – | 0.05 | 0.1 | – | 0.03 | 0.3 | |
| 7 | 5 | 5 | 7 | 5 | 5 | |
| 2.0 | 2.0 | 2.2 | 3.0 | 2.0 | 4.2 | |
| 1.6 | 1.4 | 1.5 | 1.8 | 2.0 | 1.6 | |
| (clump) | – | 2.2 | 1.2 | – | 2.8 | 0.60 |
| Graphite | Smooth | Clumpy i | Clumpy ii | Smooth | Clumpy i | Clumpy ii |
| – | 100 | – | 100 | |||
| – | 0.05 | 0.1 | – | 0.03 | 0.3 | |
| 7 | 5 | 5 | 4 | 5 | 4 | |
| 4.2 | 6.5 | 6.6 | 4.5 | 6.5 | 7.5 | |
| 1.3 | 1.5 | 1.4 | 2.4 | 2.1 | 1.5 | |
| (clump) | – | 2.5 | 1.2 | – | 3.3 | 0.89 |
Taking into account the results presented above, we now derive revised dust mass estimates for SN 1987A. Our analysis is based on model fits to the 0.3–30 m spectrophotometry from days 615 and 775 published in figures 1 and 2 of W93, which were digitised using the Dexter tool provided by the NASA ADS, then dereddened using the Mathis (1990) extinction law, scaled to fit the extinction measured toward SN 1987A in Scuderi et al. (1996). Our models are also required to match the optical extinction of the SN, which was first shown to increase with time by Lucy et al. (1991). However, as discussed in Sugerman et al. (2006), the method adopted by Lucy et al. (1991) to measure the dust extinction from the broad-band light curves is likely to have significantly underestimated the and -band values.
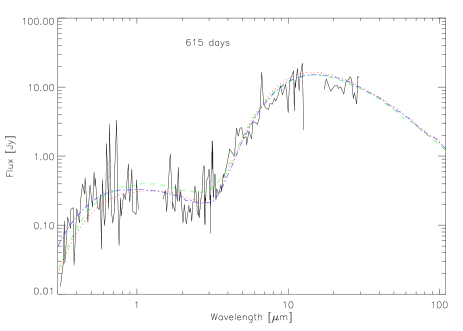
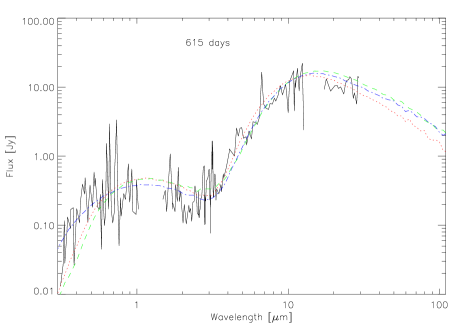
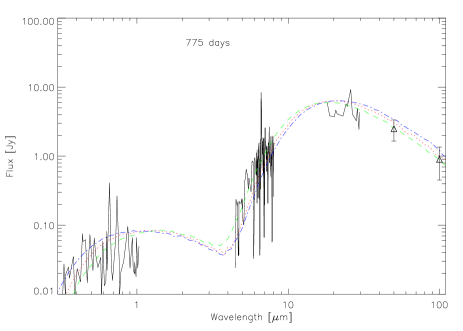
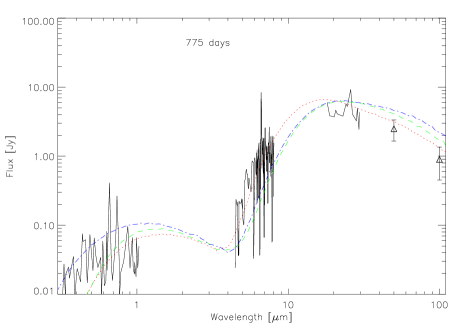
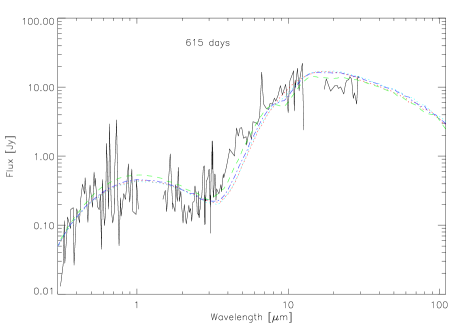
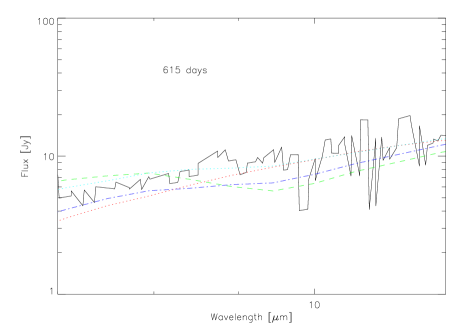
Our smooth density distribution and our Clumpy ii models for day 615 (red dotted and blue dash dot lines in Figure 8 for amorphous carbon and Figure 9 for graphite) both fit the IR and optical SED of SN 1987A quite well – the smooth density distribution graphite model (Figure 8) provides a somewhat better fit to the 20-m spectrophotometry than the clumped models, but at the expense of under-predicting the flux level in the short wavelength optical region. The effective extinction predicted by our Clumpy ii models for day 615 is A(U) = 1.69, A(B) = 1.66, A(V) = 1.61, A(R) = 1.54 and A(I) = 1.48, for amorphous carbon grains and A(U) = 1.64, A(B) = 1.54, A(V) = 1.44, A(R) = 1.38 and A(I) = 1.31, for graphite grains. Although our absolute values are larger than those reported by Lucy et al. (1991) – see discussion in Sugerman et al. (2006) about the extinction being underestimated by the method adopted by Lucy et al. (1991) –, the slope of the computed extinctions is in agreement with the results of Lucy et al. (1991), who noted that the empirical extinctions were rather flat in the optical. Our day 615 Clumpy i models, whilst providing satisfactory fits to the IR SED, provides a poorer match in the optical region. For the day 775 observations (Figure 10 for amorphous carbon and Figure 11 for graphite), the smooth and Clumpy i models produce too much extinction at the shorter optical wavelengths, particularly for the graphite case.
All inputs for our models are listed in Table 1, where we also summarise our dust mass estimates, R-band model extinctions and the R-band radial centre-to-edge extinction within an individual clump.
The day 615 smooth density distribution amorphous carbon model requires a total dust mass of 2.010-4M⊙, while the amorphous carbon dust masses derived from our Clumpy i and Clumpy ii models are the same within the uncertainties, 2.010-4M⊙ and 2.210-4M⊙, respectively. Our graphite grain models require approximately 3 times more mass to fit the SED of SN 1987A than do our amorphous carbon models, due to the significantly lower optical to mid-IR absorption coefficients of Draine & Lee (1984) graphite compared to Hanner (1988) amorphous carbon (see Figure 12). Our smooth density distribution graphite model requires a dust mass of 4.210-4M⊙, a factor of 10 higher than estimated by W93 for day 615 using their simple large-grain analytic model. Our Clumpy i and ii graphite models both require 6.510-4M⊙, factor of two larger than derived by W93 for day 615 using an analytical clumpy model with graphite absorption coefficients.
For day 775, our smooth density distribution amorphous carbon model requires a dust mass of 3.010-4M⊙, while our Clumpy i and Clumpy ii models require 2.010-4M⊙ and 4.210-4M⊙, respectively. Our smooth, Clumpy i and Clumpy ii graphite models (Fig. 11) require masses of 4.510-4M⊙, 6.510-4M⊙ and 7.510-4M⊙ respectively to fit the day 775 SN 1987A data. The day 775 smooth density distribution amorphous carbon and graphite models both provide better fits to the observed SEDs landwards of 20 m than do the clumpy models, but both of the smooth density distribution models fail to match the observed flux level in the short wavelength optical region. The IR spectrum seems to be too sharply peaked at short wavelengths to be fitted with simple models. The residuals are also broader than typical atomic line widths, which could be interpreted as evidence for solid-state features in the dust –possibly stochastically heated–, as discussed Bouchet et al., 2004. Our smooth density distribution graphite mass estimate is 7 times larger than W93’s analytic large-grain estimate for this epoch, while our Clumpy i and Clumpy ii graphite grain mass estimates are factors of 1.3–1.5 larger than W93’s analytic clumpy model estimate of 5.010-4M⊙ for graphite grains. Dwek et al. (1992) also estimated a dust mass of 510-4M⊙ for the ejecta of SN 1987A, based on fitting a 150 K modified blackbody to day 1144 IR photometric data. Although their estimate is somewhat uncertain, due to the small number of photometric points in the mid-IR region, it does indicate that the mass of dust in the ejecta of SN 1987A did not increase significantly after day 775. Furthermore, Bouchet (2004) presented mid-IR imaging of SN 1987A and reported, in particular, the detection of the SN ejecta in the N-band. They concluded that their measurements imply a dust temperature in the 90–100 K range, and a mass range of , again ruling out a significant variation in dust mass between day 775 and day 6067. Our own dust mass estimates in Table 1 imply that for the graphite models the total dust mass hardly increased between days 615 and 775. Finally, Bouchet et al. (2004) detected mid-IR silicate emission from the circumstellar ring that is believed to have been produced by mass loss by the progenitor star of SN 1987A. This ring is responsible for most of the present-day mid-IR emission, but Bouchet et al. (2004) showed that this contribution started after day 4200 only, and therefore does not affect the present findings.
We also made estimates for the circumstellar extinction in the envelope of SN 1987A at late epochs in order to constrain our models. For this we used the methods described in greater detail by Sugerman et al. (2006) for the case of SN 2003gd. Using the photometric data of Hamuy & Suntzeff (1990) for days 1-813 and Caldwell et al. (1993) thereafter, we estimated the circumstellar R-band extinction of SN 1987A at days 615 and 775 by comparing the observed level of the light curve at those epochs to that expected for a light curve powered purely by the decay of 56Co that had been normalised to the photometric data obtained earlier than day 400. This yielded ’s of 1.7 and 2.4 magnitudes at days 615 and 775, respectively. A somewhat more conservative estimate of the circumstellar extinction can be obtained if we assume that the intrinsic light curve has contributions from other sources of decay, such as 57Co, and also allow for the decreasing opacity of the envelope to the gamma rays that power the light curve. This yielded ’s of 1.2 and 1.6 magnitudes at days 615 and 775, respectively. Corresponding estimates for the R-band circumstellar extinction produced by the models were obtained by comparing the R-band flux levels obtained with and without dust. Inspection of Table 1 (final row for each model) shows that all of our day 615 models satisfy the = 1.2–1.7 observational constraint. For the case of our day 775 models the predicted range is 1.5–2.4, which can be compared to our estimated observational constraint of = 1.6–2.4.
For Clumpy i amorphous carbon or graphite models, the derived day 615 and day 775 dust masses are the same, while the inner radius for the day 775 models is 5.7/5.0 times larger than for day 615. Yet the day 775 models yield higher ’s than the day 615 models. The equivalent optical depth increase from day 615 to 775 is due to the fact that for the volume filling factor to decrease from 5 to 3% whilst keeping the same dust mass , the dust number density in each individual clump must increase, hence making it harder for radiation produced in the internal regions of the clumps to escape. The decrease of the clump covering factor from day 615 to 775 is physically justified under the assumption that no clumps and no extra dust condensed between day 615 to day 775. If this were true then the expansion of the inner radius from 51015cm to 5.71015cm would imply a decrease of the volume covering factor from = 0.05 to = 0.034. However, best fit of the SED implies = 0.03, causing therefore the increase of from 1.4 to 2.0 reported in Table 1.
The behaviour of Clumpy ii models is somewhat different; the volume filling factor here has to increase from 0.1 to 0.3 in order to fit the decrease of the SED in the optical from day 615 to day 775. As discussed in Section 3.2, once the clumps become optically thick, the only factor affecting the optical SED is , with the main effect of varying the dust mass being on the temperature of the grains and therefore on the IR emission. In this model the total dust mass also increases between the two epochs, implying that as new grains form new clumps also form. An alternative interpretation is that clumps form early on by Rayleigh-Taylor instabilities in the explosion, and remain imprinted in the ejecta. The increase in dust mass, might therefore be due to additional accretion.
Our dust mass estimates are dependent on the assumed dust chemistry. As shown in Figure 12, amorphous carbon grains with Hanner (1998) optical constants have higher absorption coefficients per unit mass in the optical and near-IR than either astronomical graphite or silicate grains with Draine & Lee (1984) optical constants. The amorphous carbon models therefore require the least mass to fit the observed SEDs of SN 1987A. Graphite models require between 2 and 3 times as much mass to provide a fit. Silicate-only models would require even larger dust masses, due to their even lower optical and near-IR absorption coefficients; however pure silicate models are ruled out for SN 1987A by the lack of detectable 10- and 18-m silicate emission or absorption features in any of the mid-IR spectra of SN 1987A (W93; Roche et al. 1993; Bouchet & Danziger 1993).
After day 530, the emission-line strengths of [Si i] 1.65m, [Mg i] 4571Å, and [O i] 6300Å decreased significantly (Lucy et al., 1991; Bouchet & Danziger, 1993), consistent with the formation of some fraction of silicate dust. We therefore tried a number of mixtures of astronomical silicates and graphite. Figure 13 shows fits to the day 615 W93 data obtained with our Clumpy ii model using 50% : 50% (green dash-dot line), 25% : 75% (blue dash-dot line) and 15% : 85% (cyan dash-dot-dot line) astronomical silicate : graphite mixtures, all with masses of 1.310-3M⊙ (red dotted line), i.e. twice as large as for the Clumpy ii graphite model. The 50% : 50% silicate:graphite and 25% : 75% mixtures produce too strong 10- and 18-m silicate absorption features compared to the observational limits. However, the 15% : 85% silicate:graphite model produces a smooth enough mid-IR spectrum to be consistent with the observations.
Due to the high optical absorption coefficients of amorphous carbon grains, the Clumpy ii day 615 amorphous carbon mass estimate of 2.210-4 M⊙ (Table 1) is likely to represent a lower limit to the total mass of dust that condensed in the ejecta of SN 1987A, while the mixed silicate:graphite mass of 1.310-3 M⊙, discussed in the previous paragraph, probably represents close to an upper limit. Iron grains have optical absorption coefficients in the optical that are intermediate between those of astronomical graphite and silicate, while lacking the strong infrared features that eliminate silicate-only models. However, direct observational evidence for iron grains in circumstellar or interstellar environments is still lacking.

Figure 15 shows a comparison between the day 678 optical-IR spectrum of SN 2003gd (Sugerman et al., 2006) and the day 615 and day 775 spectra of SN 1987A (W93), after scaling to a common distance of 51 kpc. It shows similarities between their SEDs in the optical and 16–30-m regions, but differences in the 3–8-m region. The day 678 clumpy model for SN 2003gd (Sugerman et al., 2006), required a dust mass that is 13 times higher than the maximum mass allowed for mixed graphite:silicate models of SN 1987A and 27 times higher than our day 775 Clumpy ii pure graphite mass estimate for SN 1987A. The main reason for this difference is the very different opacities of the dust mixtures required to fit the SEDs of the two SNe; in the case of SN 2003gd, a dust mixture composed of 15% amorphous carbon and 85% astronomical silicates provided the best fit (Sugerman et al., 2006), while the maximum silicate mass fraction allowed for SN 1987A is only 15%, due to its featureless mid-IR spectrum at late epochs. Astronomical silicates are much more transparent to optical and near-IR radiation than are amorphous carbon or graphite grains, and therefore require larger dust masses to match a given SED. Furthermore, the much higher optical albedos of silicate grains allows much larger masses to be inside clumps, for similar levels of IR emission, though the silicate 10-m feature should be present in emission or absorption (mainly the latter). We note that models containing only carbon grains did not provide a good fit to the day 499 optical-IR spectrum of SN 2003gd, producing too much emission in the 2–10-m region.
The model fits imply that the proportions of silicates and carbon grains were reversed in SN 1987A and SN 2003gd. The mass of the immediate progenitor of SN 2003gd is estimated to have been 8 M ⊙ (Van Dyk, Li, & Filippenko, 2003; Smartt et al., 2004), while the mass of Sk –69 202, the progenitor of SN 1987A, is estimated to have been 20 M⊙ (Arnett et al., 1989). Nucleosynthetic calculations show that although large masses of oxygen should be produced by high mass supernovae, below 20 M ⊙ the yield of oxygen from the O-rich zone can drop below the yield of carbon from the C-rich zone (Arnett et al., 1989; Woosley & Weaver, 1995), although the results are highly sensitive to details of some of the adopted reaction rates (Arnett, 1996). Irrespective of this, Clayton, Liu & Dalgarno (1999) and Deneault, Clayton & Heger (2006) have shown that due to the destruction by ionizing particles of CO, and the consequent disruption of the normal CO sink for carbon atoms in oxygen-rich regions, large quantities of carbon-rich dust particles can form easily in SN ejecta zones that have C/O1. What remains to be elucidated is what causes either silicate or carbon grains to dominate the dust produced by particular supernovae.
5 Discussion
We have studied the effects of a number of clumping parameters on the SEDs emerging from two geometrical configurations, consisting of a spherical shell of clumpy medium illuminated by a diffuse radiation source. Clumpy i models assume full mixing between the dust and the radiating medium, while Clumpy ii models assume that dust is only present in the clumps and the illuminating radiation comes only from the ICM.
The main conclusions that can can be drawn from our parameter investigation can be summarised as follows:
-
1.
varying the volume filling factor, has opposite effects in Clumpy i and Clumpy ii models. For a constant dust mass, and clump to ICM ratio, , an increase in in Clumpy i models causes a decrease in the effective optical depth, with less optical radiation being reprocessed at IR wavelengths. In Clumpy ii models directly controls the amount of optical radiation being intercepted by the dust, since the illumination source is always external of the clumps. This is the same behaviour shown by centrally illuminated shell models.
-
2.
in the range explored, variations of in Clumpy i models (constant and constant ) have only a minor impact on the emerging SEDs.
-
3.
for models where the emitting source is intermixed with the dusty medium, dust grains cannot be hidden in optically thick clumps. For these models a degeneracy exists between and which may not be resolved with IR SED observations alone.
-
4.
for Clumpy ii models with optically thick clumps, an increase in results in cooler grains which will therefore radiate at longer IR wavelengths.
We used both smoothly varying and clumped dust density distributions to obtain new estimates for the mass of dust condensed by the Type II SN 1987A by fitting the 0.3-30m spectrophotometric data of Wooden et al. (1993) at two epochs (day 615 and day 775). From our modelling we conclude that between 2 and 1.3 M⊙ of mainly carbon-based grains had formed in the ejecta by day 615 (4–7 M⊙) for pure graphite models) with the derived dust masses being found to be independent of whether the dust was clumped or not. This result differs from the conclusions of W93, who derived unclumped graphite dust masses of 4–6 M⊙ on days 615 and 775, versus graphite masses from their analytic clumped dust modelling of 3–5 M⊙. The latter values are close to our own clumped graphite dust mass estimates from Monte Carlo modelling. For a 20 M⊙ SN progenitor, between 0.3–0.4 M⊙ of refractory elements are expected to form (Woosley & Weaver 1995), so the estimate of 2 to 1.3 M⊙ of new dust formed in the ejecta of SN 1987A corresponds to a condensation efficiency of only 5 to 4, significantly lower than the dust condensation efficiency of 0.12 estimated for SN 2003gd by Sugerman et al. (2006). The cause of such very different dust yields amongst Type II core-collapse supernovae remains to be explained.
Acknowledgments: We are grateful to Dr. P. Bouchet, the referee, for helpful and constructive comment. BS acknowledges support from HST grant 10607 and SST grant 20320.
References
- Abbott & Lucy (1985) Abbott D. C., Lucy L. B., 1985, ApJ, 288, 679
- Arnett (1996) Arnett, D. 1996, Supernovae and Nucleosynthesis, Princeton: Princeton University Press, p. 302
- Arnett et al. (1989) Arnett W. D., Bahcall J. N., Kirshner R. P., Woosley S. E., 1989, ARA&A, 27, 629
- Bertoldi et al. (2003) Bertoldi F., Carilli C. L., Cox P., Fan X., Strauss M. A., Beelen A., Omont A., Zylka R., 2003, A&A, 406, L55
- Boisse (1990) Boisse P., 1990, A&A, 228, 483
- Bouchet (2004) Bouchet, P., De Buizer, J. M., Suntzeff, N. B., Danziger, I. J., Hayward, T. L., Telesco, C. M., Packham, C., 2004, ApJ, 611, 394
- Bouchet & Danziger (1993) Bouchet P., Danziger I. J., Lucy L. B., 1991, AJ, 102, 1135
- Bouchet & Danziger (1991) Bouchet P., Danziger I. J., 1993, A&A, 273, 451
- Caldwell et al. (1993) Caldwell et al., 1993, MNRAS, 262, 313
- Cernuschi, Marsicano, & Kimel (1965) Cernuschi F., Marsicano F. R., Kimel I., 1965, AnAp, 28, 860
- Chevalier & Klein (1978) Chevalier R. A., Klein R. I., 1978, ApJ, 219, 994
- Chevalier & Emmering (1989) Chevalier R. A., Emmering R. T., 1989, ApJ, 342, L75
- Clayton, Amari & Zinner (1997) Clayton D. D., Amari S., Zinner E., 1997, ApSS, 251, 355
- Clayton, Liu & Dalgarno (1999) Clayton D. D., Liu W., Dalgarno A., 1999, Science, 283, 1290
- Deneault, Clayton & Heger (2006) Deneault E. A.-N., Clayton D. D., Heger A., 2006, ApJ, 594, 312
- Douvion, Lagage & Cesarsky (1999) Douvion T., Lagage P. O., Cesarsky C. J., 1999, A&A, 352, L111
- Draine & Lee (1984) Draine B. T., Lee H. M., 1984, ApJ, 285, 89
- Dwek (1988) Dwek E., 1988, ApJ, 329, 814
- Dwek et al. (1992) Dwek E., Moseley S. H., Glaccum W., Graham J. R., Loewenstein R. F., Silverberg R. F., Smith R. K., 1992, ApJ, 389, L21
- Elmhamdi et al. (2003) Elmhamdi A., et al., 2003, MNRAS, 338, 939
- Elvis, Marengo & Karovska (2002) Elvis M., Marengo M., Karovska M., 2002, ApJ, 567, L107
- Ercolano et al. (2003a) Ercolano B., Barlow M. J., Storey P. J., Liu X.-W., 2003, MNRAS, 340, 1136
- Ercolano et al. (2003b) Ercolano B., Morisset C., Barlow M. J., Storey P. J., Liu X.-W., 2003, MNRAS, 340, 1153
- Ercolano, Barlow & Storey (2005) Ercolano B., Barlow M. J., Storey P. J., 2005, MNRAS, 362, 1038
- Gordon, Calzetti & Witt (1997) Gordon K. D., Calzetti D., Witt A. N., 1997, ApJ, 487, 625
- Hamuy & Suntzeff (1990) Hamuy M., Suntzeff N. B., 1990, AJ, 99, 1146
- Hanner (1988) Hanner M. S., 1988, NASA Conf. Publ., 3004, 22
- Harvey et al. (1989) Harvey P., Lester D., Dinerstein H., Smith B., Colome C., 1989, BAAS, 21, 1215
- Herant & Woosley (1994) Herant M., Woosley S. E., 1994, ApJ, 425, 814
- Hines et al. (2004) Hines D. C., et al., 2004, ApJS, 154, 290
- Hirashita et al. (2005) Hirashita H., Nozawa T., Kozasa T., Ishii T. T., Takeuchi T. T., 2005, MNRAS, 357, 1077
- Hobson & Padman (1993) Hobson M. P., Padman R., 1993, MNRAS, 264, 161
- Hobson & Scheuer (1993) Hobson M. P., Scheuer P. A. G., 1993, MNRAS, 264, 145
- Kozasa, Hasegawa & Nomoto (1991) Kozasa T., Hasegawa H., Nomoto K., 1991, A&A, 249, 474
- Krause et al. (2004) Krause O., Birkmann S. M., Rieke G. H., Lemke D., Klaas U., Hines D. C., Gordon K. D., 2004, Natur, 432, 596
- Lucy et al. (1989) Lucy L. B., Danziger I. J., Gouiffes C., Bouchet P., 1989, in IAU Colloq. 120, Structure and dynamics of the interstellar medium, ed. G. Tenorio-Tagle, M. Moles, J. Melnick, Springer-Verlag, 164
- Lucy et al. (1991) Lucy L. B., Danziger I. J., Gouiffes C., Bouchet P., 1991, in Supernovae, ed. S. E. Woosley, Springer-Verlag, 82
- Maiolino et al. (2004) Maiolino R., Schneider R., Oliva E., Bianchi S., Ferrara A., Mannucci F., Pedani M., Roca Sogorb M., 2004, Natur, 431, 533
- Mathis (1990) Mathis J. S., 1990, ARA&A, 28, 37
- Mathis, Rumpl & Nordsieck (1977) Mathis J. S., Rumpl W., Nordsieck K. H., 1977, ApJ, 217, 425
- Morgan & Edmunds (2003) Morgan H. L., Edmunds M. G., 2003, MNRAS, 343, 427
- Moseley et al. (1989) , 1989, ApJ, 347, 1119
- Natta & Panagia (1984) Natta A., Panagia N., 1984, ApJ, 287, 228
- Neufeld (1991) Neufeld D. A., 1991, ApJ, 370, L85
- Robson et al. (2004) Robson I., Priddey R. S., Isaak K. G., McMahon R. G., 2004, MNRAS, 351, L29
- Roche, Aitken & Smith (1993) Roche P. F., Aitken D. K., Smith C. H., 1993, MNRAS, 261, 522
- Scuderi et al. (1996) Scuderi S., Panagia N., Gilmozzi R., Challis P. M., Kirshner R. P., 1996, ApJ, 465, 956
- Smartt et al. (2004) Smartt S. J., Maund J. R., Hendry M. A., Tout C. A., Gilmore G. F., Mattila S., Benn C. R., 2004, Sci, 303, 499
- Sugerman et al. (2006) Sugerman B. E. K., et al., 2006, Sci, 313, 196
- Suntzeff & Bouchet (1990) Suntzeff N. B., Bouchet P., 1990, AJ, 99, 650
- Todini & Ferrara (2001) Todini P., Ferrara A., 2001, MNRAS, 325, 726
- Travaglio et al. (1999) Travaglio C., Gallino R., Amari S., Zinner E., Woosley S., Lewis R. S., 1999, ApJ, 510, 325
- Van Dyk, Li, & Filippenko (2003) Van Dyk S. D., Li W., Filippenko A. V., 2003, PASP, 115, 1289
- Városi & Dwek (1999) Városi F., Dwek E., 1999, ApJ, 523, 265
- Weingartner & Draine (2001) Weingartner J. C., Draine B T., 2001, ApJ, 548, 296
- Witt & Gordon (1996) Witt A. N., Gordon K. D., 1996, ApJ, 463, 681
- Wolf, Fischer, & Pfau (1998) Wolf S., Fischer O., Pfau W., 1998, A&A, 340, 103
- Wooden et al. (1993) Wooden D. H., Rank D. M., Bregman J. D., Witteborn F. C., Tielens A. G. G. M., Cohen M., Pinto P. A., Axelrod T. S., 1993, ApJS, 88, 477
- Woosley & Weaver (1995) Woosley S. E., Weaver T. A., 1995, ApJS, 101, 181
- Woosley et al. (1989) Woosley S. E., Hartmann D., Pinto P. A., 1989, ApJ, 346, 395