Simultaneous radio/X-ray observations of Cir X-1
Abstract:
We present a partial analysis of a multi-wavelength study of the X-ray binary Cir X-1, a system harboring the most relativistic outflow in our galaxy so far. The data were taken (almost) simultaneously in radio and X ray during a survey carried out in October 2000 and December 2002. Cir X-1 was observed at the radio frequencies of 4.8 and 8.6 GHz with the Australia Telescope Compact Array (ATCA). In the X-ray spectral domain we used the Rossi X-Ray Timing Explorer (RXTE). We found strong evidence for flaring activity in radio not only at the periastron but also at the apoastron passages. A comparison of our data against different correlations between radio and X ray found in other neutron star systems shows that Cir X-1 does not seem to follow the general trend. However, the fact that Cir X-1 is an ‘exotic’ X-ray binary makes any interpretation more complicated.
1 Introduction
Cir X-1 is a very unusual neutron star X-ray binary system with a changing behaviour mimicking both a Z and an Atoll source. It undergoes outbursts at X-ray, infrared and radio wavelengths with a period of 16.6 days. While the radio flares reached up to 1 Jy in the late 1970s, they have only been observed at the tens of mJy level ever since (e.g. [1]). A secular tendency toward lower emission rates in the 2-10 keV band is also evident in X rays in the last decade (e.g. [2]). The binary lies within an arcmin scale synchrotron nebula and seems to harbor the most relativistic outflow observed in our galaxy so far [3].
2 Observations
We observed simultaneously or quasi-simultaneously ( hours delay) Cir X-1 in radio and X rays for several days in 2000 October and 2002 December. The radio data, at 4.8 and 8.6 GHz, were acquired using the Australia Telescope Compact Array (ATCA). In the X-ray domain we made use of the Rossi X-Ray Timing Explorer (RXTE). Table 1 presents the epoch of observations together with the corresponding orbital phases as calculated using the radio ephemeris from [4].
3 Results
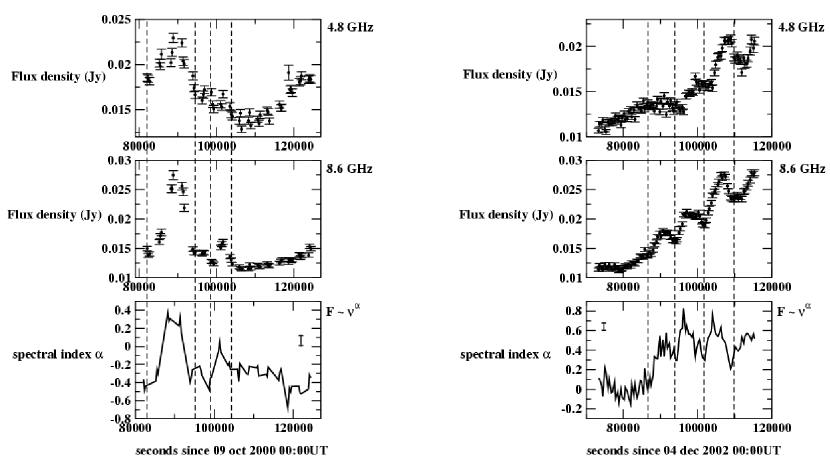
Behavior of the radio flares. The 16.6 days periodic outbursts of Cir X-1 are interpreted as enhanced accretion near the periastron passage. As expected, we observed an increase in the radio flux densities near the orbital phase . But in addition, in our data set, both of the observations near phase (2000 October 09/10 and 25/26) show strong evidence for flaring activity of comparative magnitude as at . The radio variability is at time-scales of hours and the spectrum changes dramatically during the flares, with a clear tendency towards flattening on the rising phase of the flare and steepening afterward.
| Epoch | Phase |
|---|---|
| 2000 Oct 01 | 0.93 |
| 2000 Oct 07/08 | 0.36 |
| 2000 Oct 09/10 | 0.48 |
| 2000 Oct 14/15 | 0.78 |
| 2000 Oct 19 | 0.02 |
| 2000 Oct 20/21 | 0.14 |
| 2000 Oct 23 | 0.26 |
| 2000 Oct 25/26 | 0.45 |
| 2002 Dec 02/03 | 0.88 |
| 2002 Dec 03/04 | 0.94 |
| 2002 Dec 04/05 | 0.01 |
| 2002 Dec 05/06 | 0.07 |
| 2002 Dec 06/07 | 0.13 |
| 2002 Dec 07/08 | 0.19 |
| 2002 Dec 08/09 | 0.25 |
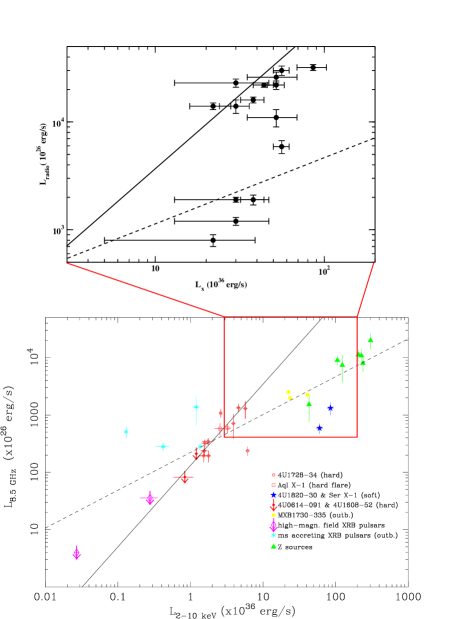
Radio and X-ray luminosities. In [5] the authors studied the correlation between radio
and X-ray luminosities of neutron star X-ray binaries. In Fig.2 we added the data on Cir X-1 to
their sample. The radio luminosities () were determined at 8.6 GHz from the ATCA data set,
while the X-ray
luminosities were calculated using the RXTE/ASM measurements in the 2-10 keV band. During 2002
December, Cir X-1 was weaker in radio than in 2000 October, with luminosities
erg/s (except for the two epochs near =0.0, December 04/05 and December 05/06).
In 2000 October, the luminosities were always higher than erg/s.
Radio luminosity and X-ray timing. We created power density spectra (PDSs) from the X-ray data from segments of 128 s using fast Fourier transform techniques (e.g.[6]), averaged them together, subtracted the background, and fitted them with a multi-Lorentzian model. The frequencies quoted throughout are the frequencies at which the Lorentzian contributes most of its power: , where is the centroid frequency of the Lorentzian (e.g. [7]). The spectra from 2002 December 02/03 and 03/04 were featureless and therefore not accounted for in Fig.3 (the appearance of PDSs of Cir X-1 depends on the orbital phase and “position” in the hardness-intensity diagram; e.g. [8]). In identifying the quasi-periodic oscillations (QPOs) in the PDSs, for practical reasons, we adopt the terminology for Atoll sources (e.g. [7]). Namely, we designate the QPOs in the 1-50 kHz range as the low-frequency QPOs, . Previously, it was observed that the corresponding frequency shifts towards higher values with increasing orbital phase (e.g. [9]). PDSs averaged on data partitioned in blocks of a few hours near =0.0 and =0.5 (i.e.2000 October 09/10, 19, 20/21 and 25/26), show significant shifts in the and variations of rms at timescales of hours (the points are embedded in ellipses in Fig.3). Similar behaviour is observed for other orbital phases, but the changes are of a smaller magnitude. Whether this is real or an artifact is under investigation. We further show in Fig.3 the correlations between the luminosity in radio and rms and found in [10] in “well-behaved” neutron star X-ray binaries. Clearly, Cir X-1 does not follow the trend.
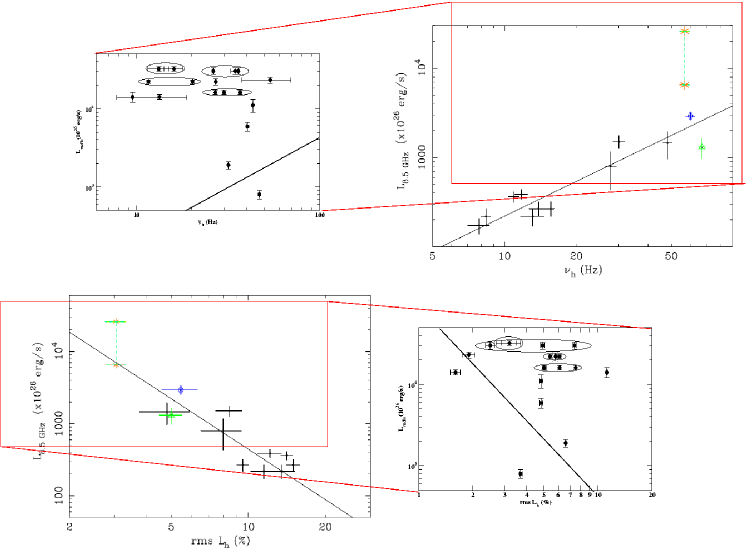
One way to explain the ‘anomalous’ behaviour of Cir X-1 presented in Figs. 2 and 3 could be to suggest that the source is simply too radio bright, which is compatible with the emission being highly beamed.
Acknowledgments.
The Australia Telescope is funded by the Commonwealth of Australia for operation as a national facility managed by CSIRO.References
- [1] Stewart R.T., Nelson G.J., Penninx W., Kitamoto S., Miyamoto S., Nicolson G.D., 1991, MNRAS, 253, 212
- [2] Tudose V, Fender R.P., Kaiser C.R., Tzioumis A.K., van der Klis M., Spencer R.E., 2006, MNRAS, 372, 417
- [3] Fender R.P., Wu K., Johnston H., Tzioumis T., Jonker P., Spencer R.E., van der Klis M., 2004, Nature, 427, 222
- [4] Stewart R.T., Caswell J.L., Haynes R.F., Nelson G.J., 1993, MNRAS, 261, 593
- [5] Migliari S., Fender R.P., 2006, MNRAS, 366, 79
- [6] van der Klis M., 1989, ARA&A, 27, 517
- [7] Belloni T., Psaltis D., van der Klis M., 2002, ApJ, 572, 392
- [8] Shirey R.E., Bradt H.V., Levine A.M., Morgan E.H., 1998, ApJ, 506, 374
- [9] Shirey R.E., Bradt H.V., Levine A.M., Morgan E.H., 1996, ApJ, 469, L21
- [10] Migliari S., Fender R.P., van der Klis M., 2005, MNRAS, 363, 112