The unusual distribution of molecular gas and star formation in Arp 140
Abstract
We investigate the atomic and molecular interstellar medium and star formation of NGC 275, the late-type spiral galaxy in Arp 140, which is interacting with NGC 274, an early-type system. The atomic gas (H i) observations reveal a tidal tail from NGC 275 which extends many optical radii beyond the interacting pair. The H i morphology implies a prograde encounter between the galaxy pair approximately years ago. The H emission from NGC 275 indicates clumpy irregular star-formation, clumpiness which is mirrored by the underlying mass distribution as traced by the -band emission. The molecular gas distribution is striking in its anti-correlation with the H ii regions. Despite the evolved nature of NGC 275’s interaction and its barred potential, neither the molecular gas nor the star formation are centrally concentrated. We suggest that this structure results from stochastic star formation leading to preferential consumption of the gas in certain regions of the galaxy. In contrast to the often assumed picture of interacting galaxies, NGC 275, which appears to be close to merger, does not display enhanced or centrally concentrated star formation. If the eventual merger is to lead to a significant burst of star formation it must be preceded by a significant conversion of atomic to molecular gas as at the current rate of star formation all the molecular gas will be exhausted by the time the merger is complete.
keywords:
galaxies: evolution – galaxies: ISM – galaxies: interacting – galaxies: individual: NGC 274, NGC 2751 Introduction
Despite the numerous studies associating galaxy interactions with enhanced star formation (e.g., Kennicutt et al., 1987; Lambas et al., 2003; Nikolic, Cullen & Alexander, 2004), much progress is still to be made in the understanding of the physics of this process. Whilst it is clear that interactions can lead to enhanced star formation it is equally clear that they do not do so with ubiquity (Bergvall, Laurikainen & Aalto, 2003).
In a study of interacting systems Kennicutt et al. (1987) find that star formation in the nuclear region is more sensitive than the disk to the effects of interactions. This observation was first reported by Hummel (1980, 1981) in studies of radio emission from interacting systems and was subsequently corroborated by the H study of Bushouse (1986). More recently, Bergvall et al. (2003) observed a moderate increase in the star-formation rate (SFR) in the central regions of interacting galaxies but found the global star formation properties did not differ significantly from normal isolated systems.
Evidence that galaxy interactions have a more marked effect on the nuclear rather than disk properties of galaxies is supported by -body simulations which suggest that interactions can drive a large fraction of gas into the central regions of the galaxies (Mihos & Hernquist, 1996). Nonetheless, the distribution of star formation triggered in interacting galaxies is not clear cut. Whilst many observations of interacting systems, including those of the most extreme star formation found in Ultra Luminous Infrared Galaxies (ULIRGs), indicate centrally concentrated star formation, observations over a range of wavelengths reveal a number of interacting galaxies with more extended star formation. The Antennae galaxies (NGC 4038/39) are an obvious example: despite abundant dense gas in the two galactic centres, the most intense star formation is found in the overlap region between the two galaxies (Wang et al., 2004). Similarly, many interacting systems exhibit bright spiral arm regions; a notable and well studied example is M51. Star formation is also found in the very extended regions of interacting galaxies, for example in tidal dwarfs (e.g., Duc et al., 2000), shells and large H ii complexes in the outer regions as in M101 or NGC 628 (Lelièvre & Roy, 2000).
Questions about the nature of star formation in interacting galaxies are linked to those surrounding fuelling and the distribution of molecular gas; if star formation is to occur there must exist an adequate and ongoing supply of gas. Interactions can disrupt the axi-symmetry of the galactic potential leading to gas inflow toward the central region. A number of studies have observed enhanced and centrally condensed molecular gas emission in interacting systems, although there is a bias towards more evolved interactions showing significant perturbation, systems that are likely to be merger candidates (Solomon & Sage, 1988; Young, 1999; Casasola et al., 2004).
One important mode by which interactions can disrupt the galactic potential is by the triggering of bar formation (e.g., Noguchi, 1987; Elmegreen, Elmegreen & Bellin, 1990). Simulations indicate bars can lead to gas flow towards the central regions of galaxies (e.g., Noguchi, 1988; Salo, 1991; Barnes & Hernquist, 1991), results that are borne out by the observational studies which reveal enhanced molecular gas emission in the centres of barred systems (Sakamoto et al., 1999; Sheth et al., 2005). Sheth et al. (2005), who studied a sample of 50 nearby spirals – including both late type barred and unbarred spirals, and CO-bright and CO-faint galaxies – found the effect of the bar equally pronounced in late and early Hubble type spirals. They also note that in the case of some early-type barred spirals there is little or no gas within the bar, which is consistent with higher accretion rates provided these galaxies have undergone a starburst. Understanding of the process of star formation in merge in local systems, which can be studied in detail, is necessary for studies of star formation at higher redshifts, where mergers are more frequent.
Here we undertake a detailed examination of the atomic and molecular gas in, and star forming properties of NGC 275, the late-type, weakly barred spiral (classified as SB(rs)cd pec) galaxy that is one component of the interacting, spiral-lenticular pair Arp 140. The other component of Arp 140 is the early-type system NGC 274 (classified as SAB(r)0pec). This is one of a small sample of nine spiral–elliptical interacting pairs, which have been studied by Cullen, Alexander & Clemens (2003, 2006) and Cullen & Alexander (2005). In undertaking these studies we hope to shed light on the possible effects of interaction on late-type spiral systems and the processes which may have shaped and will continue to shape NGC 275’s evolution. The recessional velocity of both NGC 275 and NGC 274 is 1750 (Shostak, 1975; de Vaucouleurs et al., 1991), assuming an Hubble constant of 70 km s-1 Mpc-1, this corresponds to a distance of 25 Mpc, which is used is this paper. The projected major axis diameter () for both NGC 274 and NGC 275 is 10.9 kpc (1.5 arcmin) and the angular separation of the pair is , giving a small projected linear separation of 5.3 kpc.
2 Observations and data reduction
2.1 Optical observations
Broadband optical -band and narrowband H images of Arp 140 were obtained at the 2.3-m telescope at Siding Spring Observatory on the 2002 October 6th. The observations were taken with a CCD with a field of view of , and plate scale of 24.82 arcsec mm-1. The redshifted H line of Arp 140 appears at 660.1 nm and was isolated using a 5.0 nm filter centred on 658.5 nm. Six 5-minute exposures of Arp 140 were observed at offsets in the H filter; short exposures were taken to avoid tracking problems. A 60 s exposure was taken in -band for continuum subtraction. Exposures were made under photometric conditions and the spectral standard star G158100 was observed with both the narrowband and broadband filters to allow calibration of the images. The images were bias and flat-field corrected. The individual narrowband images were then aligned, co-added and the red continuum subtracted to produce the final image of 1800 s total integration time and arcsec spatial resolution with a pixel scale of per pixel.
2.2 21-cm observations
| Observing Array | B-Array | C-Array | D-Array |
|---|---|---|---|
| Observing Dates | 2003 Dec 10 and 19 | 2001 Jul 14 | 1987 May 21 |
| Pointing Centre: RA (J2000) | 00 51 04.20 | 00 51 03.00 | 00 51 01.95 |
| Dec (J2000) | 07 03 60.0 | 07 03 30.0 | 07 03 23.2 |
| Channels | 127 | 63 | 31 |
| Velocity Width () | 5.2 | 20.7 | 42.6 |
| Time On-source (minutes) | 447 | 113 | 58 |
| Flux Calibrator | 3C48 (15.95 Jy) | 3C48 (15.95 Jy) | 3C48 (15.95J̃y) |
| Phase Calibrator | 0059001 | 0054035 | 0056001 |
| Angular Resolution | |||
| of Channel Maps | |||
| Channels Used for | and | and | and |
| Continuum Subtraction |
VLA H i observations were in both B-, C- and D-array data were retrieved from the National Radio Astronomy Observatory (NRAO) archive. Details of all of the H i observations are presented in Table 1. The data reduction followed standard procedures, using NRAOs Astronomical Image Processing System (AIPS) package. Channel maps were made, details of which are given in Table 1. For the C- and D-array data combined a -taper of 9 k was applied (in ) to help correct for the distorted beam, a result of the low declination of the source. Continuum emission was removed by subtraction of the average of the line-free channels. Channel maps were summed in MOMNT using a combination of ‘cut-off’ and ‘window’ methods (Taylor, Carilli & Perley, 1999), to optimise detection of the H i emission.
Line-free channels from the VLA B-array data were used to produce an L-band continuum map of NGC 275. A conservative choice of channels ( ) in the 128 channel-wide bandwidth was selected to sample the continuum emission. This limited channel range excluded all potential line emission and the edge-of-bandwidth channels displaying interference. The data were self-calibrated and imaged using natural weighting to increase the sensitivity to large-scale structure. The flux density obtained ( mJy) is in good agreement with the NVSS flux density (60 mJy) for NGC 275 (Condon et al., 1998).
2.3 12CO () observations
Observations of NGC 275 were made using both the six-element Owens Valley Radio Observatory (OVRO) millimeter interferometer and the 10-element Berkeley-Illinois-Maryland Association (BIMA) millimeter interferometer. In both cases the 12CO () line was observed at 115.2712 GHz. In total, three tracks were observed using the BIMA interferometer in C-configuration on 2003 March 23, 26 and May 18, but the data taken on March 26 were unusable because of high levels of interference. The BIMA correlator was configured to have a resolution of 1.56 MHz () over a total bandwidth of 367 MHz (). The primary beam of BIMA at this frequency is FWHM. The sources 3C454.3 and 0108015 were observed for passband and phase calibration respectively. System temperatures averaged K for the March observations and K for the May observations. In addition, NGC 275 was observed using the OVRO interferometer in both C- and L-configurations on 2003 October 3 and 31. The primary beam at OVRO at 115 GHz is . 3C84 and 3C454.3 were used as passband calibrators and J0116116 was observed every 20 minutes for phase calibration. Typical single-sideband system temperatures ranged between 450 and 700 K in C-configuration and between 300 and 450 K in L. The OVRO correlator was configured with 120 independent channels of 2 MHz () giving a total bandwidth of 240 MHz ().
Data calibration was carried out in MMA (Scoville et al., 1993) and Miriad (Sault et al., 1995) for the OVRO and BIMA datasets respectively. Calibrated datasets were then read into AIPS, further flagging applied and the calibrated datasets combined. Data was binned to a spectral resolution of . A -taper of 20 k was applied in an attempt to reduce the highly distorted beam resulting from the low declination of the source. The resulting resolution of the channel maps was .
2.4 12CO () observations
Observations of the 12CO () line at 230.54 GHz towards NGC 275 were made with the James Clerk Maxwell Telescope (JCMT) in ‘service’ mode between 2002 August 19 and September 20. Observations were made on an grid with spacing in both RA and Dec, centred on RA , Dec (J2000). The pointing separation of produced a fully sampled map (the JCMT beam is at 230.54 GHz). The observing strategy adopted sampled the whole grid at 1 minute per point. This was repeated 14 times to ensure comparable noise levels across the map. Sky subtraction was achieved by beam-switching to a point in RA from the reference position. Scans at each position were averaged. Each spectrum was corrected for a residual frequency-dependent baseline offset by removing a linear baseline fitted to end channels. The spectra were then binned to a velocity resolution of .
Standard calibration observations were made at the same time as the observations of NGC 275. Data calibration followed the standard JCMT procedure, adopting the beam efficiency and forward scattering efficiency on the JCMT website yielding an of 0.77. To convert between main beam temperature and flux for NGC 275, it was assumed that the 12CO () emission could be modelled as a point source. Whilst this is not strictly the case, it allows us to place a lower limit on the 12CO () flux for this system. The conversion between flux and main beam temperature assuming a point source is given by , where we take the FWHM of the JCMT beam at 230 GHz to be .
3 Results
3.1 Neutral atomic hydrogen in Arp 140
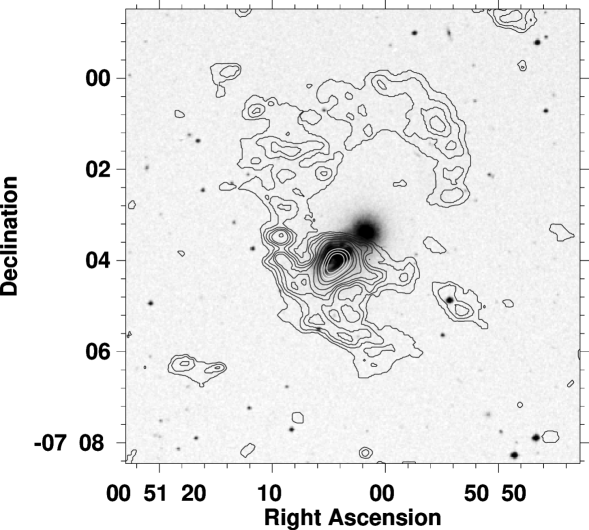
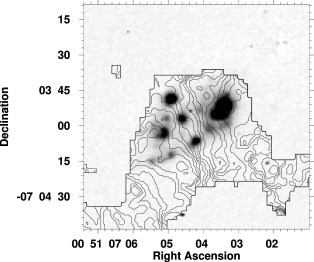
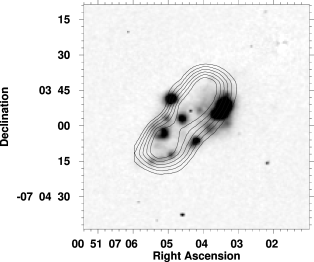
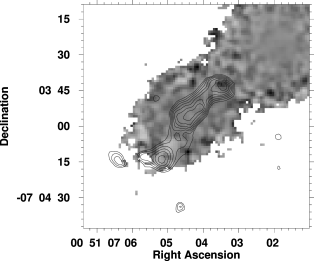
The VLA C- and D-array H i map is shown in Fig. 1, together with the velocity field shown in Fig. 2. There is an extended tidal tail associated with the Arp 140 system. Given the galaxies were selected as a late-type interacting with a gas-poor system, ram pressure from the cool ISM of the later is not expected to be important. The distribution of gas is consistent with the H i originating in NGC 275. The peak flux is 1.7 Jy beam-1 km s-1 corresponding to a column density of cm-2 ( M⊙ parsec-2) falling to around 0.1 Jy beam-1 km s-1, corresponding to a column density of cm-2 ( M⊙ parsec-2) in the extended regions of the tidal tail. Two peaks are observed to the east of the optical system near , at declinations and ; both have velocities considerably larger than those of the surrounding H i. Both regions also exhibit large velocity dispersion, of order , in contrast to the average dispersion of about observed in much of the extended southern tidal tail. Excluding the two peaks described above – as they may not be related to the tidal tail – the peak flux observed in the tidal tail is 0.25 Jy beam-1 km s-1, a column density of cm-2 ( M⊙ parsec-2).
The total H i flux for Arp 140, obtained by adding the flux in the low-resolution channel maps, is 25.9 Jy km s-1, which is in agreement with the single dish flux of Jy km s-1 (Shostak, 1975). This corresponds to a neutral hydrogen mass of M⊙. The integrated H i map in Fig. 1 reveals no emission from the early-type system, NGC 274. Based on an rms sensitivity of Jy beam-1, the upper limit on the H i content of NGC 274 of M⊙ (0.03 Jy km s-1).
The southern region of the tidal arm has a velocity dispersion of with velocities ranging from on the eastern side of the tail to on the western side. The largest blue shifted point in the H i emission () is located at the far eastern edge of the northerly extension of the tidal tail, whereas the largest redshifted point () is found on the most western point of the southerly extension of the tail. The more northern of the two H i peaks observed at the base of the northern tidal tail in Fig. 1 is associated with an abrupt change in the velocity profile of the H i emission. Examining the spectra over this region reveals a ( beam) area displaying an H i profile with two peaks. This is consistent with emission from stripped gas associated with Arp 140 at km s-1 and a small H i cloud (at km s-1), with a mass in excess of M⊙, which may be tidal debris.
We now consider the likely origin of the extended H i structure we observe. This stucture is consistent with tidal stripping, and we feel that it is unlikely to have been significantly influenced by ram-pressure effects. NGC 274 and 275 are members of a poor group which also includes NGC 298 and 337 (see Hyperleda), not a rich cluster where a significant intra-cluster medium may be present and ram-pressure effects could be important. NGC 274 is a gas-poor early-type galaxy with little evidence of any H i being associated with it: the northern tidal tail implies that the pair rotate in an anti-clockwise sense as projected in Fig. 1. This further suggests that the southern displacement of atomic gas relative to the centre of NGC 275 is not caused by ram-pressure from an extended medium. In this case the displacement should be in the opposite sense.
3.2 High resolution H i data
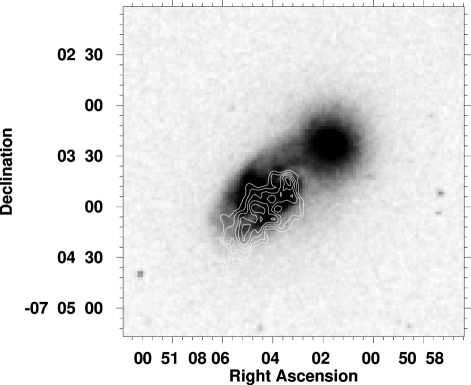
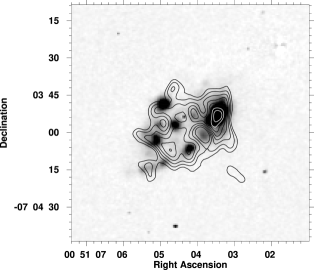
A high-resolution () map made using B-array data is shown in Fig. 3; the angular resolution of these data corresponds to a physical scale of kpc. Whilst the major axis of the H i emission in NGC 275 is parallel to that of the -band optical data, it lies approximately ( kpc) to the south west of the optical major axis. The atomic gas associated with the galaxy has a clumpy distribution with three main peaks aligned approximately along the major axis. The northern and southern peaks are offset from the central peak by (2.8 kpc) and (2 kpc) respectively. The clear offset of the atomic gas with respect to the stellar structure is striking. Similar displacements of the H i emission from the stellar disks were observed by Iono et al. (2005) in their study of ten interacting systems.
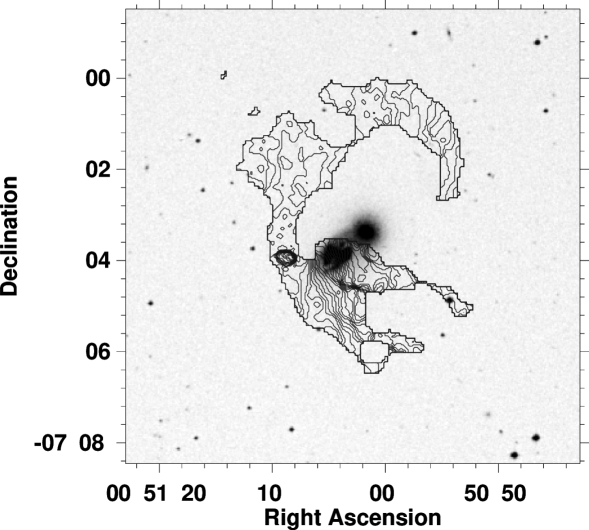
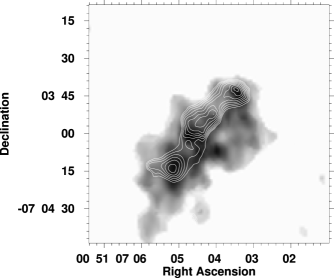
Figure 4 shows the intensity-weighted mean velocity field of NGC 275 using the combined VLA B- and C-array data. The velocity contours indicate increasingly blueshifted gas as we move along the major axis of NGC 275 from south-west to north-east. This progression continues to the base of the tidal arm extending northward from the galaxy, where a number of loops in the contour lines are observed indicative of a disrupted velocity field. The velocities observed in this region are , and we identify this region as the transition between atomic gas still associated with the galaxy and gas in the tidal tail. This yields a velocity range of gas associated with NGC 275 of .
The structure observed in the B-array map therefore predominantly traces atomic gas still bound to the galaxy. The integrated H i flux for this bound gas is Jy (linewidth ), which corresponds to an H i mass of M⊙, which is approximately one third of the total H i in the Arp 140 system. This is consistent with the trend found by Hibbard & van Gorkom (1996) who find for a sample of galaxies which lie in the central region of the merger sequence that of the total atomic gas emission comes from the inner regions of the system, with this percentage falling dramatically for more advanced mergers.

We have derived the rotation curve for NGC 275 (Fig. 5) from the intensity-weighted velocity field using the tilted ring model (Warner, Wright & Baldwin, 1973) in the AIPS task GAL. This method approximates the galaxy as a set of concentric rings of gas at increasing radii, characterised by a circular velocity, position angle and inclination angle. The dynamical centre was fixed using the 2MASS -band data and the inclination angle of 36.8 degrees was taken from the Hyperleda database111See http://leda.univ-lyon1.fr/. The H i rotation curve was fitted by breaking the galaxy into annuli in width (i.e. approximately a half-beam width) and fitting the velocity field in each annulus, keeping the dynamical centre and inclination angle fixed.
3.3 Star-formation in NGC 275
The calibrated H data for the late-type system, NGC 275, yields a total integrated flux of approximately W m-2, which is equivalent to a luminosity of W. Assuming no reddening and adopting the calibration of Kennicutt (1998) this corresponds to a SFR of 0.77 M⊙ yr-1, which is in good agreement with the value obtained by Laurikainen & Moles (1989) who quote a SFR for NGC 275 of 0.75 M⊙ yr-1. The far-infrared (FIR) emission gives an obscuration-free estimate of the SFR: adopting the calibration of Bell (2003) we obtain a FIR SFR of 1.5 M⊙ yr-1 for NGC 275, which we adopt for the remainder of this paper.
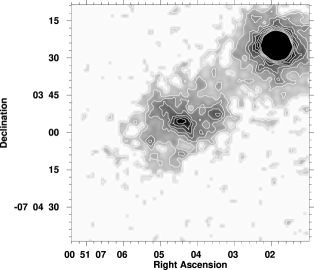
The star formation in NGC 275 as traced both by the H and radio continuum emission is irregular (Fig. 4), and is not centrally concentrated. Interestingly, the patchy star formation traced by the H emission is mirrored by the 2MASS -band image which is shown in Fig. 6. The near infrared is usually considered a good tracer of the older stellar population and hence of the mass distribution. One caveat to this assumption is the possible contribution to the near infrared from red supergiants, however this is unlikely in NGC 275 given the observed star formation rate. The irregular structure observed in the -band image is consistent with an irregular underlying mass distribution. Fig. 6 shows a bar at a position angle of about , with two knots of H at a similar angle, but offset slightly to the leading edge. Such an offset has been seen in previous studies (see Sheth et al., 2002, for a study of six barred spirals), where H ii regions were offset to the leading edge of CO bars (see also Sheth et al. (2000)). Also, enhanced star formation was see at the ends of bars, as is indicated in the case of NGC 275 from H knots nears the ends of the bar.
3.4 Molecular gas
3.4.1 Distribution of 12CO ()
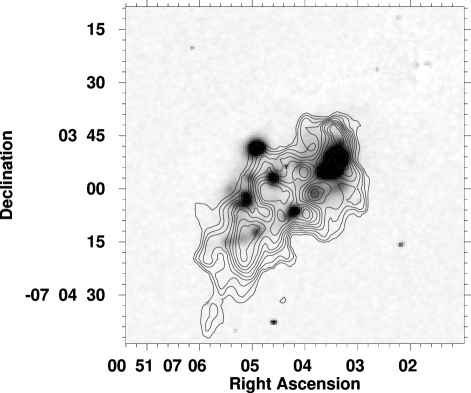
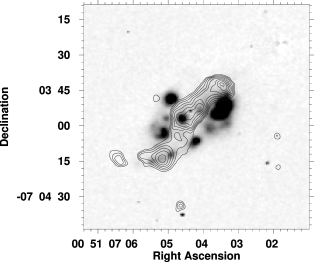
A 12CO () map from the combined BIMA and OVRO data is shown in Fig. 7; the synthesised beam has , corresponding to a physical scale of kpc. The integrated emission is shown overlayed on a continuum subtracted H image (Fig. 7). The CO data reveal three clear peaks, of which the central peak is the most extended. Unlike the high resolution H i data the molecular gas appears well aligned with the major axis of the optical -band image. The integrated 12CO () flux is Jy ; adopting the CO-to-H2 conversion factor cm-2 K km s-1 (Bloemen et al., 1986), this yields a total mass of H2 of M⊙.
The velocity gradient of the molecular gas measured from the high resolution 12CO () data yields a relatively constant velocity gradient (correspond to a velocity change of over the central 3.6 kpc), in good agreement with the value obtained from the H i data ().
3.4.2 Distribution of 12CO ()
The 12CO () emission observed with the JCMT is shown in Fig. 7. CO emission is detected over a region approximately , coincident with optical emission. The observed 12CO () emission is consistent with the structure in the 12CO () emission after its has been convolved to a similar resolution (). The total 12CO () flux for NGC 275 is 13.4 K, which corresponds to a flux of Jy km s-1 for the JCMT at 230 GHz.
4 The interstellar medium in Arp 140
The molecular gas mass of NGC 275 is M⊙, while the atomic gas mass we estimate to be bound to NGC 275 is M⊙: the total atomic gas mass associated with the Arp 140 system is M⊙. After allowing for differences in the H2 to CO conversion factor () the molecular gas mass normalised by either the galaxy area or the -band luminosity is typical of other Scd galaxies observed by Young & Knezek (1989), although it is towards the higher end of the range obtained by Casoli et al. (1990) and Bettoni, Galletta & García-Burillo (2003). The atomic gas mass is also comparable to other Scd galaxies. Compared to other interacting galaxies (Casasola, Bettoni & Galletta, 2004) Arp 140 has a slight deficit of molecular gas and a typical atomic gas mass.
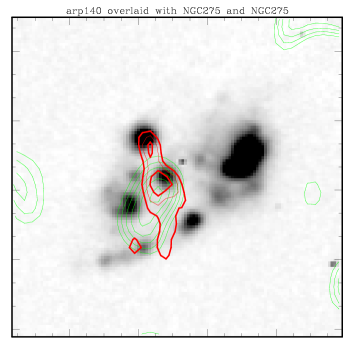
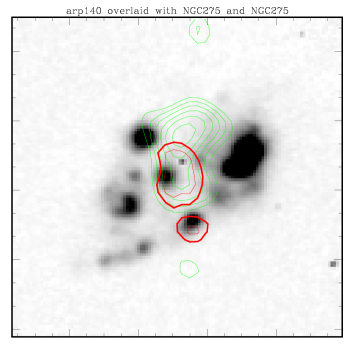
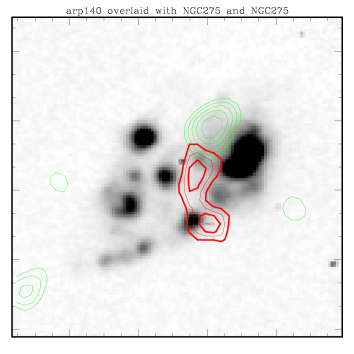
In Fig. 8 we compare the distribution of 12CO () and H i associated with NGC 275. In the outer region of the galaxy the co-incidence between the molecular gas peaks and the atomic gas peaks is good, however the central molecular gas peak is offset to the north-east of the atomic gas peak. As already noted, the H i emission is offset towards the south-west of the galaxy, whereas the CO data is well aligned with the optical major axis of the system. Comparison of the kinematics of the H i and CO data was made by regridding the fully sampled data to a grid with pixels and a velocity resolution of 20 and smoothing the H i data to the same resolution of the CO dataset.
Some channel maps of both HI and 12CO () emission are shown in Fig. 9. The atomic and molecular gas appear spatially co-incident at lower velocities, tracing emission in the south-eastern region of the galaxy. This is also the region in which the molecular line-ratio indicates the largest molecular gas densities. At the highest velocities, tracing emission in the more northern region of the galaxy closer to the bright H ii region, the spatial co-incidence breaks down. Spatial offsets between the molecular and atomic gas, and a possible small kinematical offset occur in the region of NGC 275 closest to the perturbing galaxy NGC 274.
 |
 |
|
| 1733 | 1754 | |
 |
 |
|
| 1775 | 1796 | |
 |
||
| 1817 |
| RA | Dec | ||||
|---|---|---|---|---|---|
| () | () | (K km s-1) | (K km s-1) | ||
| 00 51 05.3 | 04 11.7 | 5.13 | 4.65 | 0.9 | 0.2 |
| 00 51 04.6 | 04 01.7 | 6.28 | 4.04 | 0.6 | 0.1 |
| 00 51 04.0 | 03 51.7 | 7.68 | 4.05 | 0.5 | 0.1 |
| 00 51 03.3 | 03 41.7 | 5.53 | 3.04 | 0.5 | 0.1 |
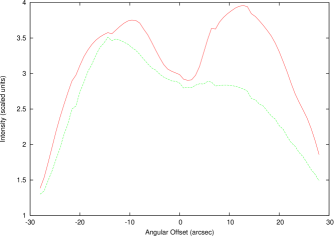
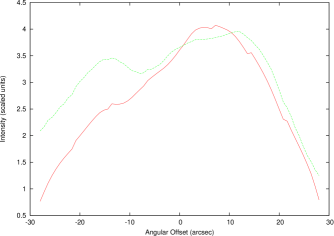
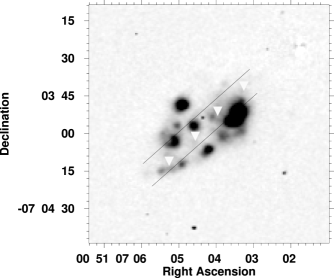
To determine the 12CO ()/12CO () line ratio the 12CO () data were smoothed to a resolution of , comparable to the JCMT data, and re-gridded. The line ratio at four locations shown in Fig. 10 are given in Table 2 and in Fig. 11 we show profiles of the and emission along the two directions indicated in Fig. 10. The integrated line ratio for NGC 275 is . The ratios in Table 2 indicate a trend of decreasing ratio as we move along the major axis from east to west; the ratio decreases from at the south eastern end of NGC 275 to in the north-western half of the galaxy. In the far south-eastern tip of NGC 275 the line ratio of is consistent with the properties of giant molecular clouds seen in Orion, which have a kinetic temperature, K and density cm-3 (Sakamoto et al., 1994). Away from the south-eastern tip the line ratio falls to around . Assuming a typical value for the kinetic temperature in the molecular clouds ( K), the decreasing line ratio is consistent with a lower density of below cm-3 (Sakamoto et al., 1994).
These results are interesting since they imply the densest hottest gas in this system is not associated with the region of most active star formation. In fact, the most active star forming region has the lowest line ratios. The highest line ratios are to be found in the south-east of the galaxy, the region suffering most disturbance as a result of the tidal interaction. The line ratio towards the centre of NGC 275 is significantly less than that found by Braine & Combes (1992) in interacting systems.
5 Relationship between star formation and gas distribution
We now consider the origin of the strong anti-correlation between the distribution of star-forming regions and molecular gas which we see in NGC 275. The form of the molecular gas distribution is clearly bar-like. NGC 275 is classified as a barred galaxy, and careful examination of the optical and IR images reveal an indistinct bar which runs along the minor axis. The CO morphology is disrupted, and the CO emission peaks at the edges of the disk, as well as centrally.
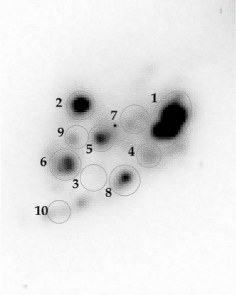
First, we note that the large scale effects of SNe would be to sweep up and/or ionise the neutral material, and hence produce a separation between H emission and the atomic gas. However, this is not seen. To explain the anti-correlation between the distribution of molecular gas and the sites of current star formation, we begin by examining the hypothesis that extinction caused by dust associated with the molecular gas has given rise to the apparent anti-correlation. Science grade images of NGC 275 in , and bands were downloaded from the 2MASS archive 222Available at http://irsa.ipac.caltech.edu/applications/2MASS/LGA/. Colour difference images of , and were produced using IRAF by blanking all pixels below in the - and -images and below in the -band image. The resulting image overlayed with contours indicating the molecular gas distribution is shown in Fig. 12. A quantitative analysis is given for several regions, indicated in Fig. 13, with the results shown in Table 3. The largest reddening is associated with the south-easterly peak of the molecular gas distribution which also has the largest 12CO ()/12CO () ratio, consistent with a high gas density. There is no evidence for significant reddening associated with the broad distribution of molecular gas. For all points along the molecular gas distribution the reddening never exceeds 0.46 in and is typically only 0.2 magnitudes larger than the observed reddening against peaks in the H distribution. For a standard extinction law this corresponds to much less than one magnitude of extinction in H at the worst. We conclude that extinction caused by dust associated with the molecular gas cannot account for the observed distribution of H emission. This conclusion is supported by the radio continuum data which follow well the H distribution and do not indicate a region of hidden star formation behind the molecular gas.
| Region | Size | ||
|---|---|---|---|
| kpc2 | erg cm-2 s-1 | mag | |
| (1) | (2) | (3) | (4) |
| 1 | 1.54 | 45.27 | 0.06 |
| 2 | 0.57 | 8.36 | 0.08 |
| 3 | 0.48 | 1.59 | 0.30 |
| 4 | 0.40 | 3.51 | 0.11 |
| 5 | 0.48 | 4.18 | 0.15 |
| 6 | 0.67 | 6.66 | 0.10 |
| 7 | 0.55 | 3.94 | 0.16 |
| 8 | 0.64 | 4.95 | 0.04 |
| 9 | 0.38 | 2.37 | 0.12 |
| 10 | 0.37 | 1.38 | 0.46 |
| 11 | 0.49 | 2.18 | 0.37 |
| 12 | 0.68 | 4.94 | 0.13 |
| 13 | 0.44 | 1.99 | 0.11 |
(1) Region number: regions are shown in Fig. 13. (2) Area of region in kpc2. (3) The H flux for region in question. (4) The reddening observed in magnitudes using the 2MASS colour difference image.

A second possibility is that molecular hydrogen has been dissociated by UV photons from the regions of current star formation and/or molecular gas is dissociated and ionised. There is no evidence for large-scale dissociation of molecular hydrogen to atomic hydrogen in the vicinity of the H ii regions — if this were to occur we would expect an anti-correlation between the atomic and molecular gas, however we see no such effect when comparing the H i and 12CO () images. We can also rule out substantial ionisation. Modelling the observed H peaks as individual H ii regions we can estimate an upper limit to the column density of ionised hydrogen which we find to be typically cm-2, which is more than three orders of magnitude less than the observed column density of atomic and molecular gas towards the peaks in the molecular gas distribution ( cm-2).
A third possibility that we explore is that on-going star formation has depleted the molecular gas close to the H ii regions. We estimate the mass of gas consumed during star formation by taking the current observed star formation rate which is 1.5 M⊙ yr-1, and estimating the timescale over which star formation has been occurring. To do this we assume that star formation was triggered at perigalacticon, at which point the tidal perturbation would have been a maximum. To estimate the time since we use the observed distribution of H i in the tidal tail. The length of semi-circular tidal tail extending to the north of the interacting pair is , corresponding to a physical distance of kpc. Assuming the atomic gas associated with NGC 275 was not significantly accelerated during the encounter and has moved ballistically since it was stripped, we can estimate its velocity from the rotational speed of the galaxy and its orbital velocity in the system as , where is the rotational velocity of the galaxy from which the tidal tail originated and is the relative radial velocity of the two interacting galaxies. The interaction between NGC 275 and NGC 274 appears to be largely in the plane of the sky; both galaxies having the same systemic velocity giving a relative radial velocity of zero. From the rotation curve we estimate the rotational velocity of NGC 275 to be (corrected for the inclination angle). This spatial extent of the tidal tail and the estimated velocity of the gas give an approximate timescale of interaction of yr. Simple -body simulations for this system (Cullen, 2005) give a similar timescale of yr since perigalacticon. Together with the current star formation rate this gives for the mass of molecular gas consumed since perigalacticon M⊙; the upper end of the range represents approximately half the current molecular gas mass in NGC 275. It is therefore quite possible that the structure we observe in which the H and molecular gas are spatially anti-correlated is the result of consumption of the molecular gas during an episode of star formation which began at about perigalacticon.
Another possible explanation for the observed distribution of molecular gas is that it is a warped molecular disc or ring. NGC 275 is inclined with respect to the plane of the sky (inclination angle degrees) and the systemic velocities of the interacting galaxies are the same. These facts suggest that the spin angular momentum vector of NGC 275 and the orbital angular momentum vector of the interacting pair are not aligned, conditions consistent with the production of a galactic warp. The molecular gas in NGC 275 has an S-shaped spatial distribution, which could be indicative of a warped disk. It is not unreasonable to postulate that the gas and stellar populations (and hence H ii regions) have responded differently to the tidal perturbation hence giving rise to an offset between the gas distribution and the stellar disc. However warps are usually observed on larger physical scales than that of the molecular gas distribution in NGC 275 although a smaller scale warp was recently found in the molecular gas distribution of NGC 3718 (Pott et al., 2004); a system with a companion at 13 Mpc. There is however no evidence for a warp in the H i distribution; it therefore seems unlikely that this mechanism could explain the observed distribution of gas.
6 Star Formation in NGC 275
NGC 275 is at a relatively advanced stage of interaction with an early-type system, NGC 274. Estimates of the time since perigalacticon indicate a timescale of approximately yr. The galaxy has a relatively normal SFR ( M⊙ yr-1), although normalisation of the modest FIR luminosity, , by an equally modest molecular gas yields a sizeable star-formation efficiency ( L⊙ M). The distribution of molecular gas and regions of star formation are unusual in a number of ways. Neither the molecular gas distribution nor the recent star formation are centrally condensed, although some star formation is occurring in the nucleus indicated by the presence of a nuclear star cluster (Böker, Stanek & van der Marel, 2003). The star formation is patchy and extended, and there is a strong anti-correlation with the molecular gas. There is no evidence for a gravitational or dynamical origin of the observed structures – there is no indication of spiral structure in any data set, and indeed the 2MASS -band data also show a patchy structure. Although NGC 275 is a barred system, the bar is not strong, nor is the molecular gas aligned with it. These observations and the analysis of the previous section suggests that the anti-correlation we observe between the sites of current star formation and the molecular gas distribution is most likely explained by the consumption of gas during an episode of star formation which began close to perigalacticon.
In galaxies in which large-scale structure such as spiral arms organise the star formation systematic offsets are seen between the molecular gas distribution and that of H ii regions (Vogel et al., 1988; Rand, 1993; Knapen & Beckman, 1996; Loinard et al., 1996). These offsets are explained by the time delay between the gas accumulation and onset of star formation. However, in galaxies which lack such a large-scale driver a more random distribution of offsets are expected. In the late-type galaxy M33, where spiral structure is weak, Engargiola et al. (2003) and Wilson & Scoville (1991) find that H ii regions are often close to giant molecular clouds, but that there are many examples of both molecular clouds with no H ii regions and H ii regions without molecular clouds. Typically there is some offset between the two but the sense of this seems not to be related to the spiral structure. The situation in NGC 275 is probably closer to that in M33 than in galaxies with strong spiral structure. The process of star formation in NGC 275 may have followed a more stochastic evolution, with small-scale processes, rather than galaxy-wide perturbations, dominating its evolution.
The lack of correlation between the molecular gas distribution and that of star formation seen in NGC 275 may be a common phenomenon. Iono et al. (2005) present H i and interferometric CO observations of 10 comparable-mass interacting galaxies, detecting isolated CO emission with no optical counterpart in a number of systems. Similarly, Walter et al. (2001) observe no clear correlation between the H i and CO and sites of ongoing star formation in the dwarf starburst NGC 4214, although the H i and CO velocities agree well. The irregular nature of the star formation in this galaxy, the absence of correlation between the total gas column density and regions of star formation and the good agreement of the H i and CO dynamics is similar to the situation observed in NGC 275.
NGC 275’s atomic and molecular gas content will be important in determining its evolution. Consistent with other late-type spiral galaxies, NGC 275 has a modest amount of molecular gas in a relatively extended distribution. The atomic gas content of NGC 275 is similarly unremarkable, although its morphology is more dramatic: the H i having largely been stripped with only one-third of the atomic gas still associated with the galaxy.
One of the defining features of the Arp 140 pair is that it contains only one late-type, gas-rich galaxy. This characteristic distinguishes it from the interacting systems that constitute the ULIRG population, believed to result from the merger of two gas-rich disks. Manthey et al. (2004) are studying a sample of mergers an order of magnitude less luminous then ULIRGs – moderate luminosity mergers with luminosities in the range L⊙. They suggest that these systems might be the product of a merger between two gas-rich galaxies of unequal mass or, as is the case for Arp 140, a late-type and early-type galaxy, contrasting such systems with ULIRGs, which are believed to result from the merger of two comparable mass gas-rich disks, yielding very centrally condensed molecular gas distributions and FIR luminosities in excess of L⊙. The FIR luminosity of NGC 275 places it at the faint end of the Manthey et al. sample; although, NGC 275 is still a relatively young interaction when compared with these merger systems.
For a star formation rate of 1.5 M⊙ yr-1 (the current rate in NGC 275) the timescale for the consumption of the molecular gas is between yr. We estimate a time to merger of between 3 and yr (Cullen, 2005). As NGC 275 approaches merger most of its supply of molecular gas will have been exhausted at the present rate of star formation. Unless there is significant conversion of atomic to molecular gas, and also some infall of stripped material, there will not be a sufficient supply of fuel to allow the star formation rate to increase significantly from its present value.
7 Conclusions
Given the timescale required to produce the large H i tidal tail, NGC 275 is at a relatively advanced stage of interaction with an early-type system. In contrast to the commonly painted picture of interacting systems, the perturbation experienced by NGC 275 does not appear to have triggered large-scale gas inflow and ensuing centrally enhanced star formation. Despite NGC 275’s interacting status and weakly barred potential, neither the molecular gas distribution nor the recent star formation are centrally condensed. The brightest emission from both the star-formation tracers and the molecular gas are found not in the centre, but offset to the north-west. The relationship between the molecular gas and H emission in NGC 275 is somewhat unusual; the two tracers appear to a large extent uncorrelated. Investigation indicates this is unlikely to result from either extinction or ionisation effects. Whilst there is some evidence of weak spiral structure in this galaxy, the -band image does not indicate an underlying spiral structure in NGC 275’s mass distribution. Instead, the patchy H emission is mirrored by equally patchy -band emission (Section 3.3). NGC 275 appears to be undergoing star formation of a stochastic-like nature, in the sense that it is driven by smaller scale feedback effects, rather than large scale dynamical processes. This star formation, which may have been enhanced by the interaction, is likely to have contributed to the depletion of molecular gas in certain regions of the galaxy, shaping the observed gas distribution.
Acknowledgements
We thank the staff of the OVRO and BIMA interferometers. The James Clerk Maxwell Telescope is operated by The Joint Astronomy Centre on behalf of the Particle Physics and Astronomy Research Council of the United Kingdom, the Netherlands Organisation for Scientific Research, and the National Research Council of Canada. The National Radio Astronomy Observatory is a facility of the National Science Foundation operated under cooperative agreement by Associated Universities, Inc. This research has made use of the NASA/IPAC Extragalactic Database (NED) which is operated by the Jet Propulsion Laboratory, California Institute of Technology, under contract with the National Aeronautics and Space Administration. HC acknowledges receipt of a PPARC studentship.
References
- Böker et al. (2003) Böker T., Stanek R., van der Marel R. P., 2003, AJ, 125, 1073
- Barnes & Hernquist (1991) Barnes J. E., Hernquist L. E., 1991, ApJ, 370, L65
- Bell (2003) Bell E. F., 2003, ApJ, 586, 794
- Bergvall et al. (2003) Bergvall N., Laurikainen E., Aalto S., 2003, A&A, 405, 31
- Bettoni et al. (2003) Bettoni D., Galletta G., García-Burillo S., 2003, A&A, 405, 5
- Bloemen et al. (1986) Bloemen J. B. G. M., Strong A. W., Mayer-Hasselwander H. A., Blitz L., Cohen R. S., Dame T. M., Grabelsky D. A., Thaddeus P., Hermsen W., Lebrun F., 1986, A&A, 154, 25
- Braine & Combes (1992) Braine J., Combes F., 1992, A&A, 264, 433
- Bushouse (1986) Bushouse H. A., 1986, AJ, 91, 255
- Casasola et al. (2004) Casasola V., Bettoni D., Galletta G., 2004, A&A, 422, 941
- Casoli et al. (1990) Casoli F., Clausset F., Combes F., Viallefond F., Boulanger F., 1990, A&A, 233, 357
- Condon et al. (1998) Condon J. J., Cotton W. D., Greisen E. W., Yin Q. F., Perley R. A., Taylor G. B., Broderick J. J., 1998, AJ, 115, 1693
- Cullen (2005) Cullen H., 2005, Ph.D. Thesis, University of Cambridge
- Cullen & Alexander (2005) Cullen H., Alexander P., 2005, in Wilson, A., ed., ESA SP-577, The Dusty and Molecular Universe: A Prelude to Herschel and ALMA, p. 353
- Cullen, Alexander & Clemens (2003) Cullen H., Alexander P., Clemens M., 2003, Ap&SS, 284, 503
- Cullen, Alexander & Clemens (2006) Cullen H., Alexander P., Clemens M., 2006, MNRAS, 366, 49
- de Vaucouleurs et al. (1991) de Vaucouleurs G., de Vaucouleurs A., Corwin H. G., Buta R. J., Paturel G., Fouque P., 1991, Third Reference Catalogue of Bright Galaxies. Springer-Verlag Berlin
- Duc et al. (2000) Duc P.-A., Brinks E., Springel V., Pichardo B., Weilbacher P., Mirabel I. F., 2000, AJ, 120, 1238
- Elmegreen et al. (1990) Elmegreen D. M., Elmegreen B. G., Bellin A. D., 1990, ApJ, 364, 415
- Engargiola et al. (2003) Engargiola G., Plambeck R. L., Rosolowsky E., Blitz L., 2003, ApJS, 149, 343
- Hibbard & van Gorkom (1996) Hibbard J. E., van Gorkom J. H., 1996, AJ, 111, 655
- Hummel (1980) Hummel E., 1980, A&A, 89, L1
- Hummel (1981) Hummel E., 1981, A&A, 96, 111
- Iono et al. (2005) Iono D., Yun M., Ho P., 2005, ApJS, 158, 1
- Kennicutt (1998) Kennicutt R. C., 1998, ARA&A, 36, 189
- Kennicutt et al. (1987) Kennicutt R. C., Roettiger K. A., Keel W. C., van der Hulst J. M., Hummel E., 1987, AJ, 93, 1011
- Knapen & Beckman (1996) Knapen J. H., Beckman J. E., 1996, MNRAS, 283, 251
- Lambas et al. (2003) Lambas D. G., Tissera P. B., Alonso M. S., Coldwell G., 2003, MNRAS, 346, 1189
- Laurikainen & Moles (1989) Laurikainen E., Moles M., 1989, ApJ, 345, 176
- Lelièvre & Roy (2000) Lelièvre M., Roy J., 2000, AJ, 120, 1306
- Loinard et al. (1996) Loinard L., Dame T. M., Koper E., Lequeux J., Thaddeus P., Young J. S., 1996, ApJ, 469, L101
- Manthey et al. (2004) Manthey E., Hüttemeister S., Haberzettl L., 2004, in Dettmar R., Klein U., Salucci P., eds, Baryons in Dark Matter Halos, SISSA, p. 40
- Mihos & Hernquist (1996) Mihos J. C., Hernquist L., 1996, ApJ, 464, 641
- Nikolic, Cullen & Alexander (2004) Nikolic B., Cullen H., Alexander P., 2004, MNRAS, 355, 874
- Noguchi (1987) Noguchi M., 1987, MNRAS, 228, 635
- Noguchi (1988) Noguchi M., 1988, A&A, 203, 259
- Pott et al. (2004) Pott J.-U., Hartwich M., Eckart A., Leon S., Krips M., Straubmeier C., 2004, A&A, 415, 27
- Rand (1993) Rand R. J., 1993, ApJ, 404, 593
- Sakamoto et al. (1999) Sakamoto K., Okumura S. K., Ishizuki S., Scoville N. Z., 1999, ApJ, 525, 691
- Sakamoto et al. (1994) Sakamoto S., Hayashi M., Hasegawa T., Handa T., Oka T., 1994, ApJ, 425, 641
- Salo (1991) Salo H., 1991, A&A, 243, 118
- Sault et al. (1995) Sault R. J., Teuben P. J., Wright M. C. H., 1995, in Shaw R. A., Payne H. E, Hayes J. J. E., eds, ASP Conf. Series 77, Astronomical Data Analysis Software and Systems IV, p. 433
- Scoville et al. (1993) Scoville N. Z., Carlstrom J. E., Chandler C. J., Phillips J. A., Scott S. L., Tilanus R. P. J., Wang Z., 1993, PASP, 105, 1482
- Sheth et al. (2000) Sheth K., Regan M. W., Vogel S. N., Teuben P. J., 2000, ApJ, 532, 221
- Sheth et al. (2002) Sheth K., Vogel S. N., Regan M. W., Teuben P. J., Harris, A. I., Thornley M. D., 2002, AJ, 124, 2581
- Sheth et al. (2005) Sheth K., Vogel S. N., Regan M. W., Thornley M. D., Teuben P. J., 2005, ApJ, 632, 217
- Shostak (1975) Shostak G. S., 1975, ApJ, 198, 527
- Solomon & Sage (1988) Solomon P. M., Sage L. J., 1988, ApJ, 334, 613
- Taylor et al. (1999) Taylor G. B., Carilli C. L., Perley R. A., eds, 1999, ASP Conf. Series 180, Synthesis Imaging in Radio Astronomy II
- Vogel et al. (1988) Vogel S. N., Kulkarni S. R., Scoville N. Z., 1988, Nat, 334, 402
- Walter et al. (2001) Walter F., Taylor C. L., Hüttemeister S., Scoville N., McIntyre V., 2001, AJ, 121, 727
- Wang et al. (2004) Wang Z., Fazio G. G., Ashby M. L. N., Huang J.-S., Pahre M. A., Smith H. A., Willner S. P., Forrest W. J., Pipher J. L., Surace J. A., 2004, ApJS, 154, 193
- Warner et al. (1973) Warner P. J., Wright M. C. H., Baldwin J. E., 1973, MNRAS, 163, 163
- Wilson & Scoville (1991) Wilson C. D., Scoville N., 1991, ApJ, 370, 184
- Young (1999) Young J. S., 1999, in Barnes J. E., Sanders D. B., eds, Proc. IAU Symp. 186, Galaxy Interactions at Low and High Redshift, p. 217
- Young & Knezek (1989) Young J. S., Knezek P. M., 1989, ApJ, 347, L55