Author(s) in page-headRunning Head \Received2000/12/31\Accepted2001/01/01
techniques: interferometric — radio continuum: galaxies — galaxies: active — galaxies: quasars: individual (3C 138) — astrometry
Phase-reference VLBI Observations of the Compact Steep-Spectrum Source 3C 138
Abstract
We investigate a phase-reference VLBI observation that was conducted at 15.4 GHz by fast switching VLBA antennas between the compact steep-spectrum radio source 3C 138 and the quasar PKS 0528+134 which are about 4∘ away on the sky. By comparing the phase-reference mapping with the conventional hybrid mapping, we demonstrate the feasibility of high precision astrometric measurements for sources separated by 4∘. VLBI phase-reference mapping preserves the relative phase information, and thus provides an accurate relative position between 3C 138 and PKS 0528+134 of and (J2000.0) in right ascension and declination, respectively. This gives an improved position of the nucleus (component A) of 3C 138 in J2000.0 to be RA= and Dec= under the assumption that the position of calibrator PKS 0528+134 is correct. We further made a hybrid map by performing several iterations of CLEAN and self-calibration on the phase-referenced data with the phase-reference map as an input model for the first phase self-calibration. Compared with the hybrid map from the limited visibility data directly obtained from fringe fitting 3C 138 data, this map has a similar dynamic range, but a higher angular resolution. Therefore, phase-reference technique is not only a means of phase connection, but also a means of increasing phase coherence time allowing self-calibration technique to be applied to much weaker sources.
1 Introduction
The self-calibration algorithm for the interferometer visibility has proved to work well in the high signal-to-noise ratio (SNR) case. It uses the closure-phase relations to calibrate visibility phase, and then the absolute positional information is lost after the phase self-calibration. Furthermore, when the SNR is low, the visibility phases will have a large scatter. No signal can be detected if the SNR is below a flux limit imposed by the relatively short coherence time. Therefore, to study the structure of very weak radio sources we should take advantage of phase-reference mapping (Alef 1989). With the publication of the first phase-reference mapping from in-beam observations (Marcaide et al 1984) and from switched observations (Alef 1988), phase referencing technique has gradually become a powerful tool for imaging weak radio sources (Beasley & Conway 1995). This technique can hopefully work without additional atmospheric or ionospheric calibration measurements, because these effects can be well modelled from the observation of nearby, strong reference sources. The applicability of this technique relies on the fact that most of the instrumental and propagation effects are common for both reference and target sources which are sufficiently close on the sky. While hybrid mapping in VLBI provides information only about the relative position between different features in a given source, the phase-reference observations can provide precise position of the target source with respect to the external reference at sub-milliarcsecond accuracy (Ros 2004).
In this paper, we present a phase-reference VLBI study of the compact steep spectrum (CSS) source 3C 138. The target source 3C 138 (=4C 16.12=J0521+166), with a priori position of RA and Dec (J2000.0), is identified as a quasar with and (Hewitt & Burbidge 1989). The reference source was PKS 0528+134 which is a compact -ray-bright quasar, located at RA , Dec (J2000.0) and has a redshift . The angular separation of 3C 138 from PKS 0528+134 on the sky is about . In Sect. 2 we first describe the observations, and then present two new 15.4 GHz VLBI maps of 3C 138 obtained from the phase-reference related mapping. In Sect. 3 we compare and discuss maps made from three different methods, namely hybrid mapping, phase-reference mapping and a combination of phase-reference with CLEAN and self-calibration. From the phase-reference map, we also estimate the relative separation between the target source 3C 138 and the calibrator PKS 0528+134, from which an improved coordinate of 3C 138 is obtained. General conclusions are presented in Sect. 4.
2 Observations and Data Reduction
We carried out quasi-simultaneous VLBI observations of 3C 138 on 2001 August 20, using ten 25m VLBA antennas. The phase referencing observations at 15.4 GHz were interleaved with observations at three other frequencies (2.3, 5 and 8.4 GHz) at which no phase-referencing mode was adopted. The main purpose of the four quasi-simultaneous multi-frequency VLBI observations is to identify the center of activity of the CSS superluminal source 3C 138 (Shen et al. 2005). The phase-reference VLBA observation at 15.4 GHz was performed through a rapid switching between the target source 3C 138 and the reference source PKS 0528+134. The switching cycle time is 100s, consisting of 32s on PKS 0528+134, 8s for slewing antenna, 52s for 3C 138, and another 8s for slewing back antenna. Correlation was done at the VLBA correlator in Socorro, New Mexico (USA).
The post-correlation data reduction was performed in the NRAO AIPS and the Caltech Difmap packages. A priori visibility amplitude calibration was first made using system temperatures and gain curves from each antenna. We then picked up one high SNR scan of PKS 0528+134 to calibrate the instrumental delays and phase offsets between IF channels. VLBA-LA (Los Alamos at New Mexico) was used throughout as the reference station. Then we did fringe-fitting (FRING in AIPS) on the calibrator PKS 0528+134’s visibility data and mapped it with a peak-to-rms dynamic range of 1500 (see Fig. 1 of Cai et al. 2006).
Similarly, we also did a global fringe fitting to 3C 138 data directly in AIPS, and then made a hybrid map (see Fig. 2 of Shen et al. 2005) from the detected visibility data. Due to the weakness of the radio emission, we only detected fringes on the baselines to six of ten VLBA stations (FD, KP, LA, NL, OV, PT). We then averaged all channels within each IF and exported the data to Difmap. In Difmap, we first averaged the visibility data to a 20-second grid with the weights calculated from the scatter in the data. The averaged data were then phase self-calibrated with a point source model, followed by several iterations of CLEAN and phase-only self-calibration. We began with uniform weighting, and later switched to the natural weighting in order to reveal more extended structure. For amplitude calibration, we only made an overall constant gain correction to each station.
To investigate VLBI phase-reference observation, we further made two other maps using the phase-referenced data as described below.
2.1 Phase-reference Mapping
First it should be noted that PKS 0528+134 at 15.4 GHz is not an ideal point source (see Fig.1 of Cai et al. 2006). There is extended emission towards the north-east, which accounts for about 11% of the total integrated flux density at 15.4 GHz. In order to remove such structural phase effects from the reference source PKS 0528+134, all clean components in the hybrid map of PKS 0235+164 were fed back into the phase self-calibration process as an input model to refine the estimate of the antenna-based residuals. By applying to the 3C 138 data these resultant phase-like solutions determined from fringe-fitting the PKS 0528+134 data (after minimizing the structural effect), we obtained a set of phase-referenced data, which were then transferred into Difmap. These phase-referenced visibility data were time averaged, Fourier inverted and deconvolved (without any phase self-calibration) to produce the first phase-reference map of 3C 138 at 15.4 GHz (Fig.1 (a)).
2.2 Hybrid Mapping of the Phase-referenced Data
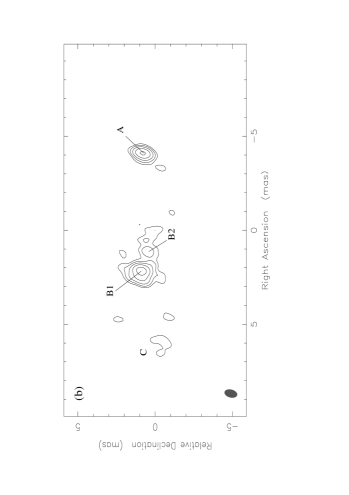
This time, after obtaining the phase-referenced visibility data, we further carried out phase self-calibration using the phase-reference map Fig.1 (a) rather than the point source model. Then we simply follow the standard self-calibration algorithm to produce a high-resolution 15.4 GHz VLBI map of 3C 138 (Fig.1 (b)).
3 Discussion
To yield a quantitative description of source structure exhibited in these maps, we fitted the visibility data with circular Gaussian components. The results are listed in Tables 1 and 2 along with some parameters of each map in Table 3.
3.1 Comparison of Three Maps
As the consequence of the coherence loss due to the temporal phase fluctuation and large angular separation between the target and reference sources, the phase-referenced map (Fig.1(a)) reveals only two brighter components (A and B1) of the four well detected VLBI components (A, B1, B2, and C) shown in the hybrid maps of 3C 138 by Shen et al. (2005). Even though, this clearly demonstrates the feasibility of high precision astrometric measurements for sources separated by 4∘. The central four VLBI components have also been consistently seen at 5.0 and 8.4 GHz in 2001 August (Shen et al. 2005), in good agreement with the 5.0 GHz linear polarization images in three epochs from 1998 September to 2002 October (Cotton et al. 2003).
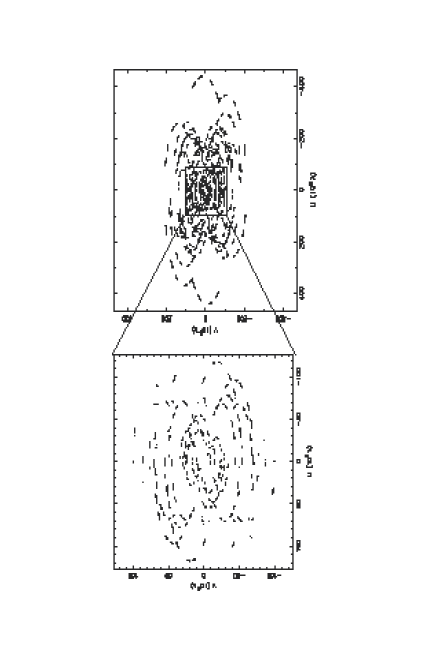
Direct global fringe-fitting on 3C 138 threw away a lot of visibility data that are below the SNR threshold, and thus are not used in the hybrid mapping. It should be noted that in the case of VLBI observation of 3C 138, most of these discarded data are on longer baselines because of the resolution effect. This results in a smaller uv-coverage (as shown in the left plot of Fig. 2) and thus a poorer spatial resolution, i.e., a larger beam (see Table 3). In contrast, the phase-referencing method would keep all the observational visibility data of the target source, i.e., preserve the uv-coverage. So the beam size of the phase-reference map Fig.1(a) stands for the full resolution of the whole data sets (shown in the right plot of Fig.2). And since the phase self-calibration process (SELFCAL) in Difmap can keep the uv-coverage even if the SNR is low, so the beam size in Fig.1(b) is essentially the same as that in Fig.1(a) (Table 3). The uv-coverage plots in Fig.2 (also refer to Table 3) reveal that the resolutions of Fig.1(a) and Fig.1(b) are about 4 and 2 times higher than that of Fig.2 of Shen et al. (2005) in right ascension and declination, respectively.
Moreover, because several iterations of phase self-calibration have been performed in making Fig. 1(b) from the phase-referenced visibility data, Fig.1(b) achieves a similar dynamic range as the hybrid map (Fig. 2 of Shen et al. 2005). It also clearly displays three compact components (A, B1, and B2) with a diffuse emission at the location of component C which is heavily resolved at a full resolution here. For a consistent check, we also made a hybrid map using the truncated phase-referenced data which have the same uv-coverage as that of Fig.2 of Shen et al. (2005), and eventually, a qualitatively similar image was obtained.
As can be seen in Table 3, both the peak flux density and dynamic range are the lowest in the phase-reference map (Fig.1(a)). This implies a coherence loss of about 84%, mainly due to the temporal phase fluctuation within each scan interval of 52 s for 3C 138. The coherence of an interferometer is a measurement of the phase stability of the entire system (Rogers and Moran 1981), it is the ratio of the time-integrated fringe amplitude to the instantaneous fringe amplitude (Linfield et al. 1989). Coherence losses anywhere in the system will degrade the SNR and cause a lower peak flux density. In addition, the large ( or so) angular separation of the target and reference sources will introduce some uncertainties in referencing the phases since the radiation from both sources may propagate through a slightly different medium. Furthermore, the inaccurate angular separation model in the correlator also limits the dynamic range of the phase-reference map.
3.2 Relative Position between 3C 138 and PKS 0528+134
There is an offset of the map center (0,0) from either of the detected compact VLBI components A and B1 in the phase-reference map Fig.1(a). This kind of offset has been also seen in many other phase-reference observations (Rioja & Porcas 2000; Alef 1988). This is mainly due to the deviation of the true separation between the target and the reference from the separation model adopted in the correlator. If the separation between the target and calibrator sources is exactly the same as the model used in the correlator, the offset would be zero. Therefore, by determining such kind of positional deviation from the phase-reference observation, we can obtain a more accurate correction to the relative position known at the correlator. It should be mentioned that although a similar offset is also seen in Fig.1(b), it cannot be used to estimate the relative position since some iterations of phase self-calibration have been invoked in the mapping process. The absolute positional information is not kept in the hybrid mapping (Fig. 2 in Shen et al. 2005) either, as the phase self-calibration has already done. The phase-reference map is the unique one that can be used to derive an accurate measurement of the absolute positional information.
Since both the reference source PKS 0528+134 and target source 3C 138 are non-point sources, it is necessary to determine the suitable reference points for the differential astrometric measurement of the separation between them. Based on the high-resolution spectra as well as the variability study, component A has been identified as the location of the central activity in 3C 138 (Shen et al. 2001; 2005), and thus will be used as a position reference point for 3C 138 in the following astrometric analysis. For the core-dominated blazar PKS 0528+134 (Cai et al. 2006), the peak of the compact core at the phase center is chosen as the reference point. Ideally, a reference point should correspond to the peak of a strong, unresolved component, which is well separated from other radio emission within the source structure (Rioja & Porcas 2000). As a result, the positional corrections to the correlator model of 3C 138 can be estimated from the position of reference feature (component A) in the phase-reference map (Fig. 1(a)), which are of mas and mas in right ascension and declination, respectively. Transforming the offset to the J2000.0 coordinates, we have and , respectively. Here, to convert the correction to right ascension in second, we have divided the correction to right ascension in mas by the factor 15cos, where is the mean declination of 3C 138 and PKS 0528+134 ().
The quoted standard errors are mainly associated with the uncertainties in determining the position of the peak in component A using the AIPS task JMFIT. For comparison, the errors due solely to the finite SNR of component A in 3C 138 are estimated to be 0.02 and 0.03 mas in right ascension and declination, respectively, from the expression in radians (Thompson, Moran & Swenson 1986) by choosing the equivalent baseline length D of 2 and 1.5 along E-W and N-S directions (see Fig. 3), respectively.
Taking into account the separation in the a priori coordinates of the correlator model ( (RA), (Dec)), we can obtain a revised separation of 3C 138 from PKS 0528+134 in J2000.0: and . By assuming there is no error in the a priori position of quasar PKS 0528+134, we can further derive an improved coordinate of the nucleus (component A) of 3C 138 to be:
RA(J2000.0)=
Dec(J2000.0)= .
However, it should be noted that errors caused by the incomplete known tropospheric delays, coupled with a large angular separation between the target and calibrator at lower elevations, could be a few times larger than those due to the identification of the centroid on the map. Such systematic errors can be greatly reduced by choosing a calibrator much closer to the target, or by using more than one calibrator in the vicinity of the target, with a weighting depending on their position with respect to the tagret, to determine the angular dependence of the phase (Fomalont 2005). The limitation of the single calibrator technique for such a not so closely spaced target-calibrator pair is quite apparent, as evident by a large phase decorrelation (see Sect. 3.1).
4 Conclusions
We report on a phase-reference VLBI study of the compact steep spectrum source 3C 138 at 15.4 GHz. The observation was conducted using the phase-referencing technique by fast switching between 3C 138 and the bright compact quasar PKS 0528+134.
The first phase-referenced map of 3C 138 was successfully made at 15.4 GHz, which demonstrates the feasibility of high precision astrometric measurements for sources separated by 4∘. This phase-reference VLBI map retains the relative phase information, and we have updated the relative position in J2000.0 between 3C 138 and PKS 0528+134 to be and , respectively. This provides an improved position of 3C 138 to be and (J2000.0) in right ascension and declination, respectively, under the assumption that there is no error in the position of the strong reference source PKS 0528+134.
By comparing the hybrid maps made from the visibility data with and without applying phase-reference technique, we found that both maps have a similar dynamic range, but the hybrid map from the phase-referenced data has a higher angular resolution since more visibility data are recovered. Therefore, the phase-reference technique is not only a means of phase connection, but also a means of increasing phase coherence time to improve the detection to much weaker sources.
We thank an anonymous referee for helpful comments on the earlier manuscript. This work is supported in part by the National Natural Science Foundation of China under grant 10573029, and sponsored by Program of Shanghai Subject Chief Scientist (06XD14024). Z.-Q. Shen acknowledges the support by the One-Hundred-Talent Program of Chinese Academy of Sciences.
References
- [1988] Alef, W. 1988, in IAU Symposium 129, ed. M. J. Reid, & J. M. Moran (Dordrecht: Kluwer) 523
- [1989] Alef, W. 1989, in Very Long Baseline Interferometry Techniques and Applications, ed. M. Felli and R.E. Spencer 1989, 97.
- [1995] Beasley, A. J. & Conway J. W. 1995, in ASP Conf. Ser. 82, Very Long Baseline Interferometry and the VLBA, ed. J. A. Zensus, P. J. Diamond & P. J. Napier (San Francisco: ASP) 327
- [2006] Cai, H.-B., Shen, Z.-Q., Chen, X. & Shang, L.-L., 2006, A&A (in press) astro-ph/0608240
- [2003] Cotton, W. D., Dallacasa, D., Fanti, C., Fanti, R., Foley, A. R., Schilizzi, R. T., & Spencer, R. E. 2003, A&A, 406, 43
- [2005] Fomalont, E. B. 2005, in ASP Conf. Ser. 340, Future Directions in High Resolution Astronomy, ed. J. D. Romney & M. J. Reid (San Francisco: ASP) 460
- [1989] Hewitt, A. & Burbidge, G. 1989, ApJS, 69, 1
- [1989] Linfield, R.P., Levy, G.S., Ulvestad, J. S., et al. 1989, ApJ 336, 1105
- [1989] Marcaide, J. M. & Shapiro, I. I., 1984, ApJ 276, 56
- [2000] Rioja, M. J. & Porcas R. W. 2000, A&A, 355, 552
- [1981] Rogers, A.E.E. & Moran, J.M. 1981, IEEE Trans., IM-30 (No. 4), 283
- [2004] Ros, E. 2005, in ASP Conf. Ser. 340, Future Directions in High Resolution Astronomy, ed. J. D. Romney & M. J. Reid (San Francisco: ASP) 482
- [2001] Shen, Z.-Q., Jiang, D. R., Kameno, S. & Chen, Y. J., 2001, A&A, 370, 65
- [2005] Shen, Z.-Q., Shang, L.-L., Cai, H.-B., Chen, X., Jiang, D. R., Chen, Y.-J., Liu, X., Yang, R., Kameno, S. & Hirabayashi, H. 2005, ApJ, 622, 811
- [1986] Thompson, A. R., Moran, J. M. & Swenson, G. W., 1986, In: Interferometry and Synthesis in Radio Astronomy, Wiley-Interscience (New York), 400
| Map ID | A | B1 | B2 | C | ||||
|---|---|---|---|---|---|---|---|---|
| Fig.1 (a) | 6.84 | 49.20 | ||||||
| Fig.1 (b) | 30.88 | 65.14 | 21.36 | |||||
| Fig.2 in Shen et al. (2005) | 26.50 | 66.86 | 24.10 | 11.26 |
| Map ID | B1 | B2 | C | |||
|---|---|---|---|---|---|---|
| (mas, ∘) | (mas, ∘) | (mas,∘) | ||||
| Fig.1 (a) | 6.28, 89.0 | |||||
| Fig.1 (b) | 6.33, 88.8 | 4.88, 94.2 | ||||
| Fig.2 in Shen et al. (2005) | 6.36, 89.9 | 4.93, 94.3 | 9.51, 99.6 |
| Map ID | restoring beam | rms noise | peak | dynamic | ||||
|---|---|---|---|---|---|---|---|---|
| (mas mas, deg) | (mJy/beam) | (mJy/beam) | range | |||||
| Fig.1 (a) | , 9.67 | 0.736 | 5.7 | 7.7 | ||||
| Fig.1 (b) | , 9.91 | 0.439 | 35.1 | 80.0 | ||||
| Fig.2 in Shen et al. (2005) | , 20.9 | 0.631 | 62.5 | 99.0 |