Environmental Dependence of Properties of Galaxies
in the Sloan Digital Sky Survey
Abstract
We investigate the dependence of physical properties of galaxies brighter than in the Sloan Digital Sky Survey (SDSS) on environment, as measured by local density using an adaptive smoothing kernel. We find that variations of galaxy properties with environment are almost entirely due to the dependence of morphology and luminosity on environment. Because galaxy properties depend not only on luminosity but also on morphology, it is clear that galaxy properties cannot be determined solely by dark halo mass. When morphology and luminosity are fixed, other physical properties, such as color, color-gradient, concentration, size, velocity dispersion, and star formation rate, are nearly independent of local density, without any break or feature. The only feature is the sharp decrease of the late type fraction above the critical luminosity of about in the morphology versus luminosity relation. Weak residual dependences on environment include that of the color of late types (bluer at lower density) and of the - relation of early types (larger dispersion at higher density for bright galaxies). The fraction of galaxies with early morphological type is a monotonically increasing function of local density and luminosity. The morphology-density-luminosity relation, as measured in this work, should be a key constraint on galaxy formation models. We demonstrate that the dependence on environment of the morphology of galaxies originates from variations in density on effective Gaussian smoothing scales much smaller than Mpc. We find that galaxy morphology varies both with density measured on an effective Gaussian smoothing scale of Mpc and with distance to the nearest bright galaxy, particularly when the distance is about 0.2 Mpc. We propose as a mechanism that the morphology of galaxies in galaxy systems is transformed by the tidal force.
Subject headings:
galaxies:clusters:general – galaxies:evolution – galaxies:formation – galaxies:fundamental parameters – galaxies:general – galaxies:statistics1. Introduction
The origin of the morphology of galaxies is one of the mysteries of galaxy formation. Recently, there has been a great deal of effort to understand the origin of morphology by inspecting dependences of galaxy properties on environment. This line of study dates back to the 1930’s (e.g. Hubble & Humason 1931) when it was realized that clusters were dominated by ellipticals and lenticulars and that environmental factors played an important role in determining the morphology of galaxies. Oemler (1974) found the morphology-radius relation; the late type galaxy fraction decreases with radius within a cluster. This relation was confirmed by Dressler (1980) who argued that the fraction of morphological types is a function of local galaxy density. Postman & Geller (1984) extended this morphology-density relation down to the group environment. Gunn & Gott (1972) argued that S0 galaxies in great relaxed clusters like Coma were the result of spirals being stripped of gas by ram pressure stripping due to hot intra-cluster gas. Gott & Thuan (1976) argued that elliptical galaxies were produced by larger initial density fluctuations which would have higher density at turn-around and where star formation would be completed before collapse. Such larger initial density fluctuations would be more likely in a region that would later turn into a high density environment.
Environmental dependences of galaxy properties other than morphology have also been studied extensively. Recently, as large galaxy redshift surveys like the Two Degree Field Galaxy Redshift Survey (2dFGRS; Colless et al. 2001) and the Sloan Digital Sky Survey (SDSS) have been completed, extensive studies have been made to accurately measure the environmental effects on various physical properties of galaxies (Goto et al. 2003; Balogh et al. 2004a,b; Rojas et al. 2004, 2005; Hoyle et al. 2005; Blanton et al. 2005a; Croton et al. 2005; Tanaka et al. 2005; Weinmann et al. 2006; Boselli & Gavazzi 2006; among many others). Works done by others on similar topics will be discussed in each section below when the dependence of each of physical properties of galaxies on environment is studied. The observed environment-galaxy property relations provide only indirect clues to the origin of morphology, but they certainly are important constraints on models for the physics of galaxy formation.
In a companion paper we study the relations among various physical properties of galaxies in the SDSS spectroscopic sample (Choi et al. 2006, hereafter Paper I). In this paper we extend our work to the environmental dependence of the physical parameters. We accurately measure the morphology-density-luminosity relation from a series of volume-limited samples drawn from the SDSS. We also use morphological subsets of early and late type galaxies to measure the dependences of various physical properties of galaxies on environment once the morphology and luminosity are fixed. By studying the environmental dependence at different smoothing scales, we address the important question of whether galaxy morphology depends primarily on the large-scale environment in which the galaxy initially formed or on a smaller scale environment that may reflect the influence of later evolutionary effects such as galaxy-galaxy interactions.
2. Observational Data Set
2.1. Sloan Digital Sky Survey Sample
We use a large-scale structure sample, DR4plus, of the SDSS (York et al. 2000; Blanton et al. 2003a; Fukugita et al. 1996; Gunn et al. 1998, 2006; Hogg et al. 2001; Ivezić et al. 2004; Lupton et al. 2001; Pier et al. 2003; Smith et al. 2002; Stoughton et al. 2002; Tucker et al. 2006) from the New York University Value-Added Galaxy Catalog (NYU-VAGC; Blanton et al. 2005b). This sample is a subset of the recent SDSS Data Release 5 (Adelman-McCarthy et al. 2007). Our major sample of galaxies used here is a subset of the large-scale structure DR4plus (LSS-DR4plus) sample referred to as “void0,” which includes the Main galaxies (Strauss et al. 2002) with apparent magnitudes in the range For the approximately 6% of targeted galaxies that lack a measured redshift because of fiber collisions, we assign the redshift of the nearest neighbor.
Completeness of the SDSS is poor for bright galaxies with because of spectroscopic selection criteria (which exclude objects with very large flux within the fiber aperture) and difficulties of automatically measuring photometric properties of very extended sources. Due to the magnitude limits of the void0 sample, the full range of magnitude of the sample is only at a given redshift, and is even smaller than that in the case of a volume-limited sample with a finite range in redshift. As described in detail in section 2.1 of Paper I, we add the missing bright galaxies and thereby extend the magnitude range by using various existing redshift catalogs which we match to the SDSS data. In total, 5195 bright galaxies are added to the void0 samples, which means our whole sample includes 317533 galaxies within our angular sample boundaries (see Fig. 1). Volume-limited samples derived from the resulting catalog have nearly constant comoving number density of galaxies in the radial direction for redshifts . We treat our final sample as effectively having no bright limit at redshifts greater than . More details about this sample can be found in Paper I.
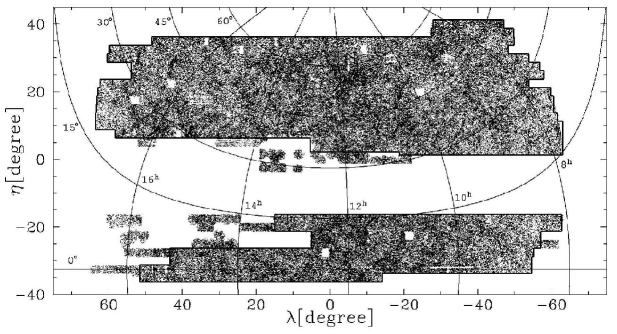
2.2. Volume-limited Samples
To study the effects of environment on galaxy properties it is advantageous for the observational sample to have the lowest possible surface-to-volume ratio, to minimize the boundary effects (see Park et al. [2005] regarding similar effects in topology analysis). For this reason we trim the DR4plus sample as shown in Figure 1, in which gray lines delineate our sample boundaries in the survey coordinate plane [(); Stoughton et al. 2002]. There are also three stripes in the Southern Galactic Cap observed by SDSS that we do not use because of their narrow angular extent. These cuts leave approximately square deg2 in the survey region. Within our sample boundaries, we account for angular variation of the survey completeness by using the angular selection function defined in terms of spherical polygons (Hamilton & Tegmark 2004), which takes into account the incompleteness due to mechanical spectrograph constraints, bad spectra, or bright foreground stars. We make two arrays of square pixels of size in the () sky coordinates covering our analysis region, and store the angular selection function calculated using the MANGLE routine (Hamilton & Tegmark 2004). At the location of each pixel, the routine calculates the survey completeness in a spherical polygon formed by the adaptive tiling algorithm (Blanton et al. 2003a) used for the SDSS spectroscopy. The resulting useful area (with nonzero selection function) within the analysis regions is 1.362 sr. In our study we use only volume-limited samples of galaxies, defined by absolute magnitude and redshift limits as shown in Figure 3 of Paper I. In addition to the volume-limited samples, labeled D1 to D5, which are used to study the environmental effects, we also use the galaxy (LS) sample. The LS sample is designed to include ‘typical’ galaxies (), and covers the full range of comoving distance, from to 314.0 Mpc, in which our analysis is made. All measurements of local density in this paper use the LS sample to define the local environment (see section 3). The definitions for all samples are summarized in Table 1.
We analyze our samples in the survey coordinate frame, and the Cartesian coordinates are chosen to be
| (1) |
The -axis is at the center of the survey coordinate and radially outward, the -axis is toward the direction, and the -axis is at the direction.
| Name | Absolute Magnitude | Redshift | Distance aaComoving distance in units of Mpc | Galaxies | ccMean separation of galaxies in units of Mpc |
|---|---|---|---|---|---|
| D1 | 20288 (6256) | 3.41 | |||
| D2 | 32543 (11341) | 3.78 | |||
| D3 | 49571 (19270) | 4.18 | |||
| D4 | 74688 (33039) | 4.58 | |||
| D5 | 80479 (39333) | 5.56 | |||
| LS | 66176 (30715) | 5.94 |
2.3. Physical Parameters of Galaxies
The physical parameters considered in this study are absolute Petrosian magnitude in the -band , morphology, color, Petrosian radius, axis ratio, concentration index, color gradient in color, velocity dispersion, and equivalent width of the H line. The -band absolute magnitude is the AB magnitude converted from SDSS magnitudes. To compute colors, we use extinction (Schlegel et al. 1998) and -corrected model magnitudes. The superscript 0.1 means the rest-frame magnitude -corrected to redshift of 0.1 (Blanton et al. 2003b). This makes galaxies at have -correction of , independent of their spectral energy distributions (SEDs). All of our magnitudes and colors follow this convention, and the superscript will be subsequently dropped. We also drop the term in the absolute magnitude. We use the luminosity evolution correction of (Tegmark et al. 2004).
We employ the - and -band atlas image and basic photometric parameters measured by the Princeton/NYU group 111http://photo.astro.princeton.edu to measure the key physical parameters of the 317,533 galaxies in our sample. The color gradient is given by the color difference between the region with and the annulus with , where is the Petrosian radius. We use the isophotal position angle, the seeing-corrected isophotal axis ratio in the -band, and elliptical annuli in all parameter calculations to take into account flattening or inclination of galaxies. The (inverse) concentration index, , is defined as where and are the radii from the center of a galaxy containing 50% and 90% of the Petrosian flux in the -band, respectively. The color gradient and concentration index are corrected for the effects of seeing using Sersic model fits of the - and -band images as described in Paper I. We choose the concentration index as a measure of surface brightness profile because the Sersic indices measured from SDSS images are quite inaccurate except for large bright galaxies with , due to the relatively large seeing() of the SDSS. If the profile fit is made by avoiding the central part of galaxy images, which is much affected by the seeing, the seeing effects on the Sersic index can be reduced but the fit becomes more unreliable due to the smaller fitting interval and noisier profile. In contrast, by definition is insensitive to the surface brightness profile near the galaxy center within radius of . Our seeing-corrected concentration index seems accurate because it shows no dependence on either redshift or seeing.
We classify morphological types of galaxies using the prescription of Park & Choi (2005). Galaxies are divided into early (ellipticals and lenticulars) and late (spirals and irregulars) types based on their locations in the versus color gradient space and also in the concentration index space. The resulting morphological classification has completeness and reliability reaching 90%, as claimed by Park & Choi (2005). When photometry is excellent and galaxy images are well-resolved, more information from surface brightness fluctuations can be added for morphology classification. But this is certainly not the case near the faint limit () of the SDSS sample we use. For the volume-limited sample D2 we perform an additional visual check of the color images of galaxies to correct misclassifications by the automated scheme for about blue early types (those below the straight line in Fig. 7 of Paper I) and red late types (those with color redder than 2.4). The morphological types of 1.9% of galaxies, which are often blended or merged objects, are changed by this procedure.
We use Petrosian radius to represent the physical size of galaxies. The Petrosian radii in our analysis, calculated by using elliptical annuli, are usually larger than those in the DR5 catalog, which adopted circular annuli. The angular size is converted to a physical size in units of kpc from the redshift assuming a CDM universe with and .
The stellar velocity dispersion of SDSS galaxies is measured by an automated pipeline called IDLSPEC2D version 5 (D. J. Schlegel et al. 2007, in preparation). Galaxy spectra of SDSS galaxies are obtained by optical fibers with angular radius of . The finite size of the sampled light smooths the central velocity dispersion profile. To correct the central velocity dispersion for this smoothing effects we have adopted a simple aperture correction formula (Jørgensen et al. 1995; Bernardi et al. 2003a), where is the equivalent circular effective radius and is the seeing-corrected effective angular radius in the band.
3. Local Density Estimation
To find relations between intrinsic physical properties of galaxies and their environment we require a well defined and robust measure of environment. We seek to use an environmental parameter that is defined directly from observational data, is continuous, and characterizes the full range of galaxy environments, from the most massive clusters to voids. The local number density of galaxies at a given smoothing scale is such an example and will be the environmental parameter in our study. Local density gradient and shear can be also used to define environment, but will be considered in later studies. Our choice excludes parameters like the discrete environmental types such as cluster, group, or field. Assignment of galaxies to such environmental types are arbitrary to some extent and can be constructed based on continuous parameters when desirable.
Local density estimation depends on the shape and size of the smoothing kernel. We adopt the spline kernel with adaptive smoothing scale, to include a fixed number of galaxies within the kernel weighting. This adaptive smoothing kernel is often used in smoothed particle hydrodynamics simulations. We use the spline kernel because it is centrally weighted, unlike TopHAT or cylindrcal, and has a finite tail, unlike the Gaussian. The spline kernel was first used to estimate the local galaxy density by Park et al. (1994) who demonstrated that the under-dense regions in the Center for Astrophysics (CfA) survey lack bright galaxies, indicating an environmental dependence of the luminosity function (LF). Details of our method to calculate the local density using the spline kernel are summarized by C. Park et al. (2007, in preparation), who demonstrate that the smooth density field constructed by the spline kernel in redshift space recovers the real space density field much better than the cylindrical kernel at low- and intermediate-density regions. The local density of galaxies sitting at very high density regions and with large peculiar velocities (i.e. those appearing at the tips of fingers-of-god in redshift space) is better measured by the cylindrical kernel, but the fraction of such galaxies is very small.

Because this smoothing kernel is adaptive, it has the important feature that it does not oversmooth dense regions, thereby blurring the “walls” into the “voids.” Cosmological simulations clearly show that the transition from the interior of large cosmic voids, which have nearly constant density, to the denser structures, defined by filaments and clusters, is quite abrupt. Maps of the observed redshift space distribution of galaxies support this picture (see Fig. 3, below). An adaptive smoothing kernel, such as the one we employ, better preserves that property of the galaxy distribution than a kernel with a fixed smoothing length or with an infinite tail.
On the other hand, the adaptive nature of the smoothing kernel potentially complicates the interpretation, because the physical smoothing scale systematically varies with environment, from a small smoothing scale in clusters to a very large smoothing scale in voids. However, the relationship between environment and smoothing scale is nearly monotonic and, unlike fixed-scale methods, the adaptive kernel has the advantage that the S/N for estimating density is more uniform.
We define the local density at a position in space as the spline kernel-weighted number density of galaxies surrounding that position. In every case we use the volume-limited LS sample of galaxies with absolute magnitudes for local density estimation. In this way the local density has a clear meaning, and it becomes possible to compare the local densities of galaxies in different volume-limited samples sitting at different radial distances. The number of galaxies required within the smoothing volume is set to , which we find is the smallest number yielding good local density estimates. Unless otherwise stated, ; below we also examine results with when studying larger scales.
When searching for the spline radius containing the required number of galaxies, the smoothing volume can hit the sample boundaries or masked regions due to bright stars or galaxies. In addition to this trouble, the angular selection function varies across the sky even within the survey region. We first check if the location in which the local density is being measured is within the survey area, and then ignore the survey geometry and angular selection function to search for the nearest 20 galaxies in the LS sample in order to find the spline radius and thus the local density. We then randomly throw 1000 test particles into the spline radius around the location, and calculate the sum of normalized weights of the test particles assigned by the spline kernel, the angular selection function, and the radial boundaries. The final local density is given by the first estimate divided by the sum of weights. Our results use only those local density estimates for which the correction factor is smaller than 2.
The size of the spline kernel can be related with the effective Gaussian smoothing scale using the fact that the effective smoothing volumes are and for spline and Gaussian smoothings. The result is . In the case of galaxies in Sample D3, we find the median values and 68% limits of are and or the effective and when and 200 are used, respectively. The corresponding distributions of the local density and the effective Gaussian smoothing length are shown in Figure 2.
4. Environmental Dependence of Physical Parameters
4.1. Morphology
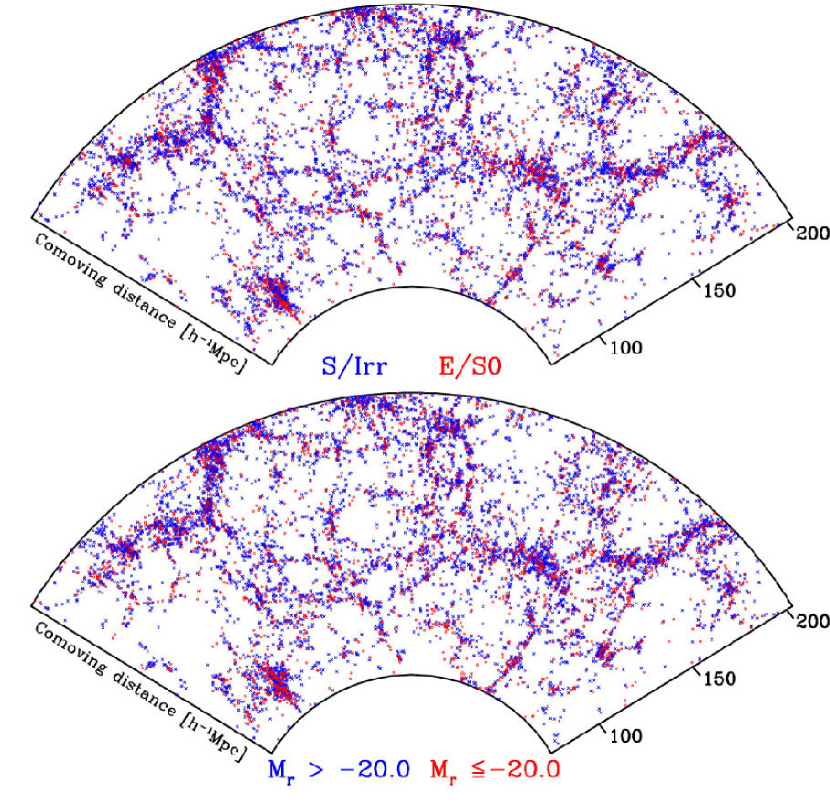
The morphology-luminosity relation has been examined in Paper I. In this paper we examine this relation as a function of local density environment, using our adaptive smoothing to label regions of space. The upper panel of Figure 3 shows the distribution of early (red) and late (blue) type galaxies in the D3 sample in a wedge defined by and in region 2 (see Fig. 1) of the SDSS. The bottom panel shows the same galaxies, but distinguished by their absolute magnitudes; bright galaxies with are red and fainter galaxies with are blue.
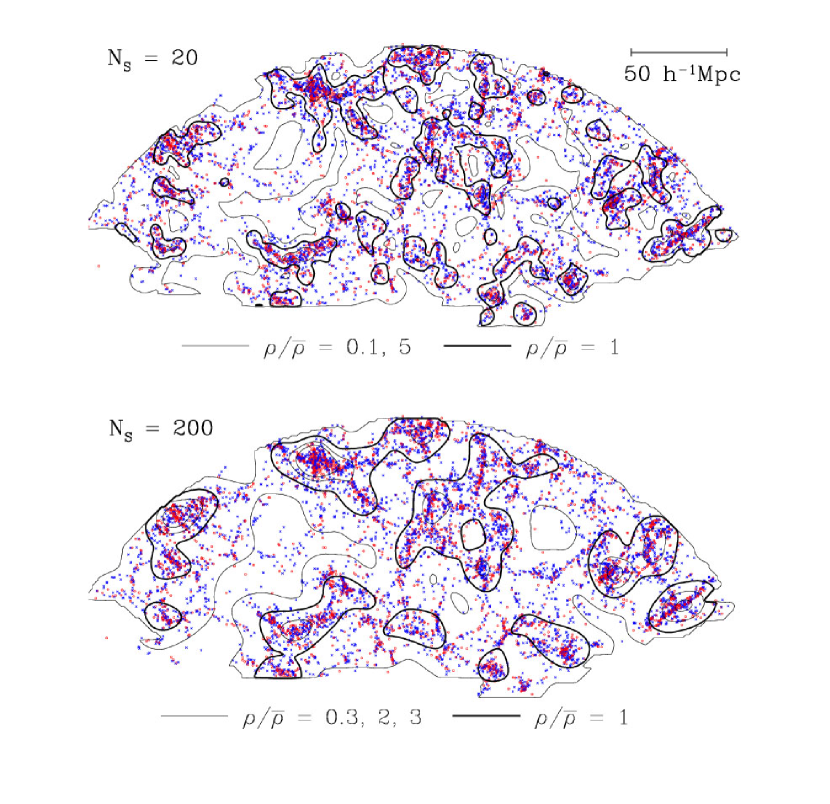
Figure 4 shows distribution of galaxies in a slab with constant thickness of Mpc that cuts through region 2. Overlaid are isodensity contours estimated from the local densities on a uniform grid through the middle of the slab. The upper and lower panels use the local density calculated using the nearest and galaxies, respectively. This comparison is made to study the dependence of environmental effects on scale in section 5. Contours delineate isodensity regions of galaxies. The thin lines mark the regions where the local density is or 0.1 for and , 2, or 3 for , respectively. The thick curves correspond to the local density equal to the mean density of the galaxies, which is measured to be . We clearly see that early types prefer high-density regions, while late types are more uniformly distributed. Note carefully that the galaxies plotted are brighter than while the density field is determined by galaxies. Throughout this paper we use the LS sample to estimate local density, regardless of which volume-limited sample is being examined.
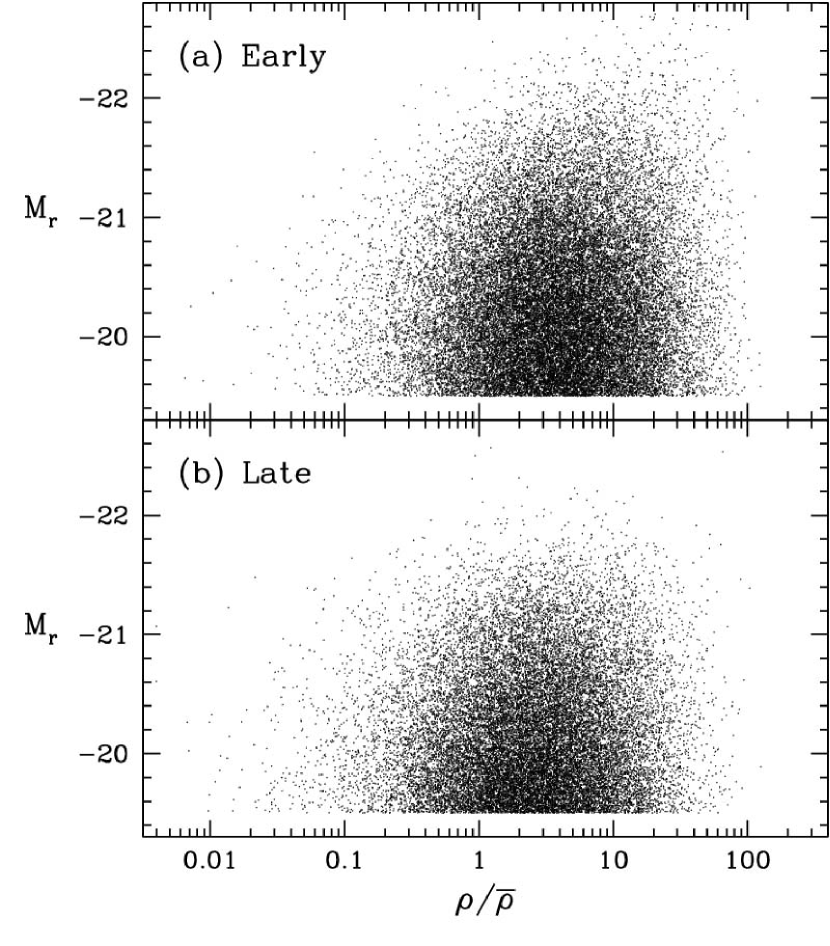
Figures 5 and 6 present the morphology-density-luminosity relation of SDSS galaxies. Figure 5 shows the fraction of early type galaxies as a function of local density when the absolute magnitude is fixed. We first remove late type galaxies in each sample whose seeing-corrected -band isophotal axis ratio is in order reduce the internal absorption effect on absolute magnitude (cf. Paper I).

We then bin galaxies in the absolute magnitude versus local density space. The bin size in this two-dimensional parameter space is and . We measure the fraction of early type galaxies, the median local density, and the median absolute magnitude of galaxies belonging to each bin, taking into account the fact that we have excluded some fraction of late type galaxies. When we measure the fraction of early type galaxies, we need to know the number of early and late type galaxies. Since we are only using late types with , we should infer the total number of late types given the number of those with . Some late types with must have dropped out of the volume-limited sample due to the internal absorption. In Paper I we showed that the correction factor can be reasonably made using the factor found in the faintest volume-limited sample of galaxies with . The error bars are estimated from 16 random subsets of galaxies.
We find that the early type fraction is a monotonically increasing function of local density at fixed luminosity. It is surprising to find that this monotonic dependence holds over 3 orders of magnitude in local density, from the highest down to the lowest density we explore, and in every luminosity bin. The early type fraction falls well below 20% at extreme low densities. This late type dominance at low density is particularly true for fainter galaxies. To test for the effects of the finite bin size in and on the relation we also examine the relation using smaller bin sizes. The thin solid line between the lines of and is the morphology-density relation of galaxies in the sample with a median magnitude of using the bin sizes and . The amplitude and slope of the relation is quite consistent with those for which larger bin sizes are used; thus, our results are not affected by the finite bin sizes. We also examine the effects of including those galaxies whose redshifts are borrowed from the nearest galaxy with redshift within , and find that the dependences of morphology fraction on density and luminosity are essentially the same.
Our results on the morphology-density relation are consistent with, and extend to a larger range of density and luminosity, the findings of several earlier investigators. For example, in studies limited to rich cluster environments, Oemler (1974) and Dressler (1980) found higher fractions of E and S0 types (both classified as “early type” here) in the centers of clusters. Subsequent investigations have verified and refined the understanding of this effect. As originally noted by Postman & Geller (1984) and by a number of more recent investigators (Lewis et al. 2002; Goto et al. 2003; Balogh et al. 2004a; Weinmann et al. 2006; Quintero et al. 2007) this segregation is not limited to rich clusters, but occurs in poorer groups as well. Figure 5 reflects this fact in the strong dependence of the early type fraction on density even at the lowest densities. The dependence of the early type fraction on absolute magnitude, even at fixed density, has been previously noted (Balogh et al. 2004b; Kauffmann et al. 2004; Hogg et al. 2004). As we will discuss later in more detail, the dependence of the late type subclass on density has also been seen as a slight dependence of the median blue sequence color on environment (Balogh et al. 2004b; Blanton et al. 2007). The main difference between our results here and these previous studies is that most of the previous studies use either visual classification or use simple classifications according to optical color. Although our classification system is related to broadband optical color, using the color gradients and concentrations yields a cleaner sample morphologically, bridging the gap between the studies based on visual classification and those based on purely color classification. Another important difference is the use of spline kernel to define local density. The cylindrical kernel, which is frequently used in past studies (Goto et al. 2003), is very noisy and cannot distinguish among low density regions well while the local density estimated by the spline kernel holds a good tight correlation with the true density field down to extreme void environments (C. Park et al. 2007, in preparation).
Figure 6 presents the morphology-density-luminosity relation in a different way. Here we find that the early type fraction is a monotonically increasing function of luminosity at a given local density. In slightly over-dense regions, where the statistics are very good, it can be clearly seen that the early type fraction rises abruptly at magnitudes brighter than (see also Fig. 9 of Paper I). The slope of the - relation also has a break at a similar magnitude (see Fig. 14, below). This may imply that many early type galaxies more than about 1 mag brighter than have origins that are different from fainter ones.
It is remarkable that the early type fractionabsolute magnitude relation has similar slope for galaxies with local density ranging over nearly 3 orders of magnitude. At intermediate magnitudes, near , the early type fraction is well described by the morphology-density-luminosity formula
| (2) |
over the whole density range explored. At magnitudes fainter than about the local density dependence monotonically steepens at high density, but becomes weaker in under-dense regions (see two bottom curves of Fig. 5. A result of this is that in very high density regions the early type fraction decreases less steeply at fainter magnitudes than it does at lower densities (see the top curve of Fig. 6). Balogh et al. (2004b) measured the fraction of the red population of galaxies within fixed absolute magnitude bins as a function of projected local density adopted by Balogh et al.(2004a). Even though galaxies are divided by a different criterion and the local density measure is different, the local density dependence they found is qualitatively quite similar. We emphasize that it is important to exclude highly inclined galaxies in this analysis. Otherwise, the number of late type galaxies brighter than is significantly underestimated, and the slope of the early type fraction versus absolute magnitude relation is systematically biased high at bright magnitudes.

Next we look for dependence of subclasses of late type galaxies on environment. Subclass classification of late type galaxies can be made in the color-color gradient space. We divide the late type galaxies into two subclasses; late late types with and early late types with . This divides late type galaxies roughly into those of Sc type and later and those earlier than Sc, respectively (Park & Choi 2005).

The bin sizes are again and , and only the late types with axis ratio greater than are used. In Figure 7 we find that the fraction of late spiral types with color bluer than increases strongly as the luminosity decreases. This can be easily understood from the color-luminosity relation of late type galaxies (see Fig. 3 of Paper I). This figure also shows that the late spiral population increases in low density regions for bright spirals, in particular. Even though our sub-spiral class division is very crude, it can be seen that the sub-type of spiral galaxies does depend on local density at fixed luminosity.
4.2. Luminosity
Figure 8 shows the dependence of luminosity of galaxies in the D4 sample on the local density. The upper panel is for the early types and the lower is for the late types with . It is clear that high density regions contain very bright galaxies while low density regions do not. This indicates that there are systematic effects of local density on the maximum luminosity that can be expressed by a change of luminosity function. This environmental dependence of the luminosity function was found by Park et al. (1994) in the CfA redshift survey data, and is now confirmed by the SDSS data over 4 orders of magnitude of local density. Also evident in Figure 8 is that this local density dependence of luminosity is stronger for the early type galaxies. The dependence is weaker but can be still observed for the late types.
The distribution of galaxies in the vertical direction at a given local density in Figure 8 reflects the environment-dependent luminosity function
which we plot in Figure 9.

The top points and curve are the luminosity function measured from the D4 sample () and its best-fit Schechter function, respectively. Curves lying below are the luminosity functions of galaxies located in bins of different local density, normalized to the whole volume of D4, so that the sum of these curves gives the total luminosity function. We exclude late type galaxies with in the LF measurements to reduce the bias due to the internal absorption, and we weight the remaining late types by the inverse of their fraction. The LF at the highest density (lower solid line with open circles) extends to magnitudes much brighter than those reached by the LF in the lowest density environment (dotted line with triangles), in agreement our qualitative conclusion from Figure 8. To answer the question of whether or not the dependence of the LF of galaxies on local density is due simply to the dependence of morphology fraction on local density or to a change of the shape of the LF, we normalize the LFs at the faint end and compare their shapes. In each density bin used in Figure 9 we divide galaxies into early and late type groups, and recalculate their LFs. Figure 9 and 9 show that the shape of the LF of each morphological type does change as a function of local density. In particular, the LF of early types is more sensitive to environment than that of late types. Therefore, the local density dependence of the LF is due both to the change of the early type fraction and that of the shape of the LF of each morphological type.
The visual results of Figure 9 can be quantified by comparing the best-fit Schechter function parameters. We divide the galaxies in the D3 sample () into late and early types and into seven different local density bins. The solid lines with filled circles in Figure 10 are the Schechter function parameters (upper panel) and (lower panel) when the morphology subsets are combined.

We use the MINUIT package of the CERN program library222 http://wwwasdoc.web.cern.ch/wwwasdoc/minuit/minmain.html to estimate the parameters by the maximum likelihood method. The estimated Schechter function parameters are listed in Table 2. The solid line with open circles and the dashed line with crosses in Figure 10 are those of early and late types, respectively. The luminosity of early type galaxies as measured by the characteristic absolute magnitude, , starts to rise steeply for local density above the mean density while that of late types rises below the mean density, stays more or less constant at intermediated density, and then rises again in high density regions. Previous work has also found that the high-luminosity turnover in the luminosity function strongly depends on local density or cluster richness (e.g., Lumsden et al. 1997; Driver et al. 1998; Marinoni et al. 2002; De Propris et al. 2003; Balogh et al. 2004a; Hoyle et al. 2005; Popesso et al. 2005; Zandivarez et al. 2006). Croton et al. (2005) measured the Schechter function parameters for early and late type galaxies in the 2dFGRS. Contrary to Croton et al., we find that for early types is changing slowly below the mean density and that luminosity for late types rises at high density (). The difference seems to be due to difference in morphology classification. They used a morphological classifier based on fiber spectra of galaxies. Morphology classifiers based simply on total color or spectrum tend to misclassify red spirals into early type, and blue ellipticals into late type. The color gradient and concentration constraints in our morphological classification strongly reduce such misclassifications. Another important difference in our analysis is the exclusion of inclined () late type galaxies. When they are included, the number of relatively fainter galaxies is overestimated because many of the inclined galaxies are actually bright, but appear fainter due to internal absorption. In particular, this systematic effect of internal absorption makes the parameter of late types more negative and makes the of late types appear fainter. The rise of the characteristic luminosity of late types in high-density regions would not be detected unless the bright red spirals, which are abundant at high density, are correctly classified and the internal absorption effects are eliminated.
The faint-end slope, , does not show a monotonic behavior for late type galaxies, consistent with the results of Hoyle et al. (2005) and Croton et al. (2005). It is interesting that for early types decreases (steeper faint end slope) at local density both below and above the mean. At local density near the cosmic mean, the early type LF has an exceptionally flat faint end slope: . Detection of this behavior requires careful morphological classification, because faint early type galaxies reside predominantly not only in massive halos (which prefer high density environment) but also in low mass halos present in under-dense regions. The latter tend to be fainter bluer early type galaxies that are correctly classified by our morphological classifier. If galaxies were classified by color or their spectral properties alone, these blue early types would have been classified as late types. We emphasize again that the major differences between our analysis and the previous ones lie in the morphological classification and exclusion of highly inclined late type galaxies, as well as the new local density estimator. On the other hand, one should be cautious about the selection bias when the abundance of different species of galaxies are compared. In the case of the SDSS catalog there might be some bias due to the fact that some very low surface brightness galaxies are missed.
The Schechter function parameters are measured from our volume-limited samples with magnitude limits of . In Figure 9 we used the D4 sample () to better see the behavior of the bright tail of the LF, and in Figure 10 the D3 sample () was adopted because this sample has the minimum uncertainties when both and are concerned. However, these samples whose ranges in absolute magnitude are only about 1 mag below , are not really proper for giving accurate estimates of . The limited range in absolute magnitude also develops some correlation between the estimates of and . This is particularly so at low density, where is fainter, and for late types for which the faint end slope of the LF is steeper. We compare the local density dependences of LF parameters measured from all five volume-limited samples with one another to see the effects of finite magnitude range. In Figure 10 the results from the D2 sample () are plotted as symbols without connecting lines for a comparison. We confirm that the behaviors of of early and late type galaxies as a function of local density were basically the same for all samples. It was also true for the parameter of early types. However, the dependence of of late types on local density showed the systematic trend that became more negative as the faint limit of the sample became fainter. In order to measure of late types accurately, one needs to use fainter galaxies, and for a flux-limited sample this makes one rely exclusively on the very close faint galaxies. It should be noted that the nearby universe is a relatively under-dense part of the universe, and that the resulting parameters can be also biased due to the local density dependence of the LF. Dependence of on environments is still a matter of some debate (e.g., de Propris et al. 1995; Secker et al. 1997; Valotto et al. 1997, 2001; Trentham 1998; Andreon & Cuillandre 2002; Popesso et al. 2006).
4.3. Color
It is well known that galaxy colors are redder in regions of higher local density (Hogg et al. 2004; Blanton et al. 2003c; Tanaka et al. 2004). In this section we show this trend is dominated by the dependence of color on luminosity and morphology. For this purpose it was necessary to examine the dependence of color on local density when both morphology and luminosity are fixed. We use color in this work because it is a measure of the star formation activity of galaxies in the recent past. The top panels of Figure 11 show scatter plots of color of early (left panels) and late (right panels) type galaxies in the D2 sample whose absolute magnitudes are between and (the median magnitude is ). The thick blue solid lines delineate the most probable (mode of the distribution of color at fixed absolute magnitude and at fixed local density interval) color of early types and the median color of late types. Late type galaxies with axis ratios are again excluded. The short-dashed green lines are the most probable (early) and median (late) colors of galaxies with . The corresponding scatter plots are not shown to avoid confusion. The long-dashed magenta line and the red solid line are for galaxies in magnitude bins of and with median magnitudes of , and , respectively.
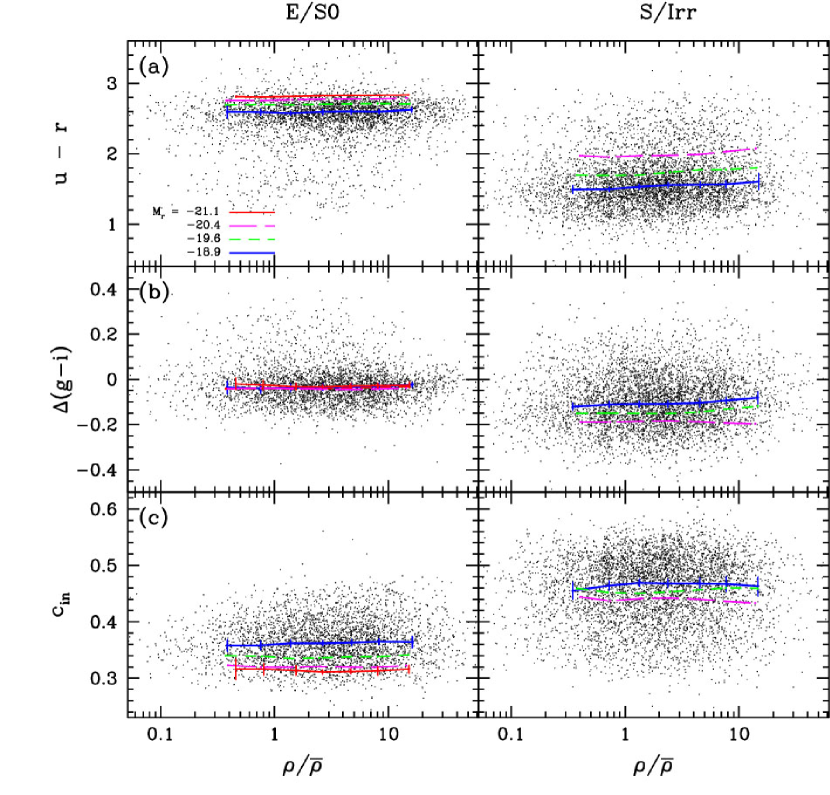
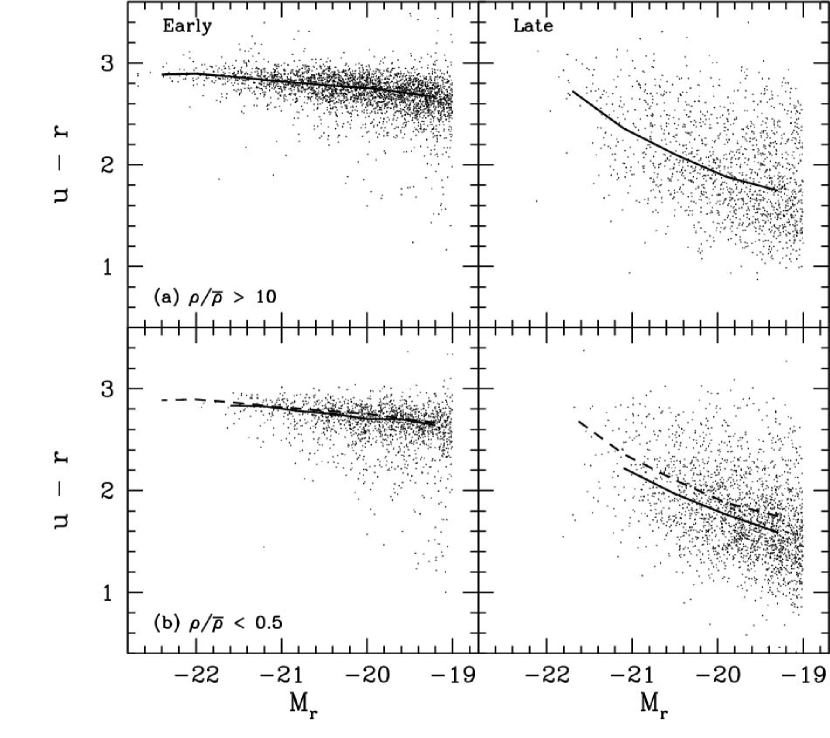
We first note that there is no break in color as a function of local density for either early or late type galaxies. Tanaka et al. (2004) reported detection of a break in color at a density of galaxies Mpc-2 (see Tanaka et al. for the definition of projected local density ) for galaxies with magnitudes . It is clear that this result is simply due to the fact that blue late types tend to avoid in very high density environments, and it is the morphology bias rather than the color bias that causes the effect. This feature in the morphology bias appears as a break in the morphology-luminosity relation at an absolute magnitude of about (Paper I).
Second, we note that the color of galaxies is a very insensitive function of local density once the morphology and luminosity are fixed. As the local density varies from to about 0.37, the color changes only by 0.03 for early types and by 0.11 for late types; both get redder at higher density. This behavior is insensitive to luminosity, which can be seen from the fact that the lines are nearly parallel to one another. On the other hand, the color changes by 0.22 and 0.75 as the magnitude changes by 2.2 from to for early and late types, respectively. The difference between the typical colors of early and late types is as large as 1 mag when . Therefore, the dependence of color on local density is dominated by the dependences of color on morphology and luminosity, which in turn are strongly dependent on local density, as shown in sections 4.1 and 4.2. Figure 11 also shows that blue early types live mainly at intermediate- and low-density environments, and that some red early type galaxies still exist in the extreme low density regions with . Tanaka et al. (2004) reported that the star formation rate indicated by the color and the equivalent width of the emission line is suppressed in dense environments. It turns out that most of the effects they detected are due to the dependence of morphology and luminosity on local density.
To inspect the collective behavior of color of each morphological type we examine the early and late type sequences in the color-magnitude diagram. The points in Figure 12 are early (left panels) and late (right panels) type galaxies in the D3 sample located in high (upper panels) and low (bottom panels) density environments.
In the upper panels, solid lines are the most probable color for the early types and the median color for the late types. In the bottom panels, the most probable and median color curves at high density are replotted as dashed lines, for comparison with the curves at lower density. We find that the shift of the early type sequence in the color-magnitude diagram toward bluer color is only 0.025 mag when the local density changes from to . A larger shift of 0.14 in color is observed for the late type sequence.
The very slight dependence of the location of the red sequence on the density field has been noted in the past, originally by Sandage & Visvanathan (1978), but more recently by others (Balogh et al. 2004b; Hogg et al. 2004; Bernardi et al. 2006; Blanton et al. 2007). The stronger dependence of the blue sequence colors on environment was pointed out by Balogh et al. (2004a).
4.4. Color Gradient
The points in Figure 11 are the color gradient of galaxies in the D2 sample as a function of local density. The most probable color gradient of early type galaxies is slightly negative (the center is redder) and shows no environmental dependence at a given absolute magnitude. It is nearly independent of luminosity as well. This extraordinary result is due to the fact that the internal color gradient of early type galaxies is almost independent of luminosity even though the color itself does have a monotonic dependence on luminosity (cf. Fig. 3 and 3 of Paper I). Late type galaxies have more negative color gradients when they are brighter (cf. Fig. 3 of Paper I), which explains the dependence of the color gradient of late types on absolute magnitude in the right panel of Figure 11b. This may reflect a change in the bulge-to-disk ratio with luminosity. Figure 11 shows that fainter late type galaxies are bluer in their integrated color than bright ones, and Figure 11 indicates that they have bluer centers (thus lower color gradients). The color difference weakly depends on local density for faint late type galaxies while no dependence is seen for bright galaxies.
4.5. Concentration Index
At fixed color or estimated star-formation history, several previous authors found little dependence of concentration on environment (Hashimoto & Oemler 1999; Bernardi et al. 2003a; Kauffmann et al. 2004; Blanton et al. 2005a; Quintero et al. 2007). We extend these results by showing that even when we use a cleaner definition of morphology, the radial profiles of galaxies appear to be only weakly related to their environment.
When morphological type and luminosity are fixed, the surface brightness profile, represented by the (inverse) concentration index, is nearly independent of local density as shown in Figure 11. The median of bright early types with absolute magnitudes within 0.8 mag bins shows little change at all local densities explored. Therefore, the dependence of surface brightness profile of early types on local density is solely due to the dependence of the profile on luminosity (cf. Fig. 3c of Paper I), which monotonically depends on local density, as demonstrated in section 4.2. Faint early types seem to be slightly more concentrated at low density. It is difficult to see a dependence of concentration index of late types on local density because the dispersion in is large and the effects seem weak.
4.6. Size
The size (Petrosian radius) of galaxies is an increasing function of luminosity as shown in Figure 4 of Paper I. Figure 13 shows that physical size is almost independent of local density when luminosity and morphology are fixed. We detect a small monotonic dependence of galaxy size on local density for both early and late types, except for the very bright galaxies. Surprisingly, galaxies of the same luminosity are smaller and therefore have higher surface brightness at low density. Galaxies with located at low density () are about 8% smaller in size than those at high density (), for both early and late types. The weak dependence of size on local density should be accepted with caution, because including light from neighboring galaxies can in principle create a trend in the sizes with density in the direction we see.
Kauffmann et al. (2004) and Blanton et al. (2005a) have both investigated the relationship between galaxy size and environment (at fixed luminosity and at fixed star-formation history or color, respectively), and both found only small effects. In the range of luminosities we consider here, more luminous than , Blanton et al. (2005a) find a trend for larger galaxies to be in denser regions as well (although they found this trend is reversed at lower luminosities). Bernardi et al. (2003b) investigated the dependence of residuals of early type galaxies from the fundamental plane on environment and find that the residuals from the fundamental plane in effective surface brightness correlate slightly with environment. The sense is that at fixed luminosity and velocity dispersion, galaxies are larger in dense regions, similar to our results here.
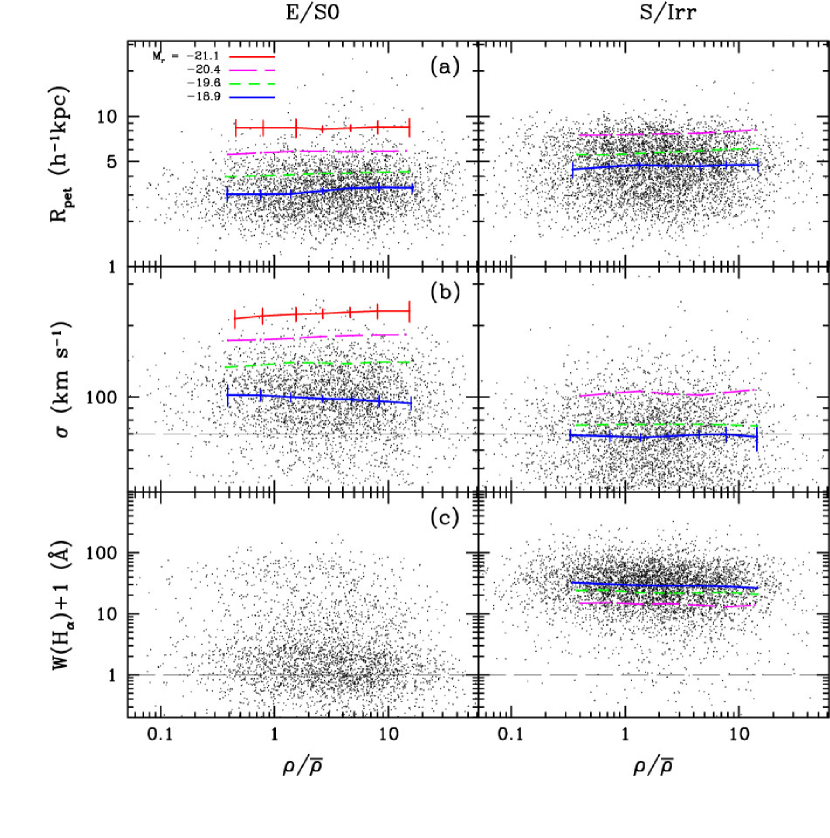
4.7. Velocity Dispersion of Early Type Galaxies
In the right panel of Figure 13 we see that the central velocity dispersion of late type galaxies shows no dependence on local density. However, we find an interesting dependence of the - relation on environment for early type galaxies. The velocity dispersion of fainter early types slightly increases toward low-density regions, while the opposite is true for brighter early types. This might be evidence for an environment-dependent Faber-Jackson relation or, more generally, such a dependence of the - relation.
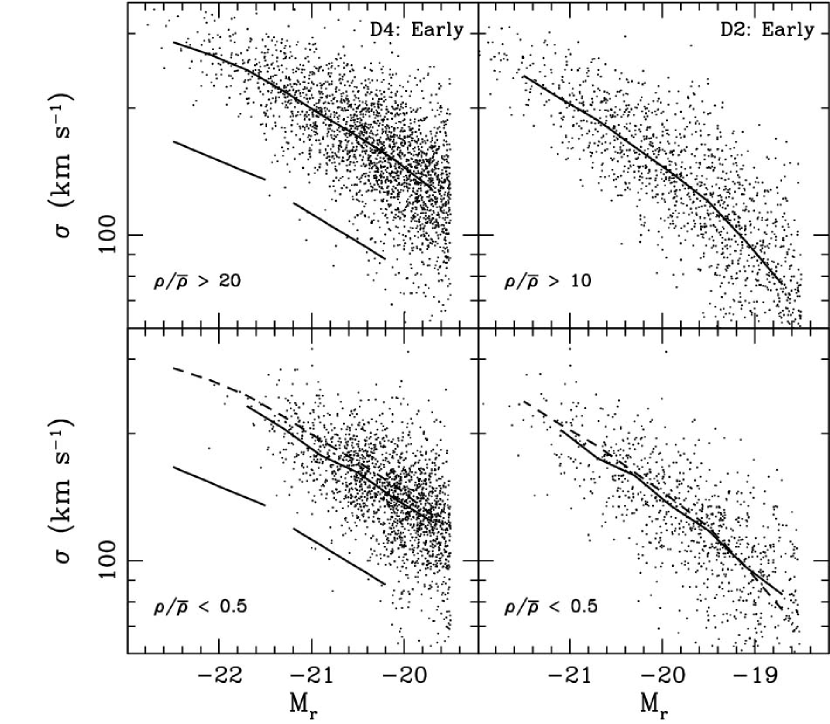
To explore this possibility further we plot early type galaxies in high and low-density regions in the absolute magnitude versus velocity dispersion space. The left panels of Figure 14 show the scatter plots of early type galaxies in the D4 sample located at different density and their most probable relations in the velocity dispersion-magnitude diagram. The dashed curves in the lower panel are equal to the solid ones in the upper panel. We clearly see that relatively bright early type galaxies in higher density regions have higher central velocity dispersions than those in under-dense regions. The right panels are for the galaxies in the D2 sample and show the relations down to fainter magnitudes. These plots indicate that the slope of the - relation depends on local density and that this trend is more evident at faint magnitudes. If we fit a power-law relation to the curves of most probable velocity dispersion, we measure and in regions with local densities of and , respectively, near . Thus, not only is the relation between luminosity and not well represented by a single power-law (cf. Fig. 4 of Paper I), the best-fitting such relation depends on local density of the galaxies.
4.8. Star Formation Rate
The equivalent width of the line is measured from the SDSS spectra, and is often used as a measure of recent star formation activity (or nuclear activity). Because SDSS spectra are obtained from the central radius region of galaxies, this line width is not necessarily a representative measure of star formation activity, particularly for spirals with a significant bulge component. Nevertheless, the star formation activity as measured by the equivalent width of the line, is on average stronger for faint late type galaxies (cf. Fig. 4 of Paper I). We find that line strength varies little with local density once the morphology and luminosity are fixed. Note that a strong local density dependence of can be obtained if all morphological type and luminosity are mixed because the fraction of late type and faint galaxies increases at lower densities. However, we are able to detect a weak correlation between line width and local density for late type galaxies; the star formation activity signaled by the line strength is relatively stronger at low density environment at a fixed luminosity. For galaxies with a linear fit to the median relation gives log. This dependence is weaker for brighter galaxies. This variation of star formation activity with environment is consistent with the findings of Rojas et al.(2005), who compared star formation activity of galaxies in voids with that of galaxies of similar luminosity in denser environments.
Other investigators who have explored the dependence of H emission on density have found that even at fixed galaxy concentration there is a strong relationship between the fraction of emission line galaxies and density. However, Gómez et al. (2003) and Balogh et al. (2004a) found, as we do here, that the distribution of H equivalent widths for emission line galaxies are only weakly related to density. These results parallel the similarly weak relationship between color and environment for late type galaxies. The majority of early type galaxies show vanishing star formation activity regardless of luminosity. We note that there is a group of active early types located at median or low density environments.
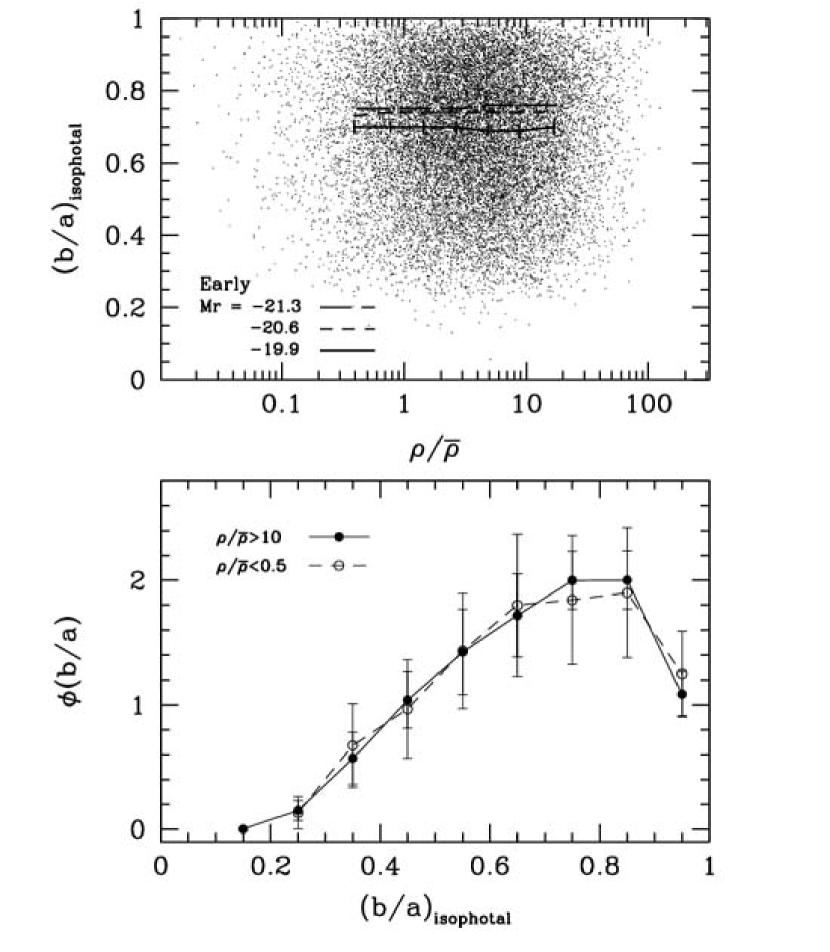
4.9. Axis Ratio of Early Type Galaxies
The points in Figure 15 are the isophotal ratio of early type galaxies in the D4 sample with absolute magnitudes between and as a function of local density. Their median relation is the thick solid line. Other lines are for brighter galaxies in the same sample, and the corresponding scatter plots are not made, in order to avoid confusion. Brighter early types are rounder than fainter ones (see also Fig. 5 of Paper I), which might be explained by the tidal interaction theory (cf. Thuan & Gott 1977). Once the luminosity is fixed, the local density dependence of the axis ratio of early types is so weak that it is not detected in this plot. The bottom panel of Figure 15 compares the histograms of the ratio of galaxies at very high and very low density environments. No statistically significant difference is observed.
5. Dependence on smoothing scale
So far, we have used local density estimated by the spline kernel smoothing in which the kernel size varies to include galaxies in the LS sample of galaxies. We now inspect the environmental dependence of physical properties of galaxies when the smoothing kernel includes 200 galaxies. Because we have found that most galaxy properties are nearly independent of local density once morphology and luminosity are fixed, we look for the possible dependence of only the morphological fraction and luminosity function on the much larger scale density field. The isodensity contours of the upper and lower plots in Figure 4 compare the two density fields and smoothed over and , respectively.
Figure 16 shows the early type galaxy fraction as a function of at each fixed luminosity with an absolute magnitude bin size of 0.8. Surprisingly, the nature of the relations is basically the same as that found by using a smaller smoothing scale of (although the relation seems steeper for fainter galaxies). We have checked that we reach the same conclusion even for . Figure 17 demonstrates the dependence of LF of galaxies on . The Schechter function parameters and depend on the larger scale density in the same way that they do on the smaller scale density (see Fig. 10). The characteristic luminosity strongly increases as rises. The type-specific parameters also behave in the same way. The only noticeable difference is the parameter of the combined sample at the lowest density, but the statistical significance of that single point is low. It should be noted that the smoothing scale corresponding to is not far from the linear scale (the rms density fluctuations is about while it is for ). The morphology and luminosity of galaxies appear to respond sensitively to the linear density field.


Since the density field that has smoothing is correlated with that having , it is not surprising to find similar relations between the local density and galaxy properties at both smoothing scales. Therefore, it is now very important to identify the scale on which the large-scale environmental dependence of morphology and luminosity of galaxies originates. To answer this question we study the dependence of the morphological fraction on very small scale environment by extracting samples both with and without close neighbors. We select “isolated” galaxies brighter than in the D2 sample D2 (). We adopt the isolation criteria for a target galaxy with that there can be no companion galaxy in the absolute magnitude interval , with redshift difference within 300 km s-1, and with separation across the line of sight less than kpc for a candidate galaxy . The solid line in Figure 18 is the early type fraction of isolated galaxies as a function of .

Since the morphological fraction of isolated galaxies with no close companion still correlates tightly with , we conclude that the large-scale environment is definitely one of the factors that determine the morphology of galaxies. We reach the same conclusion when the isolation criteria are changed to 500 km s-1 in redshift difference and Mpc in the separation across the line of sight. In Figure 18 the long and short dashed lines are the early type fractions of the galaxies with only one neighbor (binary) or those with one or more companions (unisolated), respectively. We see that galaxies having close companions are more likely to be of early type than isolated galaxies, even at the same large-scale density. This demonstrates that the morphology of galaxies is determined in response to very small scale density as well as to large () and very large () scale background density fields.
To narrow down the scale responsible for the origin of morphology we push our study further using the densities at these three scales in Figures 19 and 20. Figure 19 shows the relation between the densities estimated with and 200 at each galaxy in the D2 sample. Superposed are contours of constant early type galaxy fractions of 0.25, 0.30, 0.35, 0.40, and 0.45 from left to right.
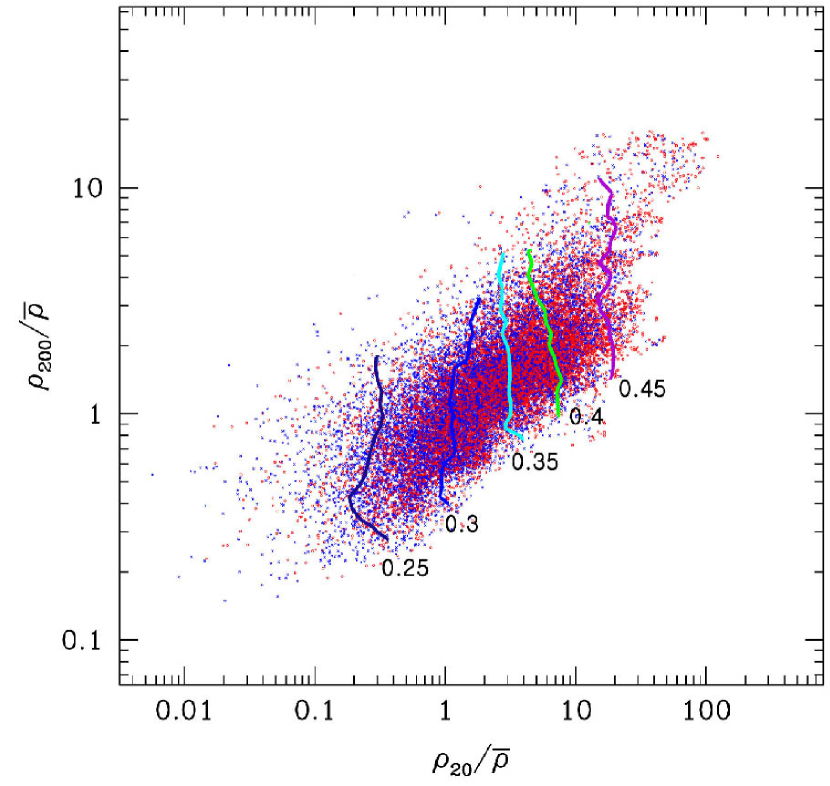
We note that the contours are basically vertical. The result shows that the morphology of galaxies sitting at a fixed is independent of the larger scale density and that the dependence of morphology fraction on the density with smoothing is merely because of its correlation with the density when . Therefore, the origin of galaxy morphology must be due to the environmental conditions at scales much lower than the scale, which is roughly the Mpc Gaussian smoothing scale.
Figure 20 compares with the distance to the nearest neighbor from a galaxy, , representing the small-scale density in this logarithmic plot.
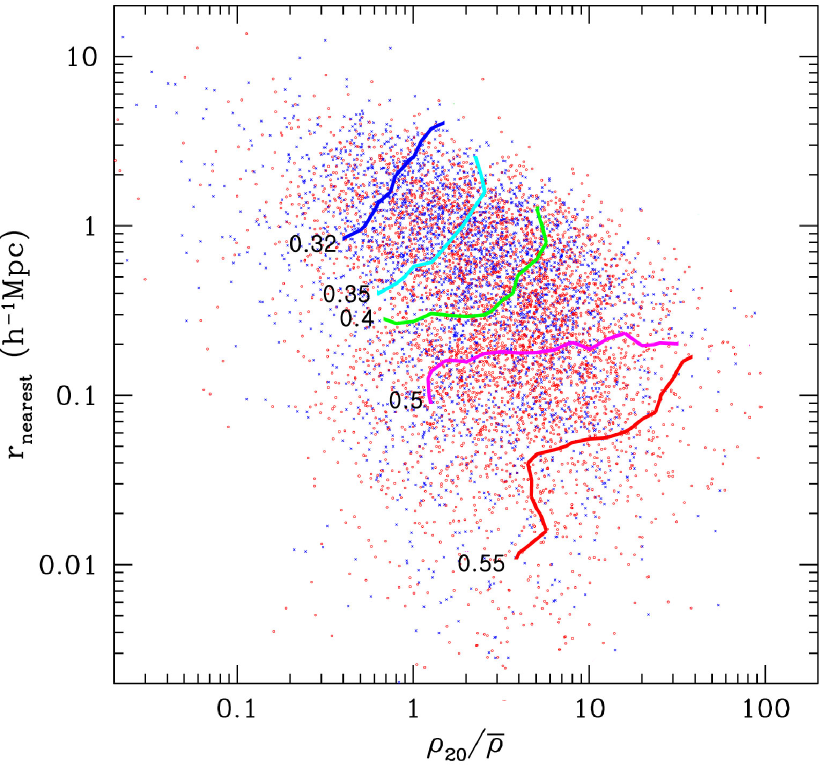
For each galaxy in Sample D2 () that has absolute magnitude limits we find the nearest companion that lies in the range and has radial velocity difference less than 500 km s-1, which is a little more generous than that used above. If luminosity is proportional to mass, 1.5 mag fainter luminosity corresponds to 25% of mass. Our criterion implies that a companion with mass greater than 25% of a target galaxy’s mass is heavy enough to influence the morphology of the galaxy. Superposed are again contours of constant early type fractions of 0.32, 0.35, 0.40, 0.50, and 0.55. It shows interesting dependences of morphology fraction on both scales. In general, the contours have positive slopes, which means the early type fraction increases as decreases at fixed . At fixed the fraction increases as increases, which is already shown in Figure 18 for Mpc. The strongest dependence on is observed when Mpc. The dependence on is weaker when is higher or lower. In under-dense regions below the majority of galaxies are isolated, with Mpc, and the morphology fraction is much less dependent on the existence of neighboring galaxies. In this under-dense environment galaxies are mostly of late type and morphology is sensitive to . The slope of contours depends on our choice of companion criteria and the smoothing size used to calculate the morphology fraction. But the general trend described above remains robust. A previous study analogous to ours is Balogh et al. (2004b) who claimed that the fraction of emission line galaxies depends on both and Mpc Gaussian smoothing scales. Importantly, they gave some evidence that the fraction was mostly dependent on local density where is high, but depended more on background density where is lower. Their claim is in agreement with our findings (compare their Fig. 9 with Fig. 20 of this paper).
| Morphology | |||||
|---|---|---|---|---|---|
| Type | |||||
| all | all | ||||
| early | all | ||||
| late | all | ||||
6. Discussion
6.1. Summary
We have studied dependences of physical properties of galaxies in the Sloan Digital Sky Survey (SDSS) on environment. There are several differences between our analysis and previous studies. First, we have used smooth local density estimated by the spline kernel enclosing 20 or 200 galaxies to define environment. Because the kernel used is centrally weighted, finite, and variable in size, it gives us a wide dynamic range in the estimated local density over 4 orders of magnitude. Second, we have used an accurate automated morphology classifier to group large numbers of galaxies into early and late types. In the case of the D2 sample with minor correction by visual inspection we expect the completeness and reliability to exceed 93%. These high quality morphology sets significantly reduce the biases due to misclassification. Third, we have used a set of volume-limited samples defined by absolute magnitude. Environmental dependences are studied for these volume-limited samples at fixed morphology and luminosity. In this way we have avoided confusion due to mixed dependences that occur when flux-limited samples are used. We have also attempted to reduce the effects due to internal extinction by excluding late type galaxies with axis ratios less than . Thanks to the large size of the SDSS spectroscopic catalog of galaxies, we are able to measure the environmental dependences to reasonable accuracies even after dividing galaxies into many subsamples selected by morphology and luminosity. Our major findings are as follows.
1. The fraction of early morphological type galaxies is a monotonically increasing function of a (well-defined) local density and luminosity. The morphology-density-luminosity relation, as measured in this work, should be a key constraint on galaxy formation models. It remains for us to understand what causes the morphology of a galaxy at fixed local density. We find that morphological fractions vary strongly with local density, but we find a mix of both early and late types at all densities. Thus, conditions other than local density must contribute to determining the morphology of a galaxy at fixed local density. The extra cause might be environmental properties other than density. The gravitational potential shear field is an example of such an environmental property. Morphology can also depend on the merger history of each object, which can be stochastic to some degree.
2. We find that the environmental dependences of various galaxy properties are almost entirely due to the dependences of morphology and luminosity on environment. When morphology and luminosity are fixed, other physical properties, such as color gradient, concentration, size, velocity dispersion, emission, and axis ratio, are nearly independent of local density. Careful inspection reveals weak residual local density dependences for several properties. We find that the color of late type galaxies is monotonically bluer at low density environments, even at a fixed luminosity. Early types show much weaker dependence. We also find that bright early type galaxies in high density regions have higher central velocity dispersions compared to those in low density regions, but that the opposite is true for fainter galaxies. A consequence is a local density dependence of the - relation. Because galaxy properties strongly depend not only on luminosity but also on morphology, it is clear that galaxy properties cannot be determined solely by dark halo mass.
Our results, using a new morphological classifier and a robust method of local density estimation, are largely consistent with several previous studies attempts (Kauffmann et al. 2004; Blanton et al. 2005a; Hashimoto & Oemler 1999; Christlein & Zabludoff 2005). In each of those papers, the authors found a relationship between galaxy color and environment at fixed concentration, a measure of galaxy structure associated with morphology (Strateva et al. 2001). Conversely, those papers showed that at fixed color there is no relationship between concentration and environment. Those results regarding concentration do not refer to morphology as we define it here, which indeed includes color as one of key indicators. In Park & Choi (2005) we have shown that morphology can be traced not simply by concentration alone, but by a combination of concentration, color, and color gradient. Once morphology is defined this way, almost any other indicator of type appears to be nearly fixed with environment, even as the fraction of galaxies of each morphology changes. Indeed, they imply that because the morphological mix changes with local density, at fixed concentration one should indeed measure a correlation between color and density. The converse result, that concentration shows only a weak relationship with density at fixed color, is a consequence of the fact that color is the more powerful type indicator.
3. We show that morphology of galaxies appears to depend on local density, from very small scales ( Mpc) up to the and 200 smoothing scales corresponding to about 4.7 and Mpc effective Gaussian smoothing scales. It is shown that the environment at scales larger than about Mpc do not independently affect galaxy morphology. This gives us an important clue to understanding the origin of galaxy morphology. The direct cause of galaxy morphology is not related with the background density of the linear-regime scale at the present epoch. We have also shown that morphology of bright galaxies depends on both the local density with smoothing and the distance to the nearest companion galaxy. The dependence on becomes strongest when the neighbor distance is about kpc at which the combined effects of strong tidal force and long duration of interaction on galaxy property seems to reach the maximum. The importance of the smooth density with rises at larger and smaller separations.
6.2. How Is the Galaxy Morphology Determined?
In the currently popular scenario of galaxy formation and evolution the properties of galaxies depend either only on the formation history of their dark matter halos or also on nurture processes such as ram pressure stripping, strangulation, and harassment. In the cold dark matter (CDM) cosmogony, a galaxy-scale dark halo forms through a series of mergers of subgalactic objects. The over-density at the galaxy scale, which is statistically related with the larger scale density, will determine the final mass. Other physical properties of the galaxy will depend on the final mass, but much variation is expected, depending on how the final mass is actually assembled. Gott & Thuan (1976) proposed that galaxy morphology is determined by the amount of gas left over at maximum collapse of the protogalaxy, which in turn depends on the ratio of the star formation time scale to the collapse time . They claimed that ellipticals had relatively small (if a star formation law was adopted) and had finished star formation by the time of maximum collapse. In additional to this initial condition and sub-galactic-scale evolution, the local environment can also directly affect galaxy properties. Ram pressure stripping (Gunn & Gott 1972) is a mechanism that removes gas and shuts off star formation when a galaxy orbits a hot cluster halo. The morphology of a spiral galaxy can be transformed to an early type by this process. High-speed encounters of galaxies with other halos typically in clusters cause impulsive heatings, called harassment (Moore et al. 1996), and can transform spirals to early types. Another mechanism, strangulation (Balogh et al. 2000), can also transform morphology through a decline of star formation rate due to shut-off of the newly accreted gas when a galaxy enters a cluster or group environment and loses its hot gas reservoir. There is also observational and theoretical evidence that the tidal force field in clusters can transform the infalling spirals to early types (Moss & Whittle 2000; Gnedin 2003).
It is important to note that all these nurture mechanisms proposed so far are basically effective in group or cluster environments. In previous studies it was claimed that galaxy properties such as star formation activity and morphology fraction showed discontinuities at a critical density for galaxies somewhat fainter than the galaxy. This finding was used to support the proposition that properties of the relatively faint galaxies are affected by morphology transformation mechanisms working in the group or cluster environment (Tanaka et al. 2004; Balogh et al. 2004). However, we find that there is no feature in the galaxy property versus local density relation even for such relatively faint galaxies when luminosity and morphology are fixed. The only feature is the sharp decrease of the late-type fraction above the critical luminosity of about in the morphology versus luminosity relation (Paper I). This indicates that there seems to be morphology and luminosity-determining processes that work at all local densities in a continuous way.
The strong effect of a close companion on galaxy morphology as indicated by this study, might imply the existence of a morphology transformation mechanism acting at a distance without a direct physical contact. What is important is that this process seems to be working in a wide density environment. Figure 20 indicates that this effect is maximal for galaxies having a companion at a separation of about kpc. This might be because the tidal effects are strong enough to significantly enhance the star formation rate, and the duration of interaction is large as well at this particular separation. The morphology transformation process caused by this rather secular effects in binary or few-body systems can be smoothly connected with the more instantaneous tidal interactions with the cluster core or local substructures in clusters (Moss & Whittle 2000; Gnedin 2003).
Galaxies can be either isolated or in binary/multiple systems at all environments. For example, in Figure 18 the fraction of unisolated galaxies is about 20% even in the low density region with . A similar finding was reported in the existence of red galaxies in low density regions (Balogh et al. 2004b). Figure 18 also shows that the early type fraction is systematically higher for galaxies located at higher no matter whether they are isolated or in systems. The isolated early types may have been initially born as early types or may be final merger products of initially multiple systems.
It is reasonable to believe that our local background density calculated by using neighboring 20 galaxies is a good indicator of the ratio at the time of galaxy formation. The merger rate during the subsequent evolution and the average rates of all the nurture processes mentioned above are likely to be increasing functions of . The fraction of galaxies in binary/multiple systems are also an increasing function of . If these are true and if small or above evolution processes yield early type galaxies, we can understand the overall dependence of morphology on . The increase of the early type fraction in binary or multiple systems can be explained by the tidal disturbance effects. It remains to be understood why the dependence on the nearest companion distance becomes maximum near the particular separation of kpc, which is roughly the separation between two typical bright galaxies when their dark halos are just touching.
References
- (1) Abazajian, K., et al. 2004, AJ, 128, 502
- (2) Adelman-McCarthy, J. K., et al. 2007, ApJSsubmitted
- (3) Andreon, S., & Cuillandre, J.-C. 2002, ApJ, 569, 144
- (4) Balogh, M., et al. 2004a, MNRAS, 348, 1355
- (5) Balogh, M. L., Baldry, I. K., Nichol, R., Miller, C., Bower, R., & Glazebrook, K. 2004b, ApJ, 615, L101
- (6) Bernardi, M., Nichol, R. C., Sheth, R. K., Miller, C. J., & Brinkmann, J. 2006, AJ, 131, 1288
- (7) Bernardi, M., et al. 2003a, AJ, 125, 1817
- (8) Bernardi, M., et al. 2003b, AJ, 125, 1866
- (9) Blanton, M. R., & Berlind, A. A. 2007, ApJin press (astro-ph/0608353)
- (10) Blanton, M. R., Eisenstein, D., Hogg, D. W., Schlegel, D. J., & Brinkmann, J. 2005a, ApJ, 629, 143
- (11) Blanton, M. R., et al. 2005b, ApJ, 129, 2562
- (12) Blanton, M. R., Lin, H., Lupton, R. H., Maley, F. M., Young, N., Zehavi, I., & Loveday, J. 2003a, AJ, 125, 2276
- (13) Blanton, M. R., et al. 2003b, AJ, 125, 2348
- (14) Blanton, M. R., et al. 2003c, ApJ, 594, 186
- (15) Boselli, A., & Gavazzi, G. 2006, PASP, 118, 517
- (16) Choi, Y.-Y., Park, C., & Vogeley, M. S. 2006, ApJ, submitted (Paper I)
- (17) Christlein, D., & Zabludoff, A. I. 2005, ApJ, 621, 201
- (18) Colless, M., et al. 2001, MNRAS, 328, 1039
- (19) Croton, D. J., et al. 2005, MNRAS, 356, 1155
- (20) de Propris, R., Pritchet, C. J., Harris, W. E., & McClure, R. D. 1995, ApJ, 450, 534
- (21) De Propris, R., et al. 2003, MNRAS, 342, 725
- (22) Dressler, A. 1980, ApJ, 236, 351
- (23) Driver, S. P., Couch, W. J., & Phillipps, S. 1998, MNRAS, 301, 369
- (24) Fukugita, M., Ichikawa, T., Gunn, J. E., Doi, M., Shimasaku, K., & Schneider, D. P. 1996, AJ, 111, 1748
- (25) Gnedin, O., Y. 2003, ApJ, 589, 752
- (26) Gómez, P., et al. 2003, ApJ, 584, 210
- (27) Goto, T., et al. 2003, MNRAS, 346, 601
- (28) Gott, J. R., & Thuan, T. X. 1976, ApJ, 204, 649
- (29) Gunn, J. E., et al. 2006, AJ, 131, 2332
- (30) Gunn, J. E., et al. 1998, AJ, 116, 3040
- (31) Gunn, J. E., & Gott, J. R. 1972, ApJ, 176, 1
- (32) Hashimoto, Y. & Oemler, A. J. 1999, ApJ, 510, 609
- (33) Hamilton, A. J. S. & Tegmark, M. 2004, MNRAS, 349, 115
- (34) Hogg, D. W., et al. 2004, ApJ, 601, L29
- (35) Hogg, D. W., Finkbeiner, D. P., Schlegel, D. J., & Gunn, J. E. 2001, AJ, 122, 2129
- (36) Hoyle, F., Rojas, R. R., Vogeley, M. S., & Brinkmann, J. 2005, ApJ, 620, 618
- (37) Ivezić, Z., et al. 2004, AN, 325, 583
- (38) Jørgensen, I., Franx, M., & Kjærgaard, 1995, MNRAS, 276, 1341
- (39) Kauffmann, G., White, S. D. M., Heckman, T. M., Ménard, B., Brinchmann, J., Charlot, S., Tremonti, C., & Brinkmann, J. 2004, MNRAS, 314
- (40) Lewis, I., et al. 2002, MNRAS, 334, 673
- (41) Lumsden, S. L., Collins, C. A., Nichol, R. C., Eke, V. R., & Guzzo, L. 1997, MNRAS, 290, 119
- (42) Lupton, R. H., Gunn, J. E., Ivezíc, Z., Knapp, G. R., Kent, S., & Yasuda, N. 2001, in ASP Conf. Ser. 238, Astronomical Data Analysis Software and Systems X, ed. F. R. Harnden, Jr., F. A. Primini, & H. E. Payne (San Francisco: ASP), 269
- (43) Marinoni, C., Hudson, M. J., & Giuricin, G. 2002, ApJ, 569, 91
- (44) Moss, C., Whittle, M. 2000, MNRAS, 317, 667
- (45) Oemler, A. 1974, ApJ, 194, 1
- (46) Park, C., Choi, Y.-Y., & Kim, J. 2006, in preparation
- (47) Park, C., et al. 2005, ApJ, 633, 11
- (48) Park, C., & Choi, Y.-Y., 2005, ApJ, 635, L29
- (49) Park, C., Vogeley, M. S., Geller, J., & Huchra, J. P. 1994, ApJ, 431,569
- (50) Pier, J. R., Munn, J. A., Hindsley, R. B., Hennessy, G. S., Kent, Si. M., Lupton, R. H., & Ivezíc, R. 2003, AJ, 125, 1559
- (51) Popesso, P., Böhringer, H., Romaniello, M., & Voges, W. 2005, A&A, 433, 415
- (52) Popesso, P., Biviano, A., Böhringer, H., & Romaniello, M. 2006, A&A, 445, 29
- (53) Postman, M., & Geller, M. 1984, ApJ, 281, 95
- (54) Quintero, A. D., Berlind, A. A., Blanton, M. R., & Hogg, D. W. 2006, ApJ, submitted (astro-ph/0512004)
- (55) Rojas, R. R., Vogeley, M. S., Hoyle, F., & Brinkmann, J. 2004, ApJ, 617, 50
- (56) Rojas, R. R., Vogeley, M. S., Hoyle, F., & Brinkmann, J. 2005, ApJ, 624, 571
- (57) Schlegel, D. J., Finkbeiner, D. P., & Davis, M. 1998, ApJ, 500, 525
- (58) Sandage, A., & Visvanathan, N. 1978, ApJ, 225, 742
- (59) Secker, J., Harris, W. E., & Plummer, J. D. 1997, PASP, 109, 1377
- (60) Smith, J. A., et al. 2002, AJ, 123, 2121
- (61) Stoughton, C., et al. 2002, AJ, 123, 485
- (62) Strateva, I., et al. 2001, AJ, 122, 1861
- (63) Strauss, M. A., et al. 2002, AJ, 124, 1810
- (64) Tanaka, M., et al. 2004, AJ, 128, 2677
- (65) Tegmark, M., et al. 2004, ApJ, 606,702
- (66) Trentham, N. 1998, MNRAS, 293, 71
- (67) Thuan, T. X., & Gott, J. R. 1977, ApJ, 216, 194
- (68) Tucker, D., et al. 2006, AN, in press
- (69) Valotto, C. A., Moore, B., & Lambas, D. G. 2001, ApJ, 546, 157
- (70) Valotto, C. A., Nicotra, M. A., Muriel, H., & Lambas, D. G. 1997, ApJ, 479, 90
- (71) Weinmann, S. M., van den Bosch, F. C., Yang, X., & Mo, H. J. 2006, MNRAS, 366, 2
- (72) York, D., et al. 2000, AJ, 120, 1579
- (73) Zandivarez, A., Martínez, H. J., & Merchán, M. E. 2006, astro-ph/0602405