X-ray emission from PSR B1800-21, its wind nebula, and similar systems
Abstract
We detected X-ray emission from the Vela-like pulsar B180021 and resolved its synchrotron nebula with the Chandra X-ray Observatory. The pulsar’s flux is ergs cm-2 s-1 in the 1–6 keV band. Its spectrum can be described by a two-component power law (PL) + blackbody model, suggesting a mixture of thermal and magnetospheric emission. For a plausible hydrogen column density cm-2, the PL component has a slope and a luminosity ergs s-1. The properties of the thermal component (–0.3 keV, – ergs s-1) are very poorly constrained because of the strong interstellar absorption. The compact, , inner pulsar-wind nebula (PWN), elongated perpendicular to the pulsar’s proper motion, is immersed in a fainter asymmetric emission. The observed flux of the PWN, including its fainter component, is ergs cm-2 s-1 in the 1–8 keV band. The PWN spectrum can be described by a PL model: , ergs s-1, for cm-2. The elongation of the inner PWN with respect to the direction of the pulsar’s proper motion suggests that its X-ray emission emerges from a torus associated with the termination shock in the equatorial pulsar wind. Such an interpretation provides additional support for the alignment between the pulsar’s velocity and the spin axis found for several other pulsars. The asymmetry in the fainter, more extended emission could be attributed to nonuniform properties of the ambient medium. A lack of any signs of bow-shock morphology suggests that the pulsar moves subsonically in high-pressure interiors of a supernova remnant. However, similar to a few other Vela-like pulsars, no supernova remnant is seen in the Chandra image, possibly because its soft X-ray emission is absorbed by the interstellar medium. The inferred PWN-pulsar properties (e.g., the PWN X-ray efficiency, ; the luminosity ratio, ; the pulsar wind pressure at the termination shock, ergs cm-3) are very similar to those of other subsonically moving Vela-like objects detected with Chandra (–, , – ergs cm-1).
Subject headings:
pulsars: individual (PSR B1800–21 = J18032137) — stars: neutron — X-rays: stars1. Introduction
Observations with the Chandra X-ray Observatory have shown that many young pulsars ( kyrs) power X-ray nebulae (e.g., Kaspi et al. 2004; Gaensler & Slane 2006, and references therein). The observed X-ray emission is produced by relativistic particles gyrating in the magnetic field downstream of the termination shock in the pulsar wind (Kennel & Coroniti 1994; Arons 2004). The innermost parts of many X-ray pulsar-wind nebulae (PWNe) show axisymmetric morphologies, including toroidal structures and jets along the pulsar’s spin axis. However, even pulsars with very similar spin-down properties (such as the period, , period derivative, , spin-down power, , and spin-down age, ) can produce PWNe of quite different shapes and sizes. These differences can occur for a number of reasons. For instance, upstream of the termination shock (i.e., closer to the pulsar) the properties of the wind should be sensitive to the angle between the pulsars’s magnetic and spin axes and the wind magnetization. These factors could affect the strength of the termination shock and, consequently, the temperature and radiation efficiency of the post-shock flow. On the other hand, the properties of the post-shock flow should also depend on density and temperature of the ambient medium. For instance, these parameters may vary significantly for PWNe residing inside supernova remnants (SNRs) of different ages. Finally, the direction of the kick acquired by the neutron star (NS) at birth with respect to its spin axis, and the NS velocity relative to the ambient medium also affect the PWN appearance. For instance, if the pulsar moves with a high velocity, the ram pressure caused by its motion can exceed the ambient gas pressure, resulting in a bow-shock PWN, such as “the Mouse” PWN around PSR J17472958 (Gaensler et al. 2004) and “the Duck” PWN around PSR B175724 (Kaspi et al. 2001a). Studying X-ray bright, nearby PWNe helps to disentangle various effects, understand their impact on the PWN structure, and probe the properties of the ambient medium.
The well-known nearby ( pc) Vela pulsar and its X-ray PWN (Pavlov et al. 2001ab, 2003; Helfand et al. 2001) have become an archetype for young (–30 kyrs) and energetic (– ergs s-1) pulsars powering X-ray PWNe. These pulsars are also interesting because at this age emission from the hot NS surface becomes observable in X-rays as a thermal “hump” on top of the flat non-thermal spectrum (e.g., Kargaltsev & Pavlov 2006).
Based on its age, kyr, and spin-down power, ergs s-1, the radio pulsar B1800–21 (hereafter B1800) is similar to the Vela pulsar, but it is more distant (the dispersion measure distance is kpc, according to Cordes & Lazio 2002). Its spin-down flux, ergs s-1 cm-2, where , places it among the top 20 pulsars ranked by this parameter. The pulsar is projected near the western boundary of the radio SNR G8.70.1 (W30), surrounded by HII regions and molecular gas (Odegard 1986, and references therein). However, the association between B1800 and G8.70.1 has been considered doubtful because it would require a very large velocity of the pulsar if it was born near the apparent SNR center (Frail et al. 1994).
Being young and energetic, B1800 should be surrounded by a PWN, and both the pulsar and the PWN should be detectable in X-rays. Based on a 10 ks ROSAT PSPC observation, Finley & Ögelman (1994) have reported a faint X-ray source (PSPC count rate of counts ks-1) located near the radio pulsar position and attributed this emission to B1800. The low count rate and insufficient angular resolution of ROSAT PSPC did not allow Finley & Ögelman (1994) to resolve a compact PWN. They, however, detected diffuse X-ray emission northeast of the pulsar and attributed it to the G8.70.1 SNR. These authors defend the association between the pulsar and G8.70.1 by suggesting that the SN explosion, which produced B1800 and G8.70.1, occurred in or near a molecular cloud, very close to the current position of the pulsar, and the SNR have been “blown out” eastward into a low-density interstellar medium (ISM). However, a recent proper motion measurement (Brisken et al. 2006) has shown that the pulsar was born outside the currently seen SNR, and it moves more nearly toward the center of G8.70.1 rather than away from it, which makes their association very unlikely. This measurement also essentially rules out the association between the pulsar and the newly discovered SNR candidate G8.310.09 (Brogan et al. 2006).
B1800 is of particular interest because it is located in the vicinity of the TeV -ray source HESS J1804216 (Aharonian et al. 2006), and it may supply ultrarelativistic electrons that generate the TeV radiation by upscattering the photons of the cosmic microwave background. We will discuss the possible connection between B1800 and HESS J1804216, as well as other candidate X-ray counterparts of the TeV source, in a separate paper.
In this paper, we describe the results of a Chandra observation of PSR B1800–21 and its synchrotron nebula. The details of the observation and the data analysis are presented in §2. We compare the X-ray properties of the B1800 pulsar and its PWN with those of other Vela-like pulsars-PWNe and discuss implications of our findings in §3. Our main results are summarized in §4.
2. Observations and Data Analysis
We observed B1800 with the Advanced CCD Imaging Spectrometer (ACIS) on board Chandra on 2005 May 4. The useful scientific exposure time was 30,236 s. The observation was carried out in Faint mode, and the pulsar was imaged on S3 chip, from the aim point. The detector was operated in Full Frame mode, which provides time resolution of 3.2 seconds. The data were reduced using the Chandra Interactive Analysis of Observations (CIAO) software (ver. 3.2.1; CALDB ver. 3.0.3).
2.1. Image
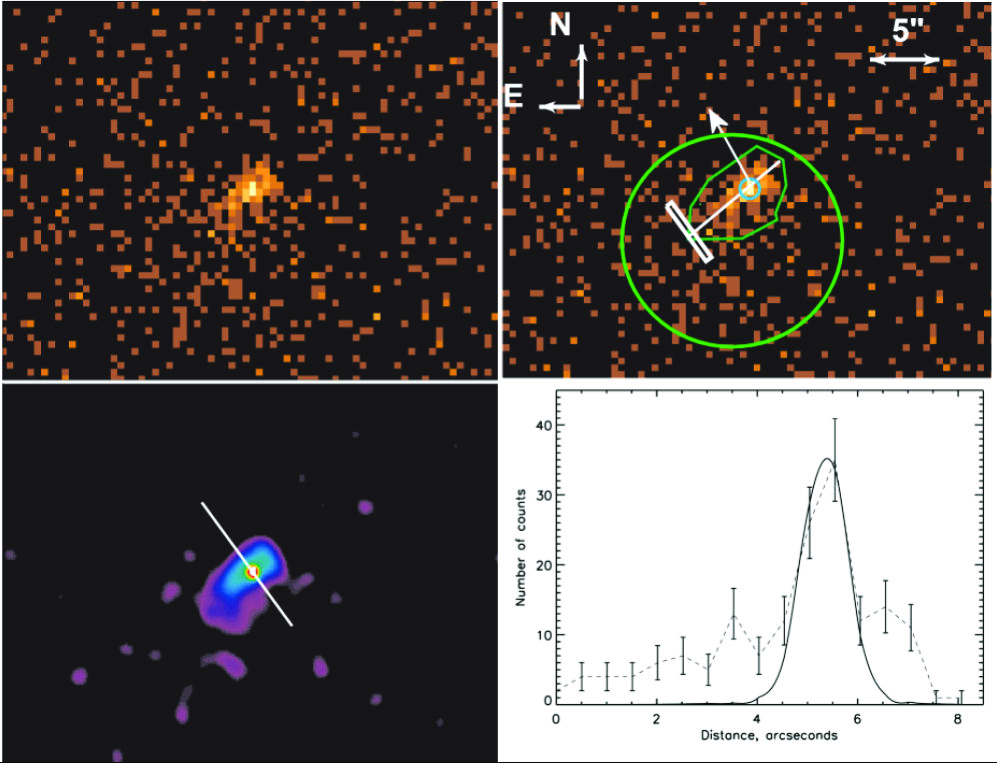
Figure 1 shows the ACIS-S3 image of the region around B1800. An extended X-ray source is clearly seen in the image around R.A., decl. (these are the coordinates of the center of the brightest pixel). The difference of between this postion and the radio position111 Note that the radio timing position of B1800, R.A., decl. (Manchester et al. 2005), differs by from the Brisken et al. (2006) position and the position of the X-ray source. No X-ray source is seen at or near the radio timing position. This means that the error of the radio timing position is strongly underestimated. of B1800 (Brisken et al. 2006) is smaller than the error in absolute Chandra astrometry (06 at the 90% confidence level). The close match between the X-ray and radio positions and the extended morphology of the observed X-ray emission allow us to conclude that we detected the X-ray emission from B1800 and its PWN.
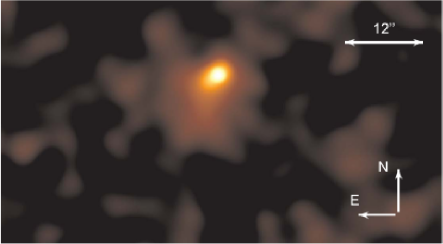
The brighter, compact (, i.e. pc2 at kpc) PWN component is elongated in the southeast-northwest direction, roughly perpendicular to the proper motion direction (see Fig. 1). The compact component (the inner PWN) is brighter northwest of the pulsar but more extended toward southeast. There is also evidence for a more extended, fainter emission component (the outer PWN), in size, mostly concentrated southward of the compact bright component (Fig. 2). The bottom right panel in Figure 1 shows the one-dimensional distribution of counts along the southeast-northwest direction. The data points with error bars (connected by the dashed line) are obtained by integrating counts within pixels () rectangular apertures (shown in the top right panel of Fig. 1) moving along the southeast-northwest direction with a 05 step. The solid line shows the count distribution obtained in a similar way but for a point source simulated with MARX222MARX (Model of AXAF Response to X-rays) is a suite of programs designed to enable the user to simulate the on-orbit performance of the Chandra satellite, including ray-trace simulation. See http://space.mit.edu/ASC/MARX/. The difference between the dashed and solid lines represents the extended emission from the PWN. The one-dimensional profile and the PWN images suggest a compact ( in diameter), roughly symmetric torus around the pulsar (the blue region in the bottom left panel of Fig. 1), with some extension toward southeast. The position angle (PA) of the torus symmetry axis is about – east of north, close to the proper motion PA of (Brisken et al. 2006).
We also attempted to search for signatures of an SNR around the pulsar-PWN complex. A direct visual inspection of the ACIS image did not show clear signatures of large-scale diffuse emission. We applied the exposure map correction and smoothed the image with various scales, but failed to find statistically significant deviations from a uniform brightness distribution in these images. To estimate an upper limit on the SNR emission, we measured the count rate from the entire S3 chip (with all identifiable point sources removed). The count rate, counts s-1 in the 0.5–7 keV band, exceeds the nominal S3 background of 0.32 counts s-1 (Chandra Proposers’ Observatory Guide333See http://asc.harvard.edu/proposer/POG/index.html, v.8, §6.15.2), which could be caused by an elevated particle background, diffuse X-ray background, or SNR emission. Since we see no trace of an SNR, we consider the difference, 0.28 counts s-1, as an upper limit on the SNR count rate in the 70 arcmin2 of the chip area, which corresponds the average surface brightness limit of 4 counts ks-1 arcmin-2.
2.2. Spectral analysis
2.2.1 PWN spectrum
The PWN spectra were extracted from two regions shown in Figure 1 (top right panel). The smaller (polygon) region of 32.7 arcsec2 area encompasses the brighter compact PWN, while the larger (circular) region of 176 arcsec2 area includes a fainter component, which is more prominent south of the pulsar. From these regions we excluded the circular region of radius centered on the brightest pixel to avoid contamination of the PWN spectrum by the pulsar. The background was measured in the annulus centered on the source (45 counts in the 706 arcsec2 area, in the 0.3–8 keV band). The total numbers of counts extracted from the smaller and larger PWN regions are 58 and 117, of which 96.4% and 90.3 % are expected to come from the source, which gives and PWN counts in the two regions. (The errors here and below are at the 68% confidence level.) The observed PWN fluxes are ) and () ergs s-1 cm-2 for the larger and smaller extraction regions, respectively, in the 1–8 keV band.
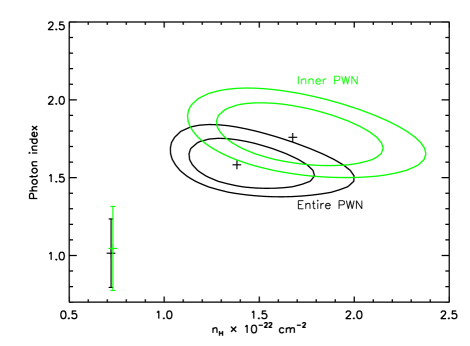
For each of the two spectra, we group the counts into six spectral bins, with comparable numbers of counts per bin. First, we fit the PWN spectra for each of the two regions with the absorbed PL model, allowing the hydrogen column density, , to vary. These fits result in spectral slopes –1.9 and –2.0 (see Fig. 3). We see no indication for spectral softening (expected due to synchrotron burn-off in PWNe with high radiation efficiency) in the spectrum extracted from the larger region compared to the spectrum of the bright inner PWN. To test this, we also fit the spectra with the PL model in which the hydrogen column density is fixed at (the best-fit value for the larger region) and found that the virtually the same photon indices: and , for the larger and smaller region, respectively. The apparent lack of spectral softening could be attributed to the small number of counts collected from the fainter outer PWN component.
The best-fit value of estimated from the B1800 PWN fit approximately coincides with the total Galactic HI column density in this direction (Dickey & Lockman 1990). It does not contradict to the adopted distance of 4 kpc to B1800 because the deduced from an X-ray spectrum under the assumption of standard element abundances generally exceeds the measured from 21 cm observations by a factor of 1.5–3 (e.g., Baumgartner & Mushotzky 2005). On the other hand, given the B1800’s dispersion measure, cm-3 pc (i.e., the electron column density cm-2), the value of 1.4 corresponds to the ISM ionization degree , below the usually assumed value of 10%, which corresponds to . If the hydrogen column density is fixed at , the PL fit results in substantially harder spectra, for both extraction regions (see Table 1 and Figs. 3 and 4).
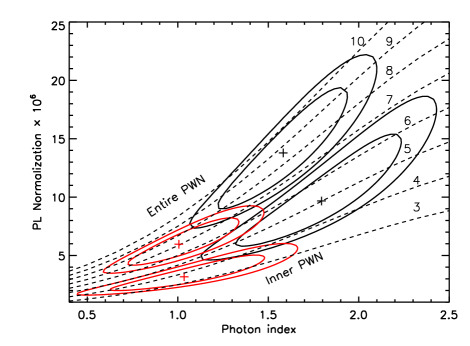
The unabsorbed flux and luminosity are less sensitive to the interstellar absorption than the spectral parameters. The isotropic PWN luminosity is 1–2 and 0.6–1 ergs s-1 in the 0.5–8 keV band, for the whole and inner PWN, respectively (see Table 1 and Fig. 4). The former value is a fraction of – of the pulsar’s spin-down power .
2.2.2 Pulsar spectrum
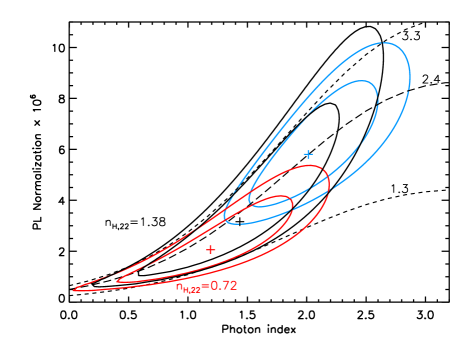
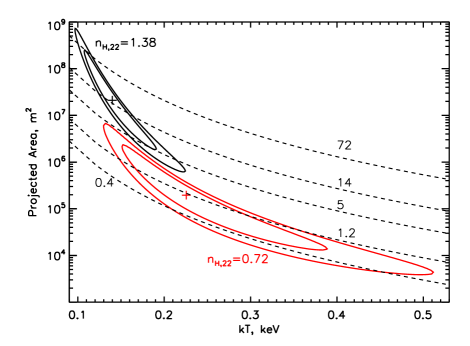
To minimize contamination by the PWN, the pulsar spectrum was extracted from a small circular aperture with the radius of 1.5 ACIS pixels (, 85% encircled energy radius). The total number of counts within the source region is 51, of which less than 15% is expected to come from the PWN (based on the PSF simulation). To account for the PWN contribution to the pulsar spectrum, the background spectrum was extracted from the arcsec2 region encompassing the brightest part of the inner PWN (with the pulsar being excluded). The pulsar’s absorbed flux is ergs cm-2 s-1 in the 1–6 keV band (aperture corrected and background subtracted). To obtain constrained fits with the small number of counts available, we are forced to freeze the hydrogen column density. First, we fix it at , obtained above from the PL fit to the PWN spectrum. With this , the single-component PL and black-body (BB) models fail to fit the pulsar spectrum. A two-component BB+PL model provides a good fit, but the fitting parameters are poorly constrained because of the small number of photons detected (Fig. 5). The slope of the PL component is , and its unabsorbed luminosity is ergs s, in the 0.58 keV band. The temperature and the projected area of the BB component are strongly correlated (see Fig. 6), which results in very large uncertainties for these parameters. The best-fit temperature is MK, while the projected emitting area, m2, is smaller than that of the NS surface ( m2), but larger than the conventional polar cap area m2. The corresponding bolometric luminosity, ergs s-1.
If the hydrogen column is fixed at the value estimated from the dispersion measure at 10% ISM ionization, , then a single PL model fits the spectrum and gives and the unabsorbed luminosity ergs s-1, in the 0.5–8 keV band. Once again, the BB model does not fit the spectrum while the two-component PL+BB model provides an acceptable fit. In comparison with the BB+PL fit with the larger , the BB component shows a higher temperature ( MK) and a smaller (but even more uncertain) emitting area ( m2) while the PL component has . The fitting parameters of the BB component are even less constrained than those at (see Fig. 6). For the non-thermal PL component, the confidence contours for fitting parameters strongly overlap with those calculated for (see Fig. 5). The luminosity of the non-thermal component, ergs s-1 in 0.58 keV, is close to that in the case, while the bolometric luminosity of the thermal component, ergs s-1, is a factor of 15 lower.
| Model | aaThe values of hydrogen column density are frozen in the fits. | bbSpectral flux in units of photons cm-2 s-1 keV-1 at 1 keV. | ( or )ccWe use the C statistic (Cash 1979) for the inner PWN and statistic for entire PWN, which has a larger number of counts./dof | ddUnabsorbed isotropic luminosity in the 0.5–8 keV band in units of ergs s-1. | |
|---|---|---|---|---|---|
| Entire PWN | |||||
| Entire PWN | |||||
| Inner PWN | |||||
| Inner PWN |
3. Discussion.
The B1800 PWN+pulsar flux measured by Chandra is consistent with the ROSAT PSPC count rate reported by Finley & Ögelman (1994). However, ROSAT was unable to resolve the PWN emission from that of the pulsar. The superior angular resolution of Chandra has allowed us to resolve the shape of the PWN, disentangle the point source and the extended emission components, and study their properties separately. Below we discuss these properties in more detail and compare the results on B1800 with those on other Vela-like pulsars.
3.1. Energetics and spectra of B1800 and other Vela-like pulsars and PWNe
Since the pulsar wind energetics is supplied by the loss of the pulsar spin energy, it is natural to expect that the PWN luminosity is correlated with the pulsar spin-down power, . Such a correlation was first noticed in X-ray PWN observations with the Einstein observatory (Seward & Wang 1988). On the other hand, as the wind properties can depend on, e.g., pulsar’s magnetic field and the angle between its magnetic and spin axes, and the PWN properties depend on pulsar’s velocity and pressure of ambient medium, we should not expect that the X-ray PWN efficiency, , is the same for all PWNe. To examine the - correlation for similar PSR/PWN systems (–30 kyrs, – ergs s-1)444Pulsars with such and are traditionally dubbed Vela-like pulsars., we have estimated the X-ray PWN luminosities in the 0.5–8 keV band for 9 such objects (in addition to B1800) using archival Chandra data (see Table 2). Figure 7 demonstrates that although there is a positive correlation between and , it is far from linear and shows a large scatter. In particular, the PWN efficiency spans over 2.5 orders of magnitude, in the relatively narrow range, – ergs s-1 (the B1800 PWN luminosity and efficiency are among the lowest in this sample). Such a scatter can hardly be explained by poorly known distances to some of the objects or by the bias caused by a possible underestimation of for distant PWNe, where we can miss a component with lower surface brightness. Interestingly, the two bow-shock PWNe with prominent tails, the Mouse and the Duck, show efficiencies higher than most of the other PWNe in the sample, perhaps because the wind is channeled into a smaller volume produces a brighter X-ray image. Another very bright and efficient PWN is that around PSR J1811–1925, which is located in the young SNR G11.2–0.3, possibly associated with the historical SN of 386 AD (Kaspi et al. 2001b). If this association is correct, the true pulsar age is a factor of 14 smaller than the spin-down age, so that PSR J1811–1925 is much younger than the other pulsars in the sample, which may explain why its PWN is so different. Excluding these three PWNe from the sample substantially narrows the ranges of PWN luminosities and efficiencies:
| (1) |


It is also interesting to compare the PWN X-ray luminosities with the magnetospheric (PL component) pulsar luminosities. We see from Figure 7 that the former exceeds the latter for 9 out of the 10 objects in our sample (the only exception is the Duck PWN and its pulsar B1757–24). Moreover, we see a clear correlation between the two luminosities, which can be described as or, more crudely,
| (2) |
in the 0.5–8 keV band. Overall, the correlation is surprisingly strong, given the fact that was estimated assuming isotropic pulsar emission while the actual pulsar luminosity can be higher or lower than this estimate. The main outliers from this dependence are the Vela, whose pulsar is unusually underluminous (Pavlov et al. 2001a), and the Duck/B1757–24, for which separation of the pulsar and PWN emission is rather unreliable even with the Chandra resolution (Kaspi et al. 2001a). On the other hand, B1800, for which , is a typical PSR/PWN pair in this regard. A natural reason for such a correlation is that both the magnetospheric and PWN radiation are powered by the spin-down energy loss (i.e. both and are correlated with and hence with each other). However, the - correlation shows a smaller scatter than the - correlation, despite the quite different nature of the magnetospheric and PWN X-ray emission. This may suggest that the - correlation is significantly distorted by the distance errors (in contrast to the - correlation that does not depend on distance) or, more likely, that there are some other factors (e.g., the angle between the spin and magnetic axes) that similarly affect the magnetospheric and PWN emission.
The spectral slope of the B1800 PWN is somewhat uncertain because of the small number of counts and the dependence of the fitting parameter on the poorly known (see Figs. 3 and 4). For a plausible , the photon index, for the entire PWN, is typical for the whole sample of PWNe observed in X-rays555We should caution that the photon index generally grows with increasing distance from the pulsar due the synchrotron cooling. Therefore, the value depends on the extraction area chosen, and it may be systematically smaller for more distant and fainter PWNe, where the outer regions with softer emission are too faint to include them in the spectral analysis. This observational bias must be taken into account when comparing PWN spectra., and it is substantially larger than (where ) predicted by the - correlation found by Gotthelf (2003) for a sample of more energetic pulsars. On the other hand, a lower assumed , which cannot be ruled out based on the data available, results in an unusually hard PWN spectrum, . For the broad range of considered, remains similar to those of the other PWNe in Table 2 except for the Mouse and the Duck, whose softer spectra (–2.5) can possibly be explained by a stronger effect of synchrotron cooling in the long PWN tails.
The spectrum of the B1800 pulsar is even more uncertain than that of its PWN. As we have mentioned in §2.2.2, the one-component PL model does not fit the pulsar spectrum for , while the PL component of the PL+BB fit gives , similar of B1800 and to the spectral slopes of many other pulsars. This slope is much softer than predicted by the Gotthelf’s (2003) correlation. Lowering the assumed by a factor of 2 makes a single-component PL fit acceptable, resulting in a rather soft spectrum, . The PL+BB fit at this smaller yields a harder PL component, with (see Fig. 5), which is close to the obtained for this , but still considerably softer the Gotthelf’s (2003) prediction. Overall, we can only state that for B1800 is within the range of values observed for the whole sample of radio pulsars detected in X-rays, including the Vela-like pulsars.
The possible thermal component of the PL+BB fit to the B1800 pulsar spectrum is very poorly constrained, not only because of the poor statistics but also because the soft thermal radiation is strongly absorbed by the ISM. The BB temperature, –3 MK, and bolometric luminosity, – ergs s-1, are similar to those found from the PL+BB fits for other Vela-like pulsars. Such temperatures are somewhat higher than the bulk NS surface temperatures predicted by the standard NS cooling models (e.g., Yakovlev & Pethick 2004), and the corresponding emitting areas are smaller than the NS surface area. However, the actual spectrum of the NS thermal radiation can differ substantially from the BB model. In particular, fitting the spectra with the hydrogen atmosphere models (Pavlov et al. 1995) yields lower effective temperatures and larger emitting areas, with not so strongly different bolometric luminosities (see Pavlov et al. 2001a for the specific example of the Vela pulsar). Unfortunately, the quality of the data do not warrant fits with more complicated atmosphere models, and even the estimate for the bolometric luminosity is too uncertain to make a useful comparison with the NS cooling models.
3.2. Inferences from the PWN morphology
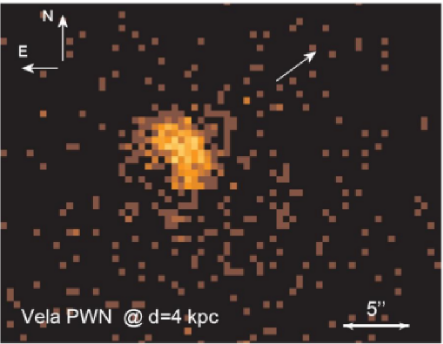
The distribution of X-ray counts in the immediate vicinity of the B1800 pulsar shows that the X-ray PWN is elongated in the direction perpendicular to the pulsar’s proper motion. By analogy with young, bright PWNe (such as the Crab and Vela), the observed PWN shape can be interpreted as a torus with a symmetry axis along the southwest-northeast direction (see Fig. 1). The torus appears to be seen nearly edge-on, implying that the pulsar’s spin axis is close to the plane of the sky. We find no evidence for jets along the symmetry axis. This, however, should not be surprising because such jets can be significantly fainter than the torus (for instance, the Vela PWN outer jets would not be seen in a 30 ks exposure if the Vela PWN were located at a 4 kpc distance while the inner jets would not be resolved; see Fig. 8).
In the B1800 PWN, the torus symmetry axis, which presumably coincides with the pulsar spin axis, is approximately aligned (within ) with the direction of the pulsar’s proper motion. This strengthens the evidence for the alignment between the pulsar spin and velocity vectors, based on a very limited sample of pulsars so far (e.g., Ng & Romani 2004; Johnston et al. 2005), which constrains the physics of SN explosions. It also implies that the total (three-dimensional) speed of the pulsar is close to the measured transverse velocity in the plane of the sky, km s-1 (Brisken et al. 2006).
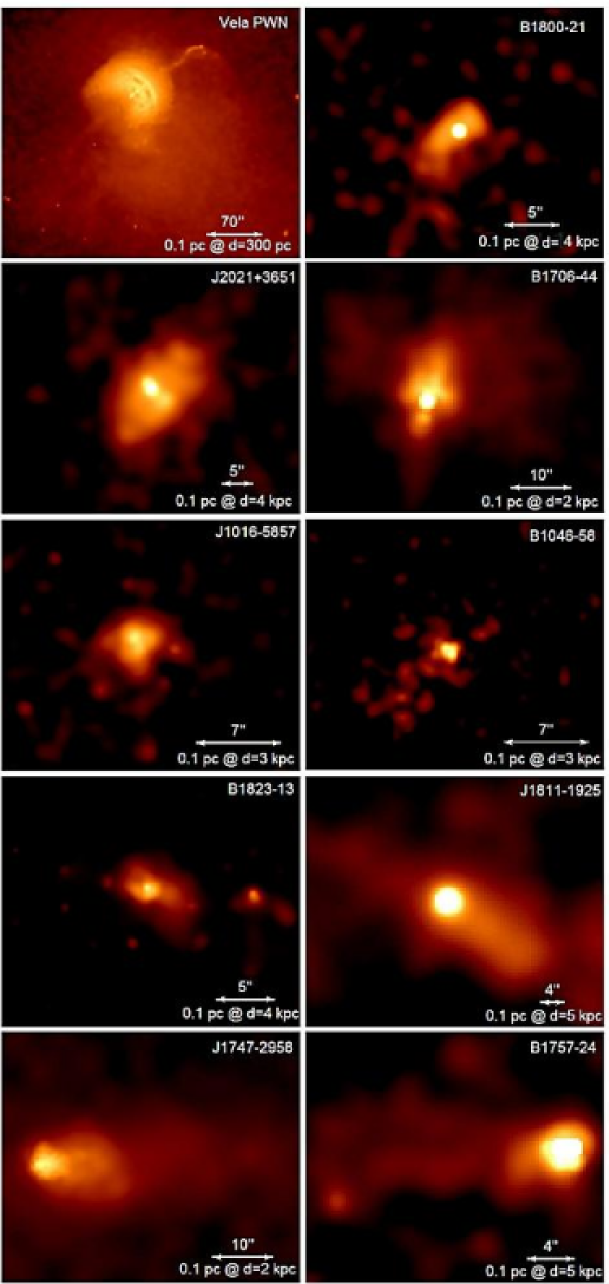
Toroidal (or arc-like) X-ray structures are often found around young pulsars, the Vela and the Crab being the most famous examples. Out of the ten Vela-like pulsars observed with Chandra (see Table 2 and Fig. 9), three (Vela, B1706–44, and J2021+3651) clearly show arc-like (or toroidal) structures and jets in X-rays. On the other hand, the PWNe around J1747–2958 (the Mouse) and B1757–24 (the Duck) exhibit different X-ray morphologies, with prominent tails behind the moving pulsars, indicative of bow-shock PWNe. For the remaining four pulsars (B182313, J10165857, B104658, and J18111925), the existing X-ray data do not allow one to firmly claim the existence of either a tail or a torus based on X-ray data alone.
Despite the relatively high speed of B1800, the PWN shows no evidence of bow-shock morphology. This may look surprising since, for instance, the Mouse PWN, whose pulsar has almost the same age and spin-down power as B1800, clearly shows such morphology, although the speed of its pulsar, inferred from the bow-shock modeling, is only a factor of 1.6 higher (Gaensler et al. 2004)666We should note that the proper motion of PSR J1747–2958 has not been measured. The Mach number was obtained by Gaensler at al. (2004) assuming an ambient pressure ergs cm-3, and the pulsar speed km s-1 was estimated assuming that the ambient medium is a warm ISM with the sound speed km s-1. Both and would be smaller if the ambient pressure is higher than assumed, as one can expect for such a young pulsar ( kyr), which is possibly at outskirts of its SNR. For instance, for , and km s-1, close to the transverse velocity of B1800.. Furthermore, for the Duck PWN, recent radio-interferometric measurements put an upper limit of km s-1 on the transverse pulsar speed (Blazek et al. 2006). Nevertheless, the Duck shows a distinct trail in both radio and X-rays (Frail & Kulkarni 1991; Kaspi et al. 2001a), which is a signature of a ram-pressure confined, supersonically moving PWN. Thus, the different appearance of the B1800 PWN as compared to the Duck and the Mouse should be attributed to differences in the properties of ambient medium rather than to different pulsar velocities.
Assuming that the lack of bow-shock morphology in B1800 implies a subsonic pulsar velocity, we obtain a lower limit on the temperature of the ambient medium, MK. Such a high temperature can only be expected inside a young SNR (e.g., temperatures of up to 14 MK have been measured in the vicinity of the Vela pulsar, although typical temperatures in the Vela SNR are 1–3 MK; Lu & Aschenbach 2000). This means that the radius of the putative host SNR is substantially larger than pc ( in angular scale; for comparison, the radius of the Vela SNR, at 300 pc, would be at kpc). However, our analysis of the ACIS image showed no evidence of an SNR (see §3.1), neither the putative host SNR of B1800 nor the G8.7–0.1 remnant onto which B1800 is projected. If the X-ray spectrum and luminosity of the undected SNR are similar to those of the Vela SNR, the nondetection is not surprising because of the much larger for B1800. For instance, using the PIMMS tool777See http://heasarc.gsfc.nasa.gov/Tools/w3pimms.html., we estimate that the average unabsorbed intensity from the Vela SNR, ergs cm-2 s-1 arcmin-2 in the 0.1–2.4 keV band (Lu & Aschenbach 2000), corresponds to the on-axis ACIS-S3 surface brightness of counts ks-1 arcmin-2 in the 0.5–7 keV band, for the Raymond-Smith thermal plasma emission models with MK and , i.e. at least a factor of 13 below the observed upper limit. Even the hot thermal component of the Vela SNR, such as observed in the vicinity of the Vela pulsar, could hardly be detected in our observation if Vela were at the location of B1800. For instance, ergs cm-2 s-1 arcmin-2 in the 0.9–2.4 band, as estimated from Figures 15 and 9 of Lu & Aschenbach (2000), corresponds to the ACIS-S3 surface brightness of only 1.2 counts ks-1 arcmin-2, for MK and . On the other hand, Finley & Ögelman (1994) did detect extended X-ray emission northeast of the pulsar (this region was out of the Chandra ACIS field of view) and interpreted it as due to a shock in the G8.7–0.1 SNR, reflected from a nearby molecular cloud. Fitting the spectrum of that emission with the Raymond-Smith model, they found –8 MK and –1.4. Based on the currently availble data, we cannot conclude whether this emission is associated with the putative host SNR of B1800 or with G8.7–0.1. In the latter case, the G8.7–0.1 SNR should be at a distance similar to that of the host SNR of B1800 (e.g., 1 kpc foreground) as follows from the similar values.
The shape and size of the B1800 PWN can be used to obtain additional constraints on the properties of the ambient medium, such as pressure, density, and magnetic field. For instance, the ambient pressure confining the PWN should be a sizeable fraction of the pulsar wind pressure at the termination shock, , where ,
| (3) |
is the termination shock radius in the equatorial plane, and the factor takes into account anisotropy of the pulsar wind (for instance, for the often assumed dependence of the wind flux, , on rotational colatitude ; e.g., Bogovalov & Khangoulyan 2002). In well-resolved bright PWNe, such as the Crab and Vela, we see the “inner ring”, commonly associated with the pulsar wind termination shock in the equatorial outflow. We cannot resolve such a ring in the B1800 image, but, by analogy with the bright, well-resolved PWNe, we can assume its radius to be about one half of the radial extent of the X-ray bright torus in equatorial plane. Based on the surface brightness profile shown in Figure 1 (bottom right panel), we take pc as a reasonable estimate, which is close to the values measured in other Vela-like X-ray PWNe with clearly visible toroidal structures (including Vela, B1706–44, and J2021+3651; see Table 2). Then, the ambient pressure can be estimated as
| (4) |
Similar to many other PWNe around young pulsars (see Fig. 10), the estimated ambient pressure is much higher than the typical unperturbed ISM pressure, ergs cm-3, in agreement with our inference that B1800 has not left its SNR.
Using a similar approach, we estimated the pulsar wind pressure at the termination shock for 13 other young PWNe, including the Mouse and the Duck for which is the estimated separation between the pulsar and the bow-shock head, and plotted versus pulsar spin-down age in Figure 10, assuming . Even with allowance for large uncertainties, the pressure does not follow the dependence expected for SNRs in Sedov stage, nor any other smooth dependence. Particularly surprising is the low pressure, ergs cm-3, for the very young ( kyr) PSR B1509–58, which suggests a very unusual SNR for this object, in agreement with X-ray observations (Gaensler et al. 2002). It also hints that PSR B1509–58 moves supersonically (which would require a velocity above km s-1, where ), so that the arc(s) northwest of the pulsar and the bright, long “jet” southeast of the pulsar are elements of a bow-shock PWN rather than a “torus-jet” PWN. We should also note that the spin-down age of a pulsar can differ substantially from its true age, which can contribute to the lack of a clear - correlation in Figure 10. For instance, kyr for PSR J0538+2817 is a factor of 6 larger than the estimated age of the G180.1–1.7 SNR, presumably associated with this pulsar (e.g., Romani & Ng 2003).
Interestingly, the pulsar wind pressure at the head of bow-shock PWNe is similar to that at the termination shock radius of torus-like PWNe, despite the different confining mechanisms. The reason for this coincidence is that, for typical pulsar speeds, the ram pressure caused by the pulsar motion in the ISM, ergs cm-3, is of the same order of magnitude as the ambient pressure inside an SNR confining a torus-like PWN.
Using the above estimate for the ambient pressure confining B1800 and assuming that the ram pressure due to the pulsar’s motion,
| (5) |
is lower than (as expected for the subsonic motion), we obtain an upper limit on the density of the ambient medium, cm-3, or g cm-3.
The measured termination shock radius can also be used to estimate the magnetic field inside the X-ray PWN. According to Kennel & Coroniti (1984), the particle pressure immediately downstream of a strong termination shock perpendicular to the wind (i.e., close to the equatorial plane in our case) is , so that the internal energy is . If is the fraction of the internal energy in the magnetic field, the field can be estimated as , or
| (6) |
The fraction varies along the post-shock flow, and it depends on the magnetization and angular distribution of the pre-shock pulsar wind, as well as on the properties of the termination shock. For instance, in the Kennel & Coroniti (1984) model of spherical shock in an isotropic wind with a small pre-shock magnetization parameter , the magnetic energy fraction is immediately downstream of the shock, and it grows with increasing radius up to at . In a more realistic equatorial outflow geometry, Komissarov & Lyubarsky (2004) found a highly nonuniform distribution of in the postshock flow, with maximum values close to unity. Given the uncertainty of the flow pattern in B1800, we can only crudely estimate G for a typical magnetic field in its PWN, similar to the Vela and other Vela-like PWNe (e.g., Gonzalez et al. 2006).
A crude estimate of the synchrotron cooling time for electrons emitting at an energy (in keV) is yrs, where G. During the time , the pulsar travels the projected distance, pc, corresponding to the angular distance of , considerably smaller than the size of the compact X-ray PWN. For a typical shocked wind flow velocity of , the electrons travel a distance of pc during the synchrotron cooling time, corresponding to an angular distance of , which substantially exceeds the observed extent of the X-ray PWN. We caution, however, that the flow streamlines are curved for an anisotropic pulsar wind (see, e.g., Komissarov & Lyubarsky 2004), so that the actual PWN size can be smaller than this distance. In addition, the synchrotron surface brightness decreases with the distance from the pulsar (see e.g., the Vela PWN image in Fig. 9) rendering fainter emission undetectable during the relatively short ACIS exposure. This could also explain the apparent lack of spectral softening (§2.2.1) due to the synchrotron burn-off, which should become more significant further away from the pulsar. A deeper exposure can reveal the expected faint extension of the X-ray torus beyond the radius if the equatorial flow remains sufficiently well collimated.
The compact inner PWN of B1800, which we interpret as a torus seen edge-on, shows some asymmetry with respect to the spin axis: the projected torus is more elongated towards the southeast, and its southeast edge is more diffuse and fainter than the northwest edge (see Fig. 1). A possible explanation for this asymmetry is a pressure gradient in the ambient SNR matter. As , the pressure gradient leads to an azimuthal dependence of the termination shock radius in the equatorial plane, such that the circular ring turns into an ellipse-like structure. Since the surface of such an asymmetric shock is not perpendicular to the unshocked pulsar wind even in the equatorial plane, the post-shock flow is deflected toward the most distant (southeast) part of the shock, where the magnetic field and the synchrotron emissivity are lower. To produce the observed asymmetry, the pressure difference should be a sizable fraction of the mean ambient pressure, ergs cm-3. Such a difference should cause a local wind in the ambient medium, possibly on a parsec scale, with a typical velocity km s-1, comparable to the pulsar’s velocity. This wind, blowing, e.g., from the west with a speed comparable to that of the pulsar, could also explain the asymmetry of the fainter PWN emission, extended toward southeast-south (see Fig. 2). Similar asymmetry is seen in the brighter nearby Vela PWN (see Fig. 9), which has also been attributed to a local SNR wind (Pavlov et al. 2003). Such pressure gradients and accompanying winds could also be responsible for the asymmetric shape of other PWNe, such as B1823–13 (see Fig. 9).

4. Conclusions
We have detected the X-ray emission from PSR B180021 and its synchrotron nebula, elongated perpendicular to the direction of the pulsar’s proper motion. The shape of the observed PWN suggests that, similar to many other young pulsars, B1800 is surrounded by a compact X-ray torus around an equatorial termination shock in the pulsar wind. The symmetry axis of the torus (i.e. the pulsar’s spin axis) is approximately aligned with the direction of the proper motion. The compact nebula is embedded into a fainter, more extended emission, which shows substantial asymmetry, possibly caused by a pressure gradient in the ambient medium. Despite a rather high velocity of B1800, we find no evidence of a bow-shock X-ray nebula. This implies that the pulsar is still moving in a hot SNR medium, but we do not see the SNR in the Chandra image. In terms of its X-ray efficiency and spectrum, the B1800 PWN is very similar to PWNe around other pulsars of similar ages and spin-down powers, subsonically moving within their SNRs. Bow-shock PWNe associated with young, supersonically moving pulsars show higher X-ray efficiencies and softer spectra.
The spectrum of the B1800 pulsar can be described by a two-component BB+PL model. For reasonable values, the parameters of this model and the corresponding component luminosities resemble those of other Vela-like pulsars.
A deeper Chandra observation would allow one to investigate the morphology of a fainter outer PWN and perhaps reveal the jets along the torus symmetry axis. To look for the putative host SNR and investigate the PWN emission on a larger spatial scale, including its possible connection with the TeV source HESS J1804-216, this field should be observed with XMM-Newton.
References
- (1) Aharonian, F., et al. 2006, ApJ, 636, 777
- (2) Arons, J. 2004, Adv. in Sp. Res., 33, 466
- (3) Baumgartner, W. H., & Mushotzki, R. F. 2006, ApJ, 639, 929
- (4) Blazek, J. A., Gaensler, B. M., Chatterjee, S., van der Swaluw, E., Camilo, F., & Stappers, B. W. 2006, ApJ, in press (astro-ph/0512128)
- (5) Bogovalov, S. V., & Khangoulyan, D. V. 2002, Astron. Lett., 28, 373
- (6) Brisken, W. F., Carrillo-Baragan, M., Kurtz, S., & Finley, J. P. 2006, ApJ, 652, 554
- (7) Brogan, C. L., Gelfand, J. D., Gaensler, B. M., Kassim, N. E., & Lazio, T. J. 2006, ApJ, 639, L25
- (8) Camilo, F., Gaensler, B. M., Gotthelf, E. V., Halpern, J. P. & Manchester, R. N. 2004, ApJ, 616, 1118
- (9) Cash, W. 1979, ApJ, 228, 939
- (10) Cordes, J. M., & Lazio, T. J. 2002, astro-ph/0207156
- (11) Dickey, J. M., & Lockman. F. J. 1990, ARA&A, 28, 215
- (12) Dodson, R., Legge, D., Reynolds, J. E., & McCulloch, P. M. 2003, ApJ, 596, 1137
- (13) Finley, J. P., & Ögelman, H. 1994, ApJ, 434, L25
- (14) Frail, D. A., Kassim, N. E., & Weiler, K. W. 1994, AJ, 107, 1120
- (15) Frail, D. A., & Kulkarni, S. R. 1991, Nature, 352, 785
- (16) Gaensler, B.. M., & Slane, P. O. 2006, ARA&A, 44, 17
- (17) Gaensler, B. M., Arons, J., Kaspi, V. M., Pivovaroff, M. J., Kawai, N., & Tamura, K. 2002, ApJ, 569, 878
- (18) Gaensler, B. M., van der Swaluw, Camilo, F., Kaspi, V. M., Baganoff, F. K., Yusef-Zadeh, F., & Manchester, R. N. 2004, ApJ, 616, 383
- (19) Gonzalez, M. E., Kaspi, V. M., Pivovaroff, M. J., & Gaensler, B. M. 2006, ApJ, 652, 569
- (20) Gotthelf, E. V. 2003, ApJ, 591, 361
- (21) Helfand, D. J., Gotthelf, E. V., & Halpern, J. P. 2001, ApJ, 556, 380
- (22) Hessels, J. W. T., Roberts, M. S. E., Ransom, S. M., Kaspi, V. M., Romani, R. W., Ng, C.-Y., Freire, P. C. C., & Gaensler, B. M. 2004, ApJ, 612, 389
- (23) Johnston, S., Hobbs, G., Vigeland, S., Kramer, M., Weisberg, J. M., & Lyne, A. G. 2005, MNRAS, 364, 1397
- (24) Kargaltsev, O., & Pavlov, G. G. 2006, Astrophys. Space Sci, in press (astro-ph/0609656)
- (25) Kaspi, V. M., Gotthelf, E. V., Gaensler, B. M., & Lyutikov, M. 2001a, ApJ, 562, L163
- (26) Kaspi, V. M., Roberts, M. E., Vasisht, G., Gotthelf, E. V., Pivovaroff, M., & Kawai, N. 2001b, ApJ, 560, 371
- (27) Kaspi, V. M., Roberts, M. S. E., & Harding, A. K. 2004, In “Compact Stellar X-ray Sources”, eds. W.H.G. Lewin & M. van der Klis, in press (astro-ph/0402136)
- (28) Kennel, C. F., & Coroniti, F. V. 1984, ApJ, 283, 694
- (29) Komissarov, S. S., & Lyubarsky, Y. E. 2004, MNRAS, 349, 779
- (30) Lu, F. J., & Aschenbach, B. 2000, A&A, 362, 1083
- (31) Lucy, L. 1974, AJ, 79, 745
- (32) Manchester, R. N., Hobbs, G. B., Teoh, A., & Hobbs, M. 2005, AJ, 129,1993
- (33) Mori, K., Tsunemi, H., Miyata, E., Baluta, C. J., Burrows, D. N., Garmire, G. P., & Chartas, G. 2001, in ASP Conf. Ser. 251, New Century of X-Ray Astronomy, eds. H. Inoue & H. Kunieda (San Francisco: APS), 576
- (34) Ng, C.-Y., & Romani, R. W. 2004, ApJ, 601, 479
- (35) Odegard, N. 1986, AJ, 92, 1372
- (36) Pavlov, G. G., Shibanov, Yu. A., Zavlin, V. E., & Meyer, R. D. 1995, in The Lives of the Neutron Stars, eds. M.A. Alpar, U. Kiziloglu, & J. van Paradijs (Kluwer: Dordrecht),
- (37) Pavlov, G. G., Zavlin, V. E., Sanwal, D., Burwitz, V., & Garmire, G. P. 2001a, ApJ, 552, L129
- (38) Pavlov, G. G., Kargaltsev, O. Y., Sanwal, D., & Garmire, G. P. 2001b, ApJ, 554, L189
- (39) Pavlov, G. G., Teter, M. A., Kargaltsev, O., & Sanwal, D. 2003, ApJ, 591, 1157
- (40) Richardson, W. H. 1972, J. Opt. Soc. Am., 62, 55
- (41) Roberts, M. S. E., Tam, C. R., Kaspi, V. M., Lyutikov, M., Vasisht, G., Pivovaroff, M., Gotthelf, E. V., & Kawai, N. 2003, ApJ, 588, 992
- (42) Romani, R. W., & Ng, C.-Y. 2003, ApJ, 585, L41
- (43) Romani, R. W., Ng, C.-Y., Dodson, R., & Brisken, W. 2005, ApJ, 631, 480
- (44) Seward, F. D., & Wang, Z.-R. 1988, ApJ, 332, 199
- (45) Teter, M. A., Sanwal, D., Pavlov, G. G., & Tsuruta, S. 2003, BAAS, 35, 706
- (46) Tsunemi, H., Mori, K., Miyata, E., Baluta, C. J., Burrows, D. N., Garmire, G. P., & Chartas, G. 2001, ApJ, 554, 496
- (47) Yakovlev, D. G., & Pethick, C. J. 2004, ARA&A, 42, 169
| PSR | aaSpin-down power in units of ergs s-1. | bbDispersion measure distance from the Cordes & Lazio (2002) model. | ccOur best guess for a plausible distance to the pulsar, used to scale all the distance-dependent parameters in this table. For three pulsars, J2021+3651, J1016–5857, and J1747–2958, the adopted distances differ substantially from . In the two cases with the largest DM distances our distance estimates are based on the measured and the Galactic HI column. For the detailed discussion of the distance to J1747–2958, see Gaensler et al. (2004). | dd The hydrogen column density is obtained from the spectral fits to the PWN spectra, except for J1016-5857 and B1046-58 for which the small number of PWN counts precludes a reliable measurement. In these two cases the values (shown in square brackets) are estimated from the pulsar’s DM (assuming 10% ISM ionization). For the Vela PWN we quote the luminosity of the inner compact PWN restricted to the “arcs” region (i.e. within from the pulsar). | ggThermal bolometric luminosity of the BB component from the PL+BB fit in units of ergs s-1. | Ref.llReferences to papers where the corresponding Chandra data have been analyzed. – (1) Pavlov et al. 2001ab; (2) Roberts et al. 2003; (3) Romani et al. 2005; (4) Hessels et al. 2004; (5); Teter et al. 2003; (6) Camilo et al. 2004; (7) Kaspi et al. 2001a; (8) Gaensler et al. 2004; (9) Gonzalez et al. 2006. | |||||||||
|---|---|---|---|---|---|---|---|---|---|---|---|---|---|---|---|
| ms | kyr | kpc | kpc | pc | pc | cgs | |||||||||
| Vela | 0.02 | 0.016 | 8.0 | 1 | |||||||||||
| J1811–1925 | … | 5 | 3.1 | … | … | … | 2 | ||||||||
| B1706–44 | 2 | 0.5 | 0.012 | 3 | |||||||||||
| J2021+3651 | 4 | 0.7 | 0.068 | 0.22 | 4 | ||||||||||
| B1823–13 | 4 | 1.7 | … | … | … | 5 | |||||||||
| J1016–5857 | 3 | [1.2] | … | … | 6 | ||||||||||
| B1757–24 | 125 | 15.5 | 2.6 | 5.22 | 5 | 4.4 | … | 0.05 | 0.3 | 7 | |||||
| J1747–2958 | 5 | 3.0 | … | 0.02 | 1.7 | 8 | |||||||||
| B1800–21 | 134 | 15.8 | 2.2 | 3.88 | 4 | 1.4 | 0.2 | 0.02 | 0.7 | … | |||||
| B1046–58 | 124 | 20.3 | 2.0 | 2.73 | 3 | [0.4] | … | 0.024 | 1.0 | 9 |