The Effect of Cluster Environment on Galaxy Evolution in the Pegasus I Cluster.
Abstract
We present neutral hydrogen observations of 54 galaxies in the Pegasus cluster. The observations include single dish HI measurements, obtained with the Arecibo telescope for all 54 galaxies in the sample, as well as HI images, obtained with the VLA for 10 of these. The Arecibo profiles reveal an overall HI deficiency in the cluster, with 40 of the galaxies in the core of the cluster showing modest deficiencies of typically a factor of 2 – 3. The HI morphology of some galaxies shows that the HI disk is smaller than the optical disk and slightly offset from the stars. We find a correlation between HI deficiency and the ratio of the HI disk size to optical disk size. More HI deficient galaxies have relatively smaller HI disks, a configuration that is usually attributed to an interaction between the interstellar medium (ISM) of the galaxy and the hot intracluster medium (ICM). Such a result is surprising since the Pegasus cluster has a low level of X-ray emission, and a low velocity dispersion. The low velocity dispersion, coupled with the lack of a dense hot ICM indicate that ram pressure stripping should not play a significant role in this environment. In addition, two of the galaxies, NGC7604 and NGC7648, are morphologically peculiar. Their peculiarities indicate contradictory scenarios of what is triggering their unusual star formation. H imaging, along with long-slit spectroscopy of NGC7648 reveal morphological features which point to a recent tidal interaction. On the other hand, H imaging of NGC7604 reveals a strong episode of star formation concentrated into an asymmetric arc, preferentially located on one side of the galaxy. VLA HI mapping shows the HI also highly concentrated into that region, suggestive of a ram pressure event. Our data indicate that ISM-ICM interactions may play a role in a wider variety of environments than suggested by simple ram pressure arguments.
1 Introduction
Understanding the rapid evolution of the star formation rate in rich clusters of galaxies since z=0.5, first documented by Butcher & Oemler (1978, 1984), remains a central issue in extragalactic astronomy. Subsequent spectroscopy and HST imaging has revealed a higher fraction of spiral galaxies in distant clusters than in present epoch clusters (Dressler & Gunn, 1983; Dressler et al., 1999). The heart of the problem, then, is to explain the rapid evolution in the spiral population since z=0.5. It has long been evident that the cluster environment is capable of removing the gas from a galaxy via hydrodynamic interaction between the interstellar medium (ISM) of cluster galaxies and the pervasive hot intracluster medium (ICM) (Gunn & Gott, 1972; Nulsen, 1982; Schulz & Struck, 2002). However, several tidal perturbation scenarios have also been suggested that could drastically deplete the ISM in spiral galaxies by inducing large episodes of star formation (Moore et al., 1996; Bekki, 1999).
It has been generally proposed that hydrodynamic ISM-ICM interaction, most specifically the ram pressure, momentum transfer process introduced by Gunn & Gott (1972), will be most effective in the high velocity-dispersion high ICM density environments of the central regions of rich clusters. In contrast, the lower velocity dispersion environment of poor clusters and galaxy groups has been seen as more conducive to tidal interaction induced effects. However, subsequent work has revealed a potentially more complex situation. First, it has been proposed that the cumulative effect of many high speed tidal encounters in rich clusters can serve to destabilize disk galaxies and lead to gas removal in the “galaxy harassment” process (Moore et al., 1996). Thus the tidal encounter hypothesis might play an important role even in rich clusters. Second, the role of ISM-ICM interaction may be surprisingly ubiquitous in lower ICM density and lower velocity dispersion environments. For example, spiral galaxies with substantial HI depletion have been observed at such remote distances in the outskirts of the Virgo cluster that it appears impossible for these galaxies to have passed through the center of Virgo (Solanes et al., 2002), although a detailed analysis of the errors in distances and depletion factors does raise significant questions about the status of these galaxies (Sanchis et al., 2004). Third, galaxy starvation, as proposed by Larson et al. (1980), removes the HI from a galaxy when it first enters the cluster, reducing significantly the star formation lifetimes, and making it more susceptible to ram pressure effects. In addition, HI imaging of spirals in the low-density Ursa Major cluster reveals large HI filaments in the vicinity of several spirals, possibly indicating substantial loss of HI in progress (Verheijen, 2004). These results have led to the idea of substantial “preprocessing” of the ISM of spirals in lower density environments, although whether the preprocessing is caused by ram pressure or by tidal interaction remains unclear (Verheijen, 2004; van Gorkom, 2004). In addition, several examples have been found of spirals in groups or poor clusters which appear to be undergoing HI depletion and asymmetric star formation that is characteristic of that predicted by the ram pressure process (e.g., Mulchaey et al. (1993)). In particular, the arc-shaped rim of star formation seen in NGC 2276 in the NGC 2300 group, as well as the swept back appearance of its radio emission, (Mulchaey et al., 1993) looks similar to the striking examples of spirals in rich clusters whose optical and radio anomalies are convincingly ascribed to ram pressure effects (Gavazzi et al., 1995; Kenney et al., 2004; Oosterloo & van Gorkom, 2005). Thus there is reason to suspect that something other than the classic ram pressure stripping argument of Gunn & Gott (1972) may be important in lower velocity dispersion environments. Specifically, Gunn & Gott (1972) imply that at a given galactic radius, if the ram pressure exceeds the local restoring force, then the HI gas is completely stripped at that radius. It may be the case that in lower velocity dispersion environments, some of the HI gas (perhaps lower density clouds with larger cross-section) is stripped at a given radius, even if the ram pressure does not exceed the local restoring force.
In this paper we focus our attention on the nearby Pegasus I cluster of galaxies. As is further discussed in §4, the low velocity dispersion in the spiral-rich Pegasus I cluster, coupled with the lack of a dense hot ICM, indicates that ram pressure stripping should not play a significant role in this environment. Thus, Pegasus I in principle provides an ideal case in which to isolate the effects of tidal perturbations on the evolution of galaxies.
However, it has recently been shown, contrary to previous studies (Schommer et al., 1981), that at least some spiral galaxies in the Pegasus I cluster have a deficiency in HI content (Solanes et al., 2001; Giovanelli & Haynes, 1985). Giovanelli & Haynes (1985) find 3 of 17 spiral galaxies, within 1RA of the Pegasus I cluster center, are deficient by a factor of 2 or more. Solanes et al. (2001) find 10 of 25 spiral galaxies, within 1RA of the Pegasus I cluster center, have DEF0.3. This fact has important implications in regards to the evolution of cluster galaxies; i.e., ISM-ICM interactions may play a significant role in galaxy evolution in a wider variety of environments than expected from the classic Gunn & Gott (1972) argument that ISM-ICM effects occur only when the gravitational restoring force of the stellar disk is exceeded by the ram pressure momentum transfer.
In this paper we provide both single-dish and spatially resolved observations of the HI disks of spiral galaxies in the Pegasus I cluster, as well as a limited amount of optical broadband and H imaging. In §2 we present the observational data, while in §3 the HI properties of the Pegasus I galaxies are derived and summarized. In §4 we discuss the HI deficiencies of the Pegasus I galaxies and put our results into the context of other studies in §5.
2 Observations
2.1 Sample of Galaxies
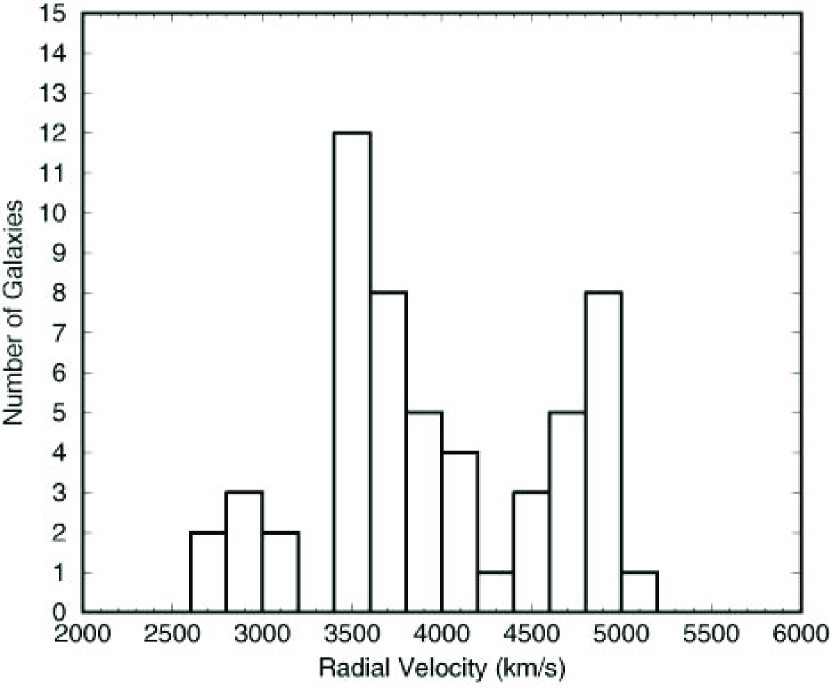
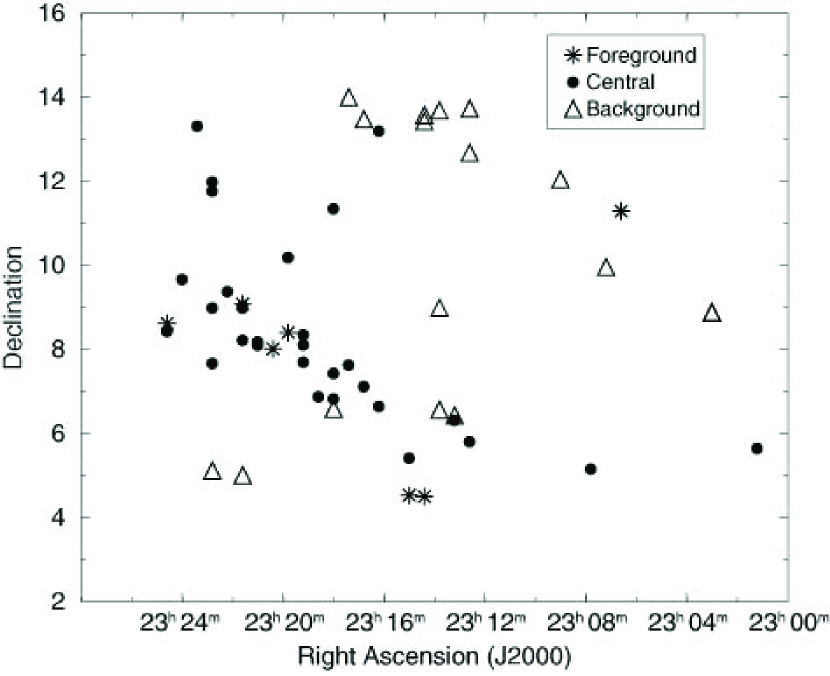
The Pegasus I galaxy cluster was originally delineated by Zwicky, Karpowicz, & Kowal (1965). The structure of the cluster, and its separation from the background Pegasus II cluster, was further established by the optical redshift survey of Chincarini & Rood (1976). Subsequent studies of the HI content of spirals in Pegasus I (Schommer et al., 1981; Richter & Huchtmeier, 1982; Giovanelli & Haynes, 1985; Solanes et al., 2001) have provided further redshift data, as well as contradictory claims regarding depletion of HI in Pegasus I spirals. We have chosen our sample of galaxies to lie within an RA range of 23h and 23h 30m and DEC between 2∘and 14∘, following Richter & Huchtmeier (1982). Figure 1 shows a velocity histogram for this sample of 54 galaxies. From here, we can distinguish three separate groupings. There is a central group, with a mean redshift of 3900 km s-1, which is situated between a foreground and a background group. The foreground group has a mean redshift of 2900 km s-1and is composed of 7 disk galaxies, which have velocities between 2500 km s-1and 3400 km s-1. The central group has a mean redshift of 3900 km s-1and is composed of 30 galaxies with velocities between 3400 km s-1and 4400 km s-1. Of these 30 galaxies, 28 of these are disk galaxies with known morphological types, and 2 of these (NGC7604 and NGC7648) are morphologically peculiar. These two peculiar galaxies will be discussed in detail in Section 6. It is important to note that the 2 central ellipticals (NGC7619 and NGC7626) fall in the velocity range of the central group. The background group has a mean redshift of 5000 km s-1, and is composed of 17 disk galaxies with a velocities between 4400 km s-1and 6000 km s-1. Figure 2 shows the spatial distribution of these galaxies, with the foreground group indicated with stars, the central group indicated with dots and the background group indicated with triangles. Upon inspection of Figure 1 and Figure 2, we see that the foreground group and the central group are close in projection on the sky, while the background group appears spatially displaced from the other two groupings. It may be the case, then, that the foreground group is part of the central group, constituting its low velocity members. The background group may be associated with the main ridge of the Pisces-Perseus supercluster which lies at a redshift of between 4000 and 6500 km s-1. Haynes & Giovanelli (1986) show that the southern region of the Pisces-Perseus supercluster ridge (DEC 35∘) is composed of filaments which connect the supercluster with the Local Supercluster, and that Pegasus is embedded in this narrow filament. It is also worth noting that, as pointed out by Chincarini & Rood (1976), the Pegasus I galaxies appear flattened on the sky into a linear configuration, with many galaxies trailing off to the Southwest of the two central ellipticals. This tendency is also evident in Fig. 2. In fact, all three redshift components (foreground, central cluster, and background) appear to follow a NE-SW axis, with the background component displaced to the Northwest. Note that the three galaxies in the background component that lie furthest to the Southeast, and thus do not follow the general linear trend, are also at the high velocity end of that component, and may form a separate group.
We also obtained 21 cm observations of non-Pegasus spiral galaxies with the Arecibo111The Arecibo Observatory is part of the National Astronomy and Ionosphere Center, which is operated by Cornell University under a cooperative agreement with the National Science Foundation. telescope during the one hour after Pegasus I had transited past the zenith angle constraint. Altogether, 17 spiral galaxies approximately one hour East of Pegasus were observed, and are used as a comparison sample for the Pegasus I galaxies. Most of these galaxies are in the Perseus-Pisces supercluster and are discussed in more detail in Section 4.
2.2 Arecibo HI Profiles
HI 21 cm line observations were obtained with the Arecibo 305 meter telescope of the 54 galaxies in the Pegasus I cluster, and the 17 non-Pegasus spirals. Forty six of these Pegasus galaxies, as well as the 17 non-Pegasus I galaxies that form a reference sample (as described in Section 2.1), were observed in September 2002 using the dual circular L-narrow receiver, with the four subcorrelators covering a frequency range of 25 MHz, with 2048 channels, resulting in a resolution of 2.6 km s-1. 8 galaxies were observed in October 2004 using the dual linear L-wide receiver, with 1024 channels, and a resolution of 5.3 km s-1. Both of these sets of observations were made with a beam-width of 3 arcmin at 1415 MHz, and each galaxy in the sample was observed in total power mode with 5 minutes spent ON the galaxy and 5 minutes spent OFF the galaxy. Total ON-source integration times ranged from 5 to 60 minutes. Each ON/OFF pair was then averaged together, and boxcar smoothed using 5 channel bins. The baseline for each averaged spectrum was fit by a polynomial and subtracted, and the integrated HI flux was obtained in Jy km s-1. For each averaged spectra, the rms noise was obtained by integrating the flux in the baseline, in bins of 400 km s-1. For the frequency range of 25MHz, this resulted in approximately 12 bins across the baseline (not including the detection). The rms scatter was calculated for these 12 measurements of the baseline, and this is the error in the flux, which is on the order of 0.1 Jy km s-1.
The Arecibo 21 cm observations were made with the upgraded Gregorian feed system, reducing the uncertainty in the 21 cm fluxes significantly from the previous observations by Schommer et al. (1981), Giovanelli & Haynes (1985), and Solanes et al. (2001). With the improved sensitivity of the Gregorian feed system, the uncertainties in the HI fluxes have now been reduced to the point where other uncertainties, i.e., optical angular diameters, apparent blue magnitudes and determination of morphological types, now represent the principal error in diagnosing the HI deficiency.
2.3 VLA HI Imaging
HI 21 cm line observations were made in April and May of 2004, using the CS configuration of the Very Large Array (VLA)222The National Radio Astronomy Observatory is a facility of the National Science Foundation operated under cooperative agreement by Associated Universities, Inc. with spacings ranging from 0.035 to 3.4 km. The observations were pointed at nine galaxies individually and one pointing was centered at the center of the Pegasus cluster. Typical observing time on source was 7 hrs. A nearby phase calibrator, 2255+132, was observed every 45 minutes and 0137+331 (3C48) was observed as flux (16.0 Jy) and bandpass calibrator. For the observations of all but one of the individual galaxies the correlator was configured to cover 3.125 MHz with 63 velocity channels, using online Hanning smoothing. The resulting channel spacing and velocity resolution is about 10 km s-1. For the central pointing and one of the galaxies, we used a 6.25 MHz bandwidth and 63 channels with no online Hanning smoothing, resulting in a 20 km s-1velocity resolution, but a larger velocity coverage. Instrumental parameters of the observations are summarized in Table 1. We used NRAO’s Astronomical Image Processing System (AIPS) to do the calibration and imaging. Initially data cubes were made without continuum subtraction and inspected for HI line emission. In several of the cubes more than one galaxy was detected. We identified channels without line emission. The continuum was subtracted in the UV plane by making a linear fit through the line-free channels. Image cubes were made with various weighting schemes. Here we present results using uniform weight and robust 1, which optimizes sensitivity, while still producing a gaussian beam. The resulting angular resolutions are listed in Table 1. The images were CLEANed. The resulting rms noise in the images is typically 0.35 mJy beam-1 or about 1019 cm-2 per 10 km s-1channel. Total HI images were made by smoothing the cubes spatially and in velocity, in the smoothed cube we then set all pixels below 1 or 2 sigma to zero and used this as a mask for the full resolution cube to calculate the moments.
2.4 Optical Observations
We also have optical imaging of NGC7604 and NGC7648. The optical H, B, and I band images were taken with the 2.4 meter MDM telescope in September 2001, using the MDM 8K x 8K mosaic CCD camera, with a pixel size of 15 microns. The scale is 0.206 arcsec/pixel and the images have been binned 2x2, so the final image scale is 0.41 arcsec/pixel. The B-band and I-band images have 300 second exposure times and the H images have 600 second exposure times. The H images were taken through both on-line and off-line interference filters, and the final H-only images were constructed from the difference between registered and normalized on-line and off-line exposures.
3 Derivation of Galaxy Properties
Of the 54 observed galaxies in the Pegasus I cluster, 52 of these are spiral galaxies with known morphological type, and 2 are morphologically peculiar. The Arecibo HI profiles for the 52 disk galaxies can be found at http://www.physics.unc.edu/llevy/pegasus. Tables 2, and 3 present the data for the 54 Pegasus galaxies and the 17 non-Pegasus spiral galaxies observed.
Table 2 includes the physical properties of the observed galaxies.
Columns 1 and 2: galaxy name; (1) NGC or alternate name; (2) UGC name.
Columns 3 and 4: RA and DEC in J2000.0 coordinates obtained from the NASA Extragalactic Database (NED)333NED is operated by the Jet Propulsion Laboratory, California Institute of Technology, under contract with the National Aeronautics and Space Administration..
Column 5: heliocentric 21 cm velocity, in km s-1, obtained from NED. The NED velocities agree well with the Arecibo profiles, except for NGC7615, where we use the velocity obtained from the Arecibo profile.
Column 6: morphological type, in de Vaucouleurs (RC3) notation, ignoring the presence of bars. Where the superscripts are: (a) obtained using the RC3 catalogue, (b) measured by the authors using the Palomar Sky Survey prints.
Column 7: apparent blue magnitude corrected for galactic extinction, internal extinction, and redshift correction as prescribed in Buta (1996). The superscripts are (a) corrected magnitude obtained using the RC3 catalogue, the error in magnitude is 0.13 mag (Buta, 1996), (b) the uncorrected magnitude is obtained using the UGC, and corrected as prescribed in Buta (1996), (c) uncorrected magnitude, obtained from the Zwicky catalog, and corrected as prescribed in Buta (1996), (d) uncorrected magnitude, obtained from the Flat Galaxy Catalogue, and corrected as prescribed in Buta (1996).
Column 8: blue semi-major axis, in arcminutes. The superscripts are: (a) obtained using the UGC catalogue, where the error in the semi-major axis is 15 (Haynes & Giovanelli, 1984), (b) measured by the authors using the Palomar Sky Survey prints.
Column 9: ratio of the semi-major axis to the semi-minor axis: b/a.
Column 10: velocity width, in km s-1, defined as 20 of the peak and determined from the Arecibo HI profiles.
The HI deficiencies and other derived quantities are computed for these galaxies and shown in Table 3.
Columns 1 and 2: galaxy name; (1) NGC or alternate name; (2) UGC name. An asterisk following the name indicates the Arecibo data was taken on the second observing run in October 2004.
Column 3: morphological type, taken from column 6 of Table 2.
Column 4: total exposure time, in minutes, for the Arecibo HI profiles.
Column 5: 21 cm flux, in Jy km s-1, obtained from the Arecibo HI profiles, corrected for pointing errors and aperture adjustments. The error in the pointing is less than 5 arcseconds. The aperture correction is 2.
Column 6: log of the HI Mass, where:
where the distance to each galaxy is taken as the distance to the Pegasus I cluster center. Using an H0 of 100 km s-1Mpc-1, results in a distance to Pegasus I of 40 Mpc.
Column 7: log of the blue luminosity, in L, with LB☉=5.37 (Stebbins & Kron, 1957), and with m0 from column 7 in Table 2.
Column 8: log of the linear optical diameter squared, in kpc2. The linear optical diameter is the UGC blue semi-major axis (from Table 2) converted to kpc (Solanes, Giovanelli, & Haynes, 1996):
Column 9: HI deficiency factor calculated following the method prescribed by Solanes, Giovanelli, & Haynes (1996) (hereafter SGH96).
where the expected value is calculated using Table 2 in SGH96, and a DEF greater than zero is HI deficient.
4 HI Deficiency
The primary goal of this paper is to ascertain whether spiral galaxies in the Pegasus I galaxy cluster exhibit deficiencies in their HI content, as is so evident in the case of spirals in richer clusters with a well-developed hot ICM (e.g., Coma (Gavazzi, 1987) and Virgo (Cayatte et al., 1994)). As was mentioned in §1, it is generally considered that HI deficiencies in cluster spirals are primarily caused by ram pressure stripping of the galaxy’s ISM as it impacts the hot ICM, as originally proposed by Gunn & Gott (1972). The case for ram pressure stripping is made when the ram pressure, characterized by (where is the density of the ICM and is the typical velocity of a galaxy in the cluster), exceeds the gravitational restoring force of the disk. In Table 4 we summarize the relevant data for several clusters of different richness, to place the Pegasus I cluster into perspective. In column (2) we list the percentages of early-type vs late-type galaxies. In columns (3), (4), and (5) are given the line-of-sight velocity dispersion in the cluster, the cluster X-ray luminosity, and the central electron density, inferred from fitting to the X-ray data. In column (6), the ram pressure is given. For reference, the gravitational restoring force in a spiral disk typically amounts to 1000 (km s-1)2 cm-2. Thus while ram pressure stripping is expected to be effective in the central regions of Coma and Virgo, it should fail by at least a factor of 50 in Pegasus I. Consequently, we do not, a priori, expect to see stripped spirals in Pegasus I.
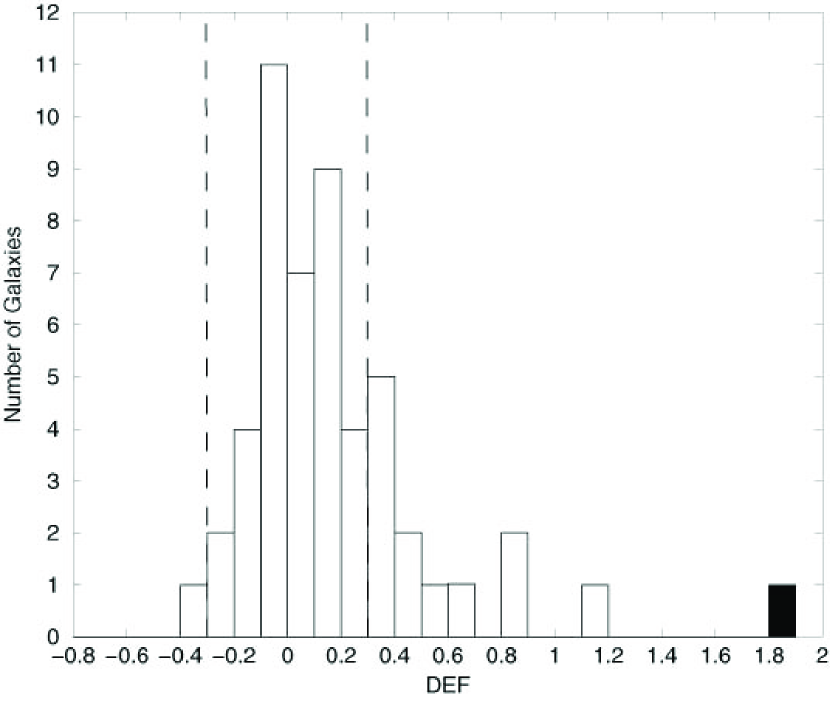
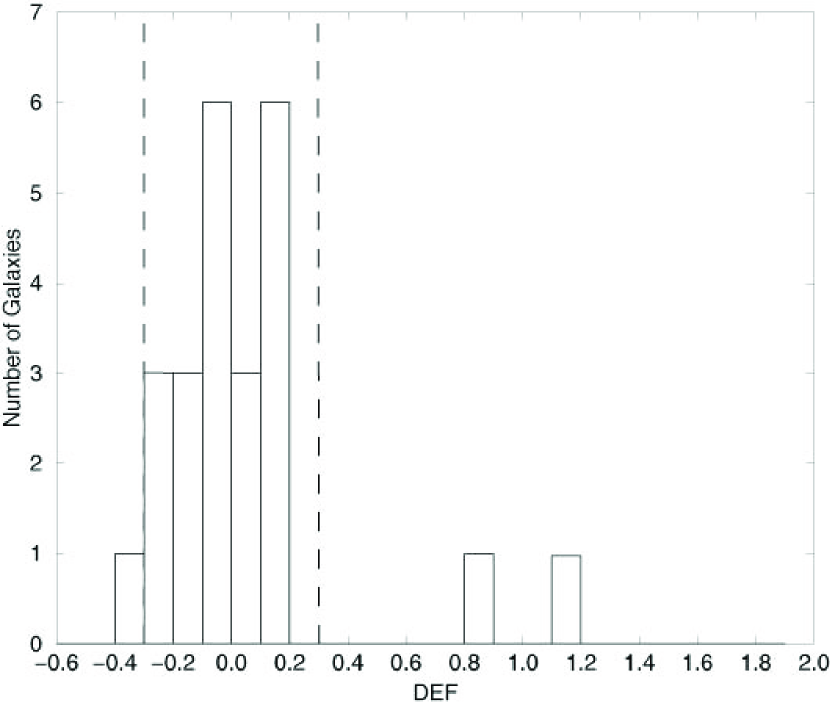
Before discussing HI deficiencies in Pegasus I spirals, we require a clear idea as to what constitutes an HI deficient galaxy. In what follows, we use the definition of HI deficiency specified in Solanes, Giovanelli, & Haynes (1996), while considering the effect of using other deficiency definitions in §4.1. With that in mind we have examined the histogram of HI deficiencies for all of the Pegasus I spirals observed by us at Arecibo.444We have eliminated the Seyfert 1 galaxy NGC7469 from further consideration, since this galaxy shows strong HI self-absorption in its Arecibo profile, resulting in a spuriously high HI deficiency factor. Elimination of NGC7469 leaves us with 51 spirals in our sample. That histogram is plotted in Figure 3. The filled rectangle represents NGC7563 which is a non-detection, and its value of DEF is a lower-limit. It is evident from Figure 3 that there is a substantial “cosmic” scatter in HI content, but that there is also an asymmetric tail to positive HI deficiencies, thus indicating that at least some spirals in Pegasus I are HI deficient. Given the rather continuous nature of the tail to positive DEF factors, however, it is not clear from the outset if there is a particular DEF value above which one can make a strong case for HI deficiency, and if so, what that DEF value is. Thus in what follows, we first argue that there is indeed a clear case of HI deficient spirals in Pegasus I, particularly in the central region of the cluster. Then we make a statistical case for a deficiency factor of DEF=0.3 as the dividing line for spirals which are highly likely to be HI deficient.
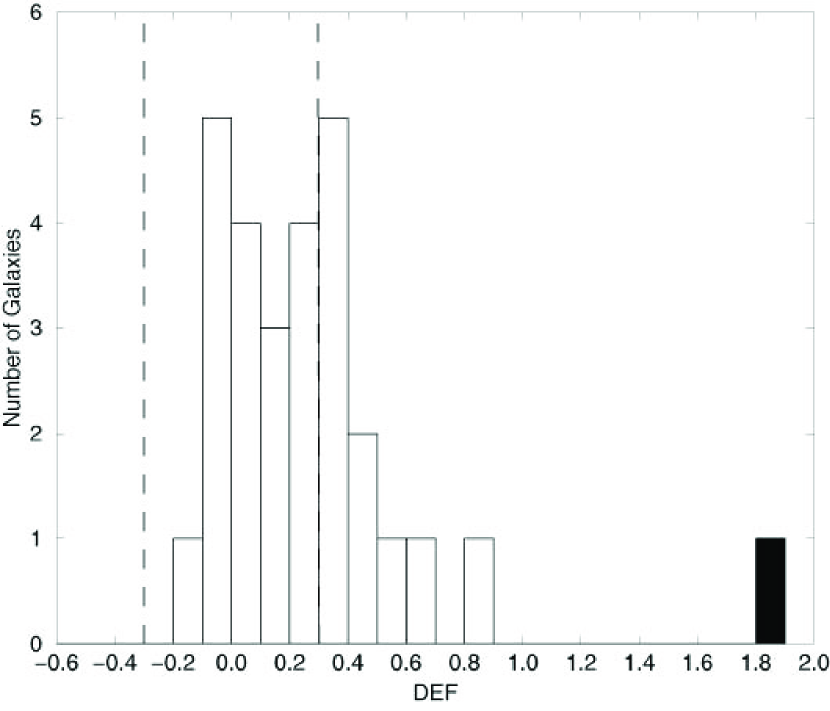
To begin with, we make a comparison between the DEF factors for spirals in the central region of Pegasus I versus those in the foreground and background groups. In Figure 5 is plotted the histogram of deficiency factors for the 28 disk galaxies in the central Pegasus I cluster. The filled rectangle represents NGC7653, which is a non-detection, thus its DEF value is a lower-limit. The offset in the distribution of DEF values towards positive deficiency factors is more pronounced than for the whole sample plotted in Figure 4. Of the 28 disk galaxies in the central cluster, 6 have DEF0.4 and 6 have 0.3DEF0.4. In contrast, the histogram of DEF factors for the 23 spirals in the foreground and background groups is plotted in Figure 5. In this case the evidence for HI deficiency is substantially weaker, particularly when compared with the that for the central cluster shown in Figure 4. Of the 23 spirals in the foreground and background groups, only two, i.e., 9% of the sample, have DEF0.3, as opposed to 40% of the central cluster sample (12 out of 28). In addition, the non-parametric Kolmogorov-Smirnov two-sample test, when applied to the DEF factors in the central group versus those in the foreground and background group, rejects the hypothesis that the two samples are drawn from the same parent population at the 97% confidence level. In short, the spirals in the central cluster on average have greater DEF factors than their counterparts in the foreground and background groups.
We can make a second control test for HI deficiency in the central cluster galaxies by comparing with the DEF factors for the sample of 17 spirals that we observed approximately 1 hour East of Pegasus I, which were accessible to us after Pegasus I had transited through the observing window for Arecibo, and before our observing sessions had ended. Centered at RA, many of these spirals are located within the Pisces-Perseus Supercluster (PPS), as can be seen in Figure 1 of Haynes & Giovanelli (1986). In fact, of the 17 spirals, 11 of them are within the spatial and velocity limits of the PPS. And of those 11 spirals, 9 of them lie within the spatial and velocity limits of a the cluster 0019+2207 (Han & Mould, 1992). The basic information on the HI content and DEF factors of these 17 galaxies is compiled in Tables 2 and 3. The results are as follows. There is a single galaxy at low redshift (cz2300 km s-1) which has DEF=-0.07. There is a group of 5 galaxies clustered at a mean redshift of cz4500 km s-1, which have a median DEF=0.09, and which are foreground to the PPS. There are two galaxies with cz5000 km s-1that are likely located in the PPS, but not in the cluster 0019+2207, which have DEF=0.13 and DEF=0.46. Finally, the 11 spirals in 0019+2207 have median DEF=0.48. While we are dealing with small numbers of galaxies, the results indicate that for galaxies outside the PPS, there is no evidence for significant Hi depletion, while for the galaxies situated in the the cluster 0019+2207 within the PPS, there is evidence for HI deficiency. Furthermore, 0019+2207, like Pegasus I, is not a rich cluster. If one takes the velocity data for the 10 galaxies given in Han & Mould (1992), the mean cluster redshift is km s-1, with a 1 dispersion of 336 km s-1, while if one galaxy with high velocity is rejected, the remaining 9 galaxies high a mean redshift km s-1, with a 1 dispersion of 203 km s-1. Hence 0019+2207 has a low velocity dispersion, comparable to that of the core of Pegasus I, and yet also exhibits evidence for HI depletion.
While the above analysis indicates that Pegasus I spirals in the cluster core have a skewed distribution to positive DEF values, it is somewhat problematic to determine what constitutes a significant HI depletion level, especially since there is a certain degree of both observational error and cosmic scatter in the DEF data. To separate real HI depletions from cosmic scatter, we have analyzed the distribution of DEF factors following three approaches. In all cases a gaussian was fit to the distribution of DEF factors. First, a gaussian fit with a 2.5-sigma clipping resulted in an rms scatter in the deficiency of 0.26 (with a mean of DEF=0.13) for the full sample of 51 foreground, central, and background groups, 0.17 (mean DEF=0.15) for the central group alone, and 0.15 (mean of -0.03) for the sample containing the foreground and background groups. If, instead, a 2-sigma clipping is applied, an rms scatter in the deficiency of 0.15 for the foreground, central, and background groups as a whole, 0.12 for the central group, and 0.13 for the foreground and background groups sample is obtained. Finally, since it is evident the above discussion that the distribution of DEF values is skewed on the positive side by galaxies with HI depletion, a gaussian was fit to only the negative DEF values, which have a well behaved distribution, and thus are likely to give a better estimate of the cosmic scatter in DEF values. This one-sided fit resulted in an rms scatter in the deficiency of 0.14 for the complete sample of foreground, central, and background groups, 0.04 for the central group, and 0.12 for the foreground and background groups sample. Based on the above information, we consider that the 1 cosmic scatter in our DEF values is no larger than 0.15, and assume this value for the scatter. Consequently, any galaxy with a DEF value of 0.3 or greater has a high probability of being a truly HI-deficient galaxy, given that it is greater than 2 from the mean. For the remainder of the paper, we will consider a deficiency factor DEF0.3 (i.e., an HI depletion of a factor of two or greater) to represent the line at which we can confidently argue for a real HI deficiency. Naturally, some of the galaxies with slightly lower deficiencies than DEF=0.3 are likely also to be HI-deficient. However, in those cases one cannot make a convincing case for HI deficiency in any one specific galaxy.
Finally, it is important to note that in Figure 3 the distribution is centered around zero, but with an asymmetric tail towards positive deficiency values. In Figure 4, the distribution is centered around 0.1 and also shows an asymmetric tail towards positive deficiency values. In richer, higher- clusters that are believed to have undergone extensive ram pressure stripping, such as Virgo, the mean HI deficiency is centered around larger positive values (DEF0.4), and, in the case of Virgo, around 75 of the spiral galaxies in the cluster are HI deficient (Solanes et al., 2001). Thus there is a clear difference between the typical level of HI depletion found for Pegasus I spirals and that found for spirals in richer clusters.
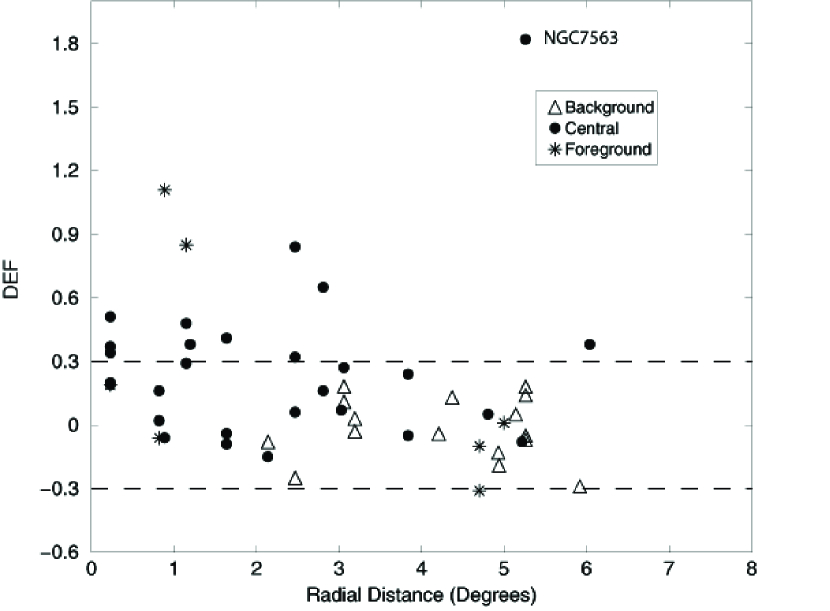
A plot of how deficiency factor varies with radial distance from the center of the cluster is shown in Figure 6. The galaxies in the foreground group are indicated with stars, the central group with dots and the background group with triangles. The horizontal dashed lines mark where DEF=0.30. We see that most of the galaxies whose deficiencies are greater than a factor of two are located within the inner 2.5∘. The two outlying highly deficient galaxies at around 5∘are the central group galaxy NGC7563, and the background group galaxy NGC7469. NGC7563 is an Sa galaxy, with a companion UGC12463 at 3.7 arcmin. From the HI profile, we see that no HI is detected, and thus the DEF value is a lower limit.
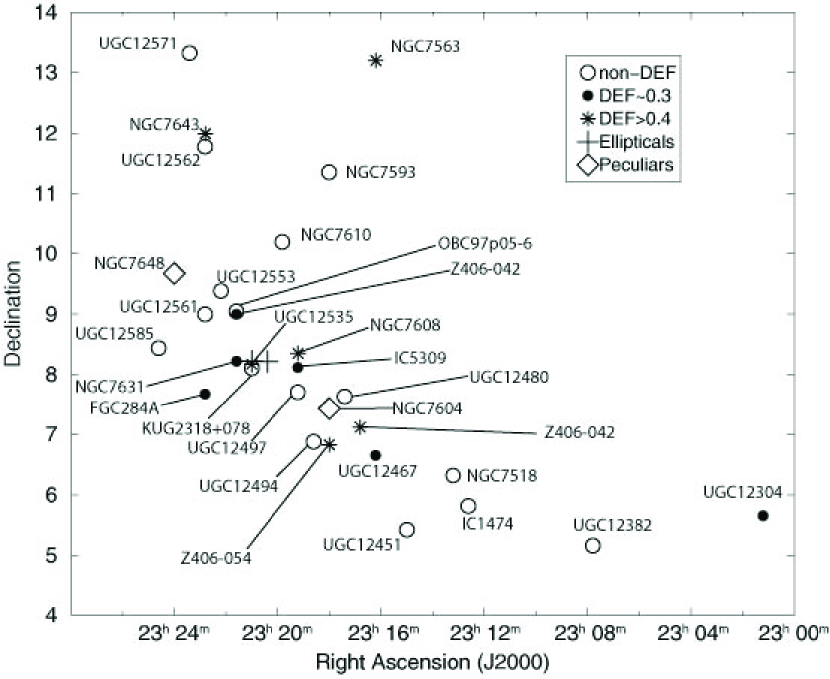
Figure 7 shows the spatial distribution of the galaxies in the central group of our sample. The two central ellipticals, NGC7619 and NGC7626 are indicated with crosses. The two morphologically peculiar galaxies, which will be discussed in detail in §6, are indicated with diamonds. The non-deficient galaxies are marked with open circles, the slightly deficient galaxies are marked with filled circles, and the highly deficient galaxies are indicated with stars.
4.1 Comparison with Previous Results
Previous studies of Pegasus I spirals (Schommer et al., 1981; Giovanelli & Haynes, 1985; Solanes et al., 2001) have produced somewhat contradictory results about HI deficiencies, with earlier results tending to find no HI deficiencies while Solanes et al. (2001) do indeed find significant HI depletions. Part of this change in perspective is due to observations of increased accuracy. Since most of the observed deficiencies in Pegasus turn out to be at a modest (factor of 2) level, high quality data is required to make such depletions evident. In addition, the sample of galaxies used to define the Pegasus I cluster has differed, producing somewhat different results for the overall HI deficiency of the cluster. Schommer et al. (1981) and Giovanelli & Haynes (1985) used a sample of galaxies that extends far out from the cluster center, possibly including galaxies not associated with the cluster. They both find no evidence for HI deficiency. Solanes et al. (2001) calculates the HI deficiency for a large, extended sample, similar to Giovanelli & Haynes (1985), and for the Pegasus galaxies located within 1RA of the cluster core. The extended sample shows no evidence of HI deficiency, but the sample within 1RA of the core shows about 40% of the galaxies to be HI deficient. Our results agree very closely with those obtained by Solanes et al. (2001), i.e., that in the central core of the Pegasus I cluster, 40 of the spirals exhibit modest HI depletions. In the foreground and background groups, the incidence of deficiency is considerably lower, which also helps to explain the fact that earlier results (Schommer et al., 1981; Giovanelli & Haynes, 1985) did not find evidence for HI depletion, since those studies were not concentrated on the Pegasus I core.
5 HI Imaging
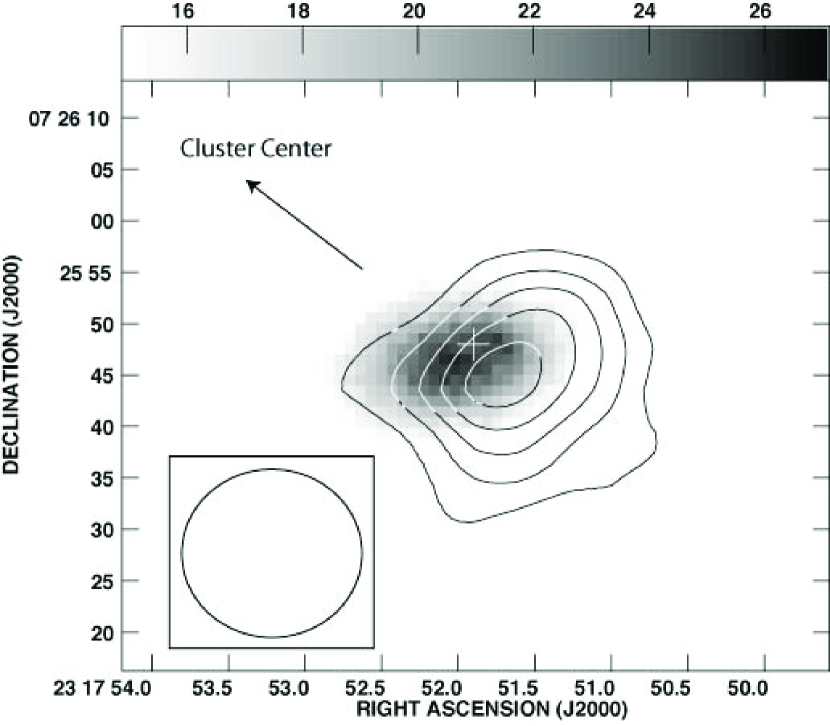
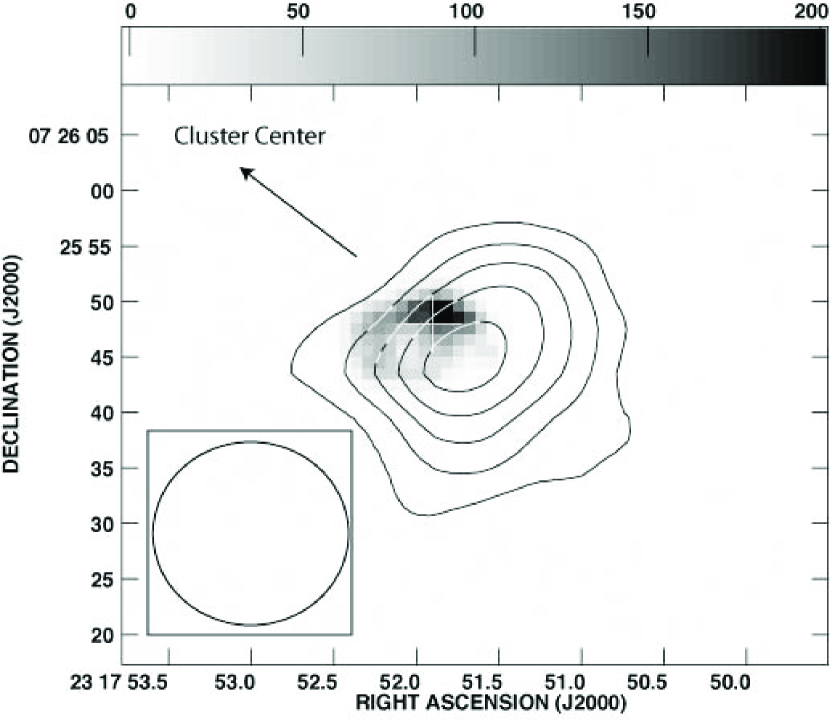
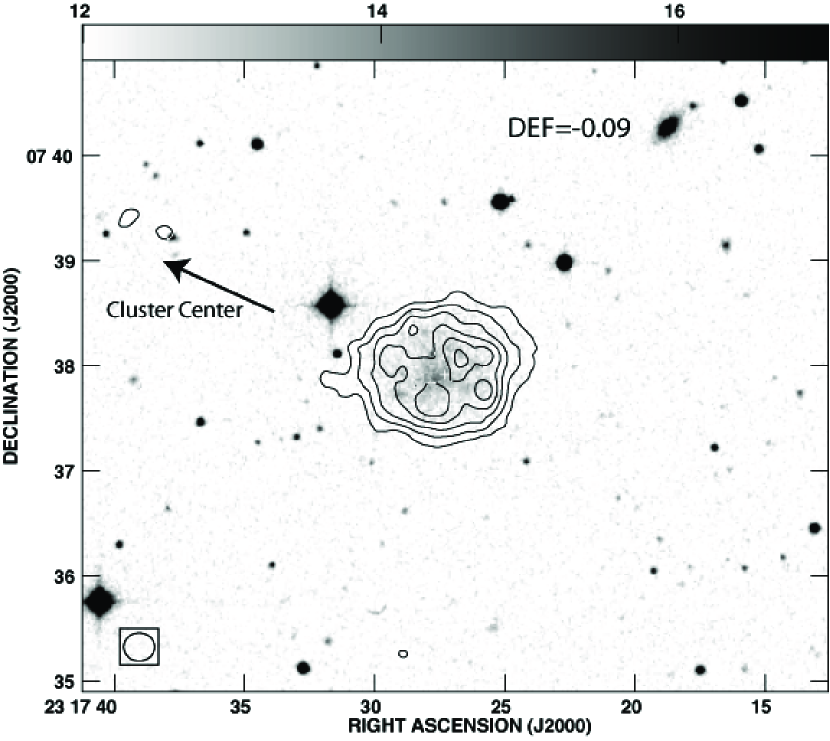
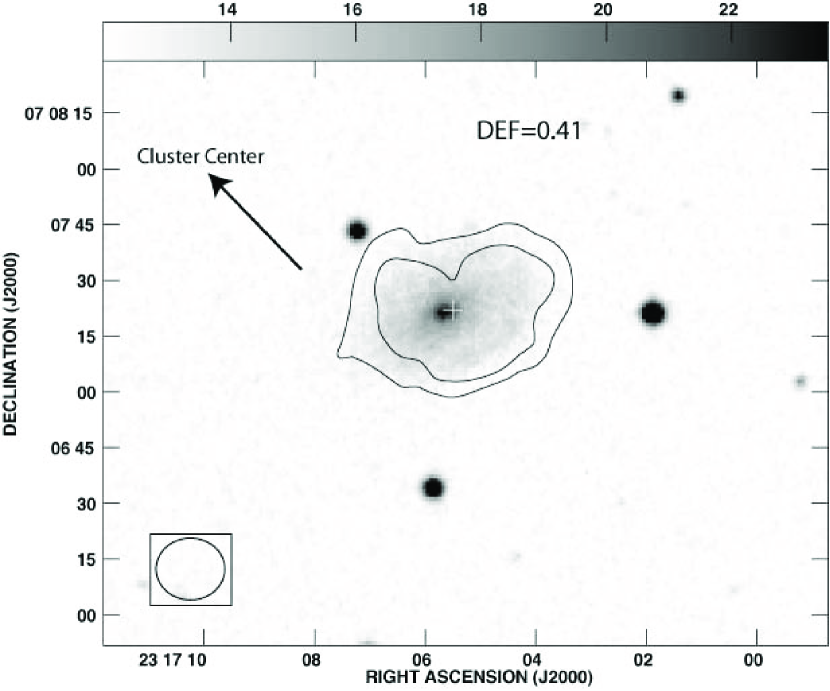
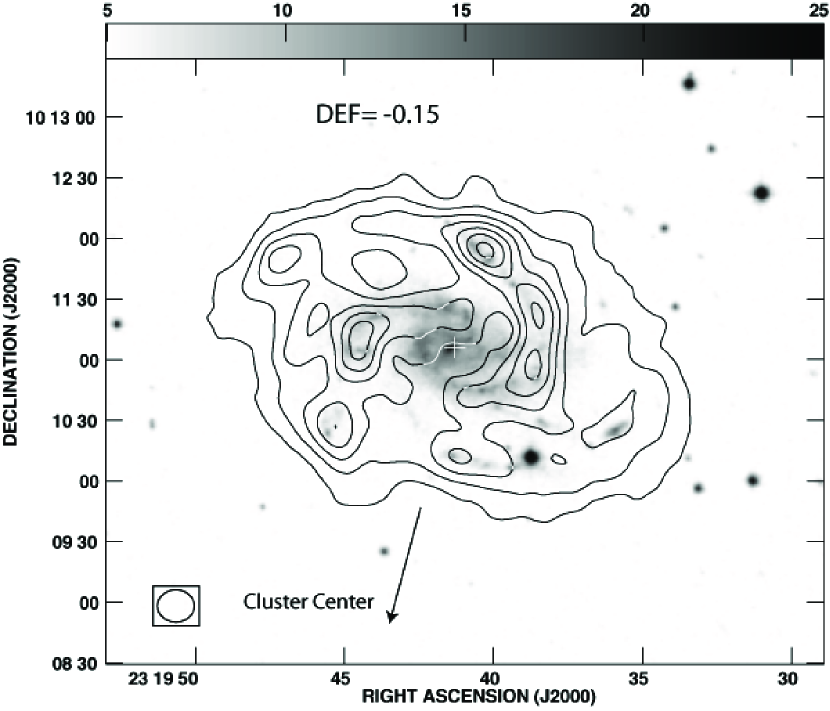
While the overall HI deficiencies observed with the Arecibo radio telescope indicate that the ISM is being depleted in many spirals in the Pegasus I cluster, a more direct indication as to the effects of ram pressure stripping can be obtained from spatially resolved observations of the ISM. Specifically, highly truncated HI disks have been found in both Virgo (Warmels, 1988; Cayatte et al., 1990, 1994) and Coma (Bravo-Alfaro et al., 2001) cluster spirals, which more directly indicates that a sweeping mechanism has depleted the outer parts of the HI disks. Perhaps even more telling are cases in which the HI disk is significantly offset and/or distorted in a way that indicates that much of the gas is now extraplanar (Kenney et al., 2004; Crowl et al., 2005). This decoupling between gas and stars almost surely implies a stripping event caught in the act. As well, cluster spirals are found with extraplanar radio continuum emission (Gavazzi et al., 1995). To evaluate whether such activity can be seen in the lower-richness environment of Pegasus I, along with the Arecibo HI profiles and the optical imaging, we have obtained VLA HI images for 10 of the spiral galaxies. Each of the disk galaxies for which we have HI imaging are shown in Figures 8 through 18. For each of the HI contour images, the direction to the cluster center, defined by the central ellipticals, is marked with an arrow. The optical center of the galaxy, as defined by NED, is indicated with a cross. The position-velocity plots and the channel maps for all of these galaxies can be viewed at http://www.physics.unc.edu/llevy/pegasus. The total HI maps were made by generating images of the total emission using the AIPS MOMNT task, being careful to include only channels with line emission. MOMNT smoothes and averages data in the three coordinate and velocity dimensions. It is important to note that the HI fluxes obtained using the VLA data and the fluxes obtained using the Arecibo data agree to within 10%.
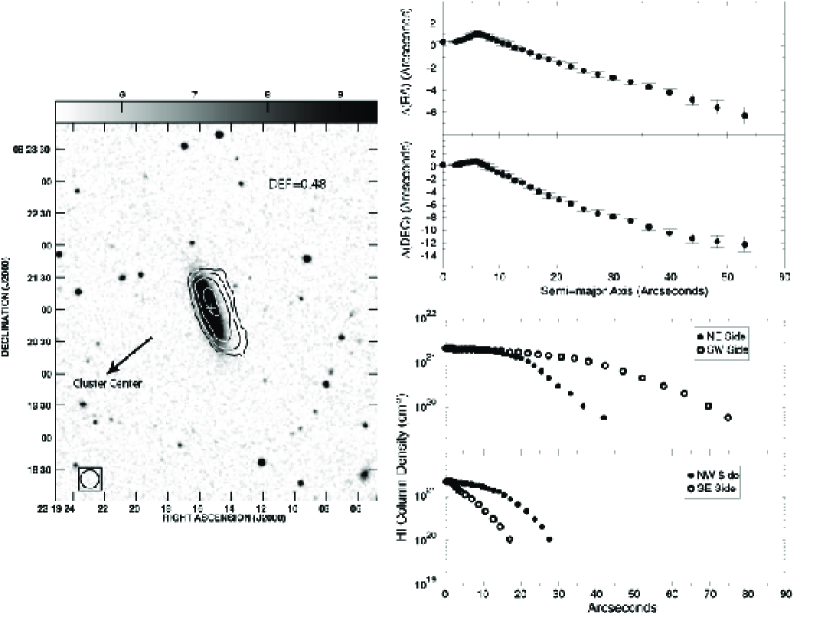
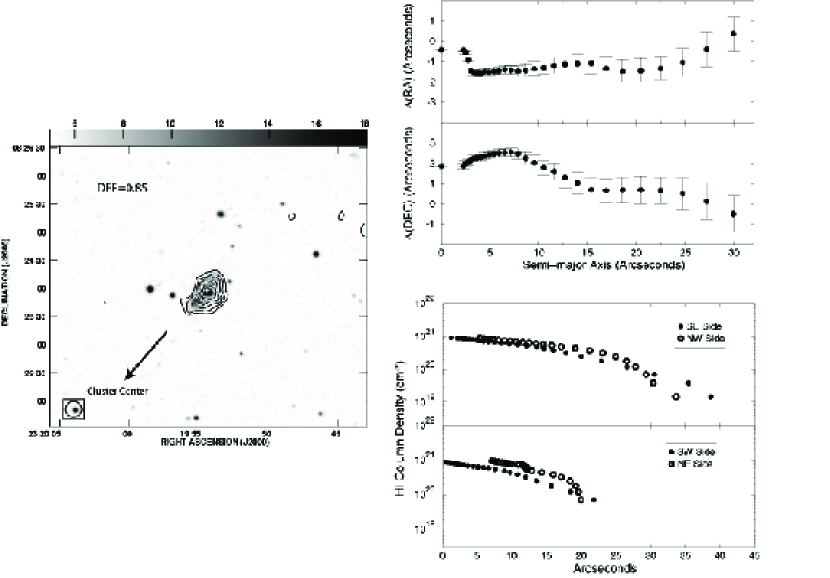
The total HI map for NGC7608, is shown in Figure 8. NGC7608 is an HI deficient galaxy with a deficiency factor of 0.48 (Column 9 of Table 3). The most striking feature of this image is that the HI disk is less extended than the optical disk, an unusual phenomenon found only in cluster galaxies, and also attributed to ram pressure stripping of the HI disk. Also note how the HI disk is asymmetric and displaced (in the SW direction) with respect to its optical counterpart.
To quantify the asymmetry of the HI disk, elliptical contours were fit to the HI surface density (specifically, the column density in atoms/cm2) using the IRAF ELLIPSE routine. The ELLIPSE routine gave us the position centers of the fitted ellipses, in addition to the HI column density, as a function of the radial distance. The top right of Figure 8 shows the shift in the RA and DEC centers (in arcseconds) of the fitted ellipse as a function of distance along the semi-major axis. The ellipse center is seen to shift towards the West and South at larger semi-major axis, in accordance with the visual impression obtained from the HI contours overlaid on the DSS, that the HI is offset from the optical light in the South and West directions. From the fitted ellipses we then reconstruct the radial HI column density profiles along both sides of the major and minor axes. The bottom right of Figure 8 shows the radial profile of the HI distribution along the major and minor axis, which are both clearly asymmetric. Specifically, the radial profile along the major axis has a steeper gradient on the NE side, while along the minor axis the gradient is steeper on the SE side. To obtain a quantitative value for the observed asymmetry, we calculated the skewness of the profiles on both major and minor, with the result that the skewness is 1.1 and 0.6 along the major and minor axes respectively. In short, the systematic shift in the HI position center with column density level, and the associated skewness in the HI, provide a quantitative verification that the HI disk is displaced from the center of the optical disk, and the displacement increases at fainter HI contour levels. It is important to note that displaced HI disks and asymmetric HI distributions are common in “field” galaxies (as in the case of M101 (Allen et al., 1973)), and are thus not necessarily indicative of a ram pressure event. However, as is more fully discussed in §7, such displacements between HI and optical, when coupled with other evidence such as the high DEF values, and the presence of truncated HI disks, are further suggestive of an ISM-ICM interaction.
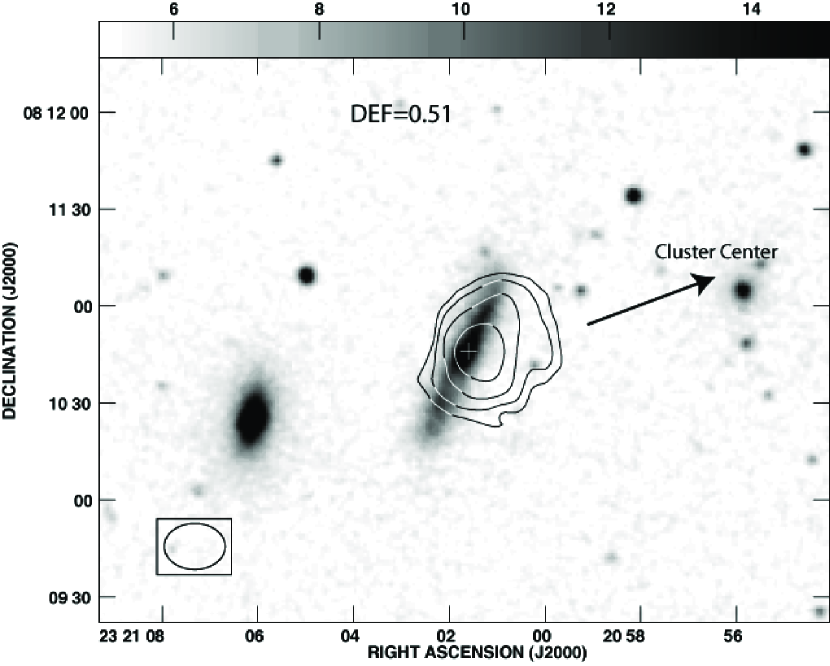
NGC7604 is one of the morphologically peculiar galaxies discussed in Section 6. Defining NGC7604 to be an Sa galaxy, we find it has a DEF of 0.43. The total HI map, overlaid on the DSS optical image, is displayed in Figure 9, while Figure 10 shows the HI contours overlaid on the H image obtained at the MDM telescope (see §6). It is important to note that the higher velocity gas that extends out past 3800 km s-1in the Arecibo profile (Fig. 20) is not seen in the VLA data. Evidently, that gas is too low in HI column density to be detected by the VLA. The fact that the HI is concentrated to the SW side of the galaxy is suggestive of an ISM-ICM interaction. We discuss the case of NGC7604 further in §6, in the context of broadband and H images.
Figure 11 shows the total HI map of UGC12480, a low surface brightness galaxy that has a normal HI abundance, and the HI contours show a well behaved HI gas. UGC12480 was detected in the pointing of NGC7604, resulting in a higher rms noise after correction for the primary beam. The small velocity gradient seen along the major axis of the position-velocity plot (go to http://www.physics.unc.edu/llevy/pegasus) implies that this galaxy is seen close to face-on.
The HI map for Z406-042 is shown in Figure 12. Z406-042 is a deficient galaxy, with a deficiency factor of 0.41 (Column 9 of Table 3). The HI contours (Figure 12) show a well behaved gas.
NGC7615 is a highly HI deficient galaxy, with a deficiency factor of 0.85. The HI contours for NGC7615 (Figure 13) appear to be slightly displaced from the optical disk with more gas appearing on the SE and SW sides. The measure of skewness was calculated for NGC7615, using the same procedure used for NGC7608, resulting in a skewness along the major axis of 0.07, and a skewness along the minor axis of 0.37. This indicates there is little, if any, skewness of the HI disk along the major axis. There is a small asymmetry present along the minor axis, the HI gas is more extended towards the SW. The top right panel of Figure 13 shows the ellipse position center shifts as a function of distance from the galaxy center. The ellipse centers change very slightly, indicating a small displacement of the HI gas towards the West and the South. The bottom right panel of Figure 13 shows the radial profiles along the major and minor axis. Here we see the HI gas is mostly symmetric along the major axis, with only a slightly larger extent towards the SE edge. There is an asymmetry of the HI gas along the minor axis, with more HI gas appearing towards the SW edge.
Though the asymmetry and displacement of the HI gas is small, when coupled with a high deficiency factor and a truncated HI disk, is indicative of a ram pressure event.
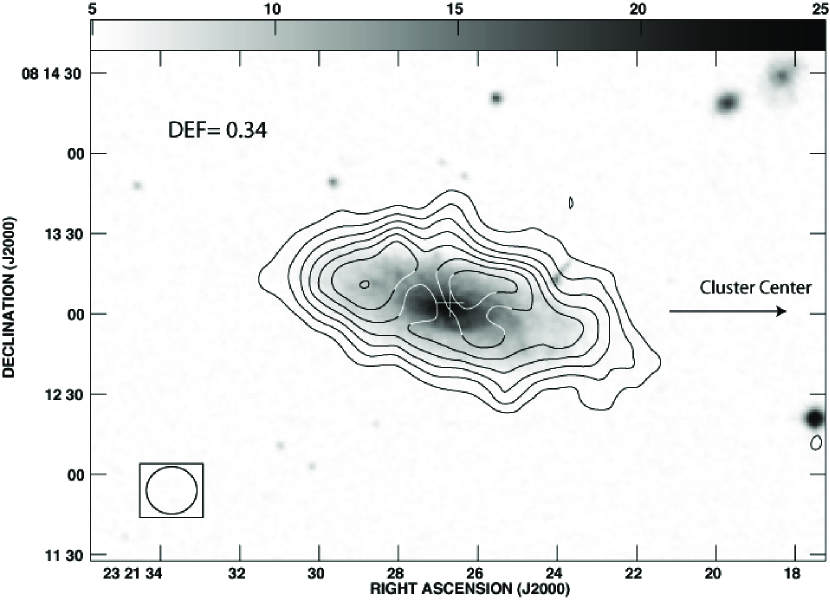
Figure 14 shows the HI contours of UGC12535, an HI normal galaxy with a deficiency factor of 0.22. UGC12535 was detected in the pointing of the central Pegasus cluster, resulting in a higher value for rms noise after correction for primary beam. Unfortunately, the VLA data, which had its velocity range centered for the central Pegasus cluster, does not cover the high velocity range for UGC12535, though the low velocity range is completely covered. The channel map (http://www.physics.unc.edu/llevy/pegasus) shows that the approaching side is in the NW. Figure 14 shows that the HI disk is sharply cut off in the NW to within the optical disk and it is asymmetrically placed with respect to the disk. Since the HI velocity range is completely covered in the NW, this is another example of a galaxy possibly affected by the ICM ram pressure. Note that the cutoff in the SE is due to our incomplete velocity coverage.
The HI contours for the HI normal galaxy KUG2318+078 are shown in Figure 15. KUG2318+078 is also detected in the pointing of the central Pegasus cluster. From the HI contours, there appears to be more HI gas on the NW side. The top right panel of Figure 15 shows ellipse position center shifts as a function of distance from the galaxy center. The shift in ellipse centers indicate a displacement of the HI gas towards the West and North. The bottom right panel of Figure 15 also shows the radial profiles along the major and minor axis. Here we see an asymmetry of the HI gas towards the West along the major axis, with a skewness measure of 0.5, and an asymmetry towards the North, along the minor axis, with a skewness measure of 0.7. This asymmetry towards the NW is moderate, i.e., less pronounced than in the case of NGC7608, but also indicative of an asymmetric HI disk.
The total HI map for the slightly deficient galaxy NGC7631 is shown in Figure 16. The HI gas is distributed fairly symmetrically, with a slight amount of more extended gas on the western edge.
NGC7610 is an HI normal (DEF=-0.15) disk galaxy. The HI contours are shown in Figure 17, and we see symmetrically distributed HI gas.
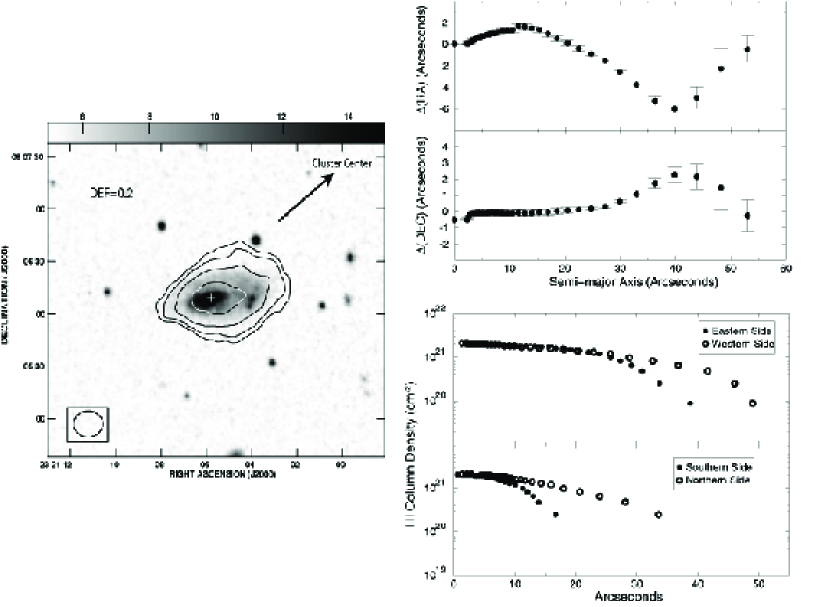
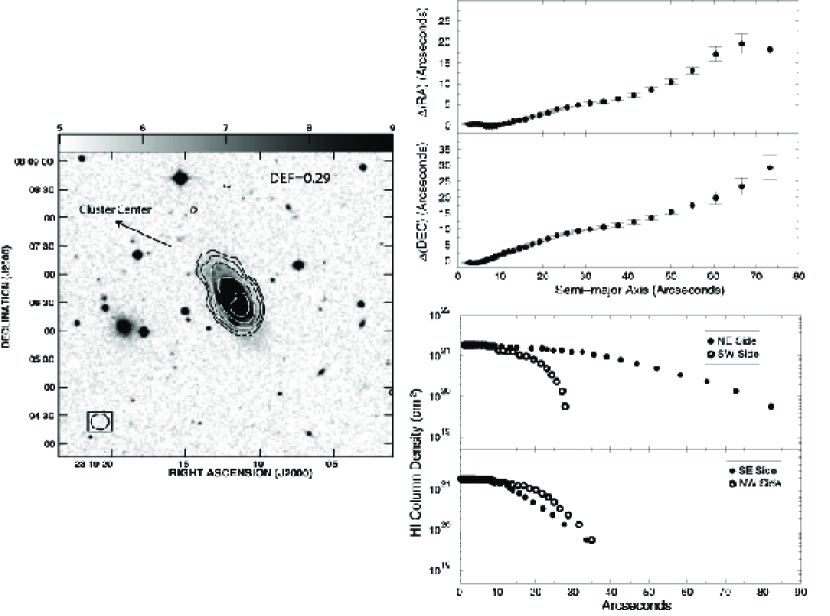
IC5309 is a moderately HI deficient galaxy, with a deficiency factor of 0.29. Figure 18 shows the HI contours overlaid on the DSS image. The HI contours appear to be displaced from the optical counterpart towards the NE, and similarly there appears to be an asymmetry of the HI gas also favoring the NE side. The top right panel of Figure 18 shows the ellipse position center shifts as a function of distance from the galaxy center. The ellipse centers are shifting greatly, indicating a displacement of the HI towards the East and North. The radial profile of the HI distribution along the major and minor axis are also shown in Figure 18. The radial profile along the South-West side has a much steeper gradient than that for the North-East. The skewness was calculated along the major and minor axis and found to be 1.1 and 0.1 respectively. There is a large asymmetry of the HI gas along the major axis, with an extended HI disk towards the North-East.
5.1 Evidence for Truncated HI Disks
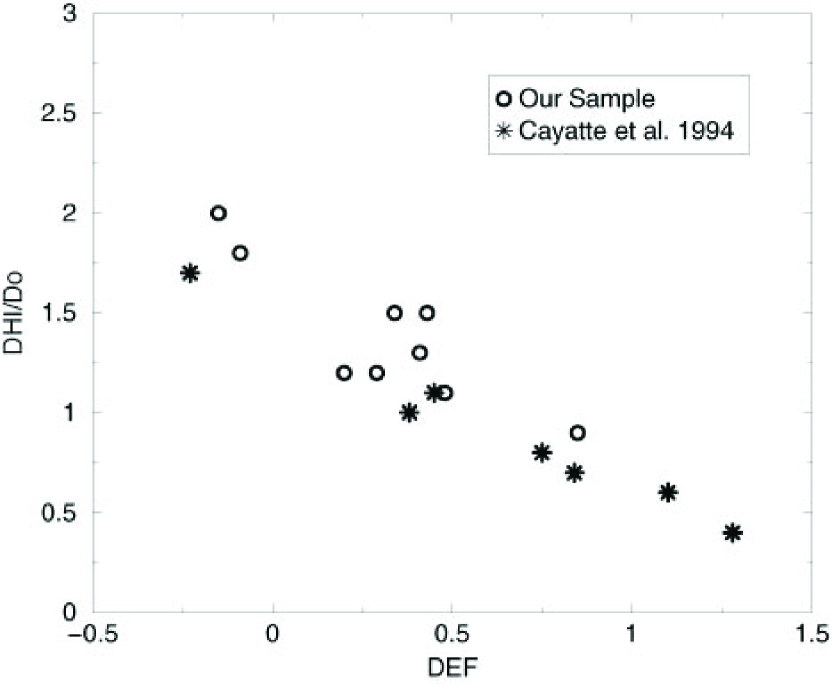
As mentioned earlier, truncated HI disks have been found in HI maps of Virgo and Coma cluster spirals which also have large HI deficiencies. Cayatte et al. (1994) carried out an extensive VLA survey of spatially resolved HI for disk galaxies in Virgo, as well as for a sample of field galaxies, to measure the level of HI disk truncation in the Virgo cluster. Their results show that HI deficient galaxies have truncated HI disks. Having seen above some evidence for displaced (hence perhaps extraplanar), and asymmetric HI disks in a few HI deficient Pegasus I spirals (NGC7608, NGC7615, KUG2318+078, and IC5309) we now turn our attention to whether the disks are also truncated. Measurements of the diameter of the HI disks, DHI, were made for the 9 galaxies for which we have VLA data (assuming NGC7604 is a type Sa galaxy), following the prescription of Cayatte et al. (1994), where the HI diameter is determined to be where the HI column density equals 1020 cm-2. We also obtained optical face-on diameters, Do, corrected for extinction and inclination, from Buta (1996). In Figure 19 we have plotted the ratio DHI/Do, between the HI diameter and the optical face-on diameter, against HI deficiency. The circles represent our Pegasus cluster data, and the asterisks are galaxy data taken from Cayatte et al. (1994). In agreement with the results of Cayatte et al. (1994), we find that HI deficient galaxies tend to have smaller DHI/Do ratios. In addition, not only are the HI deficiencies in Pegasus less severe than in Virgo, but the HI disk truncation is less pronounced as well. Of the 9 Pegasus galaxies, 7 of these are Group I galaxies (as defined by Cayatte et al. (1994)), and two (NGC7615 and Z406-042) are Group II galaxies. In Group I galaxies only the outer parts of the galaxies are depleted, and in Group II galaxies, there is more depletion and a lower central column density. In comparison, Virgo contains many Group III galaxies, which are thought to be undergoing violent stripping and disk truncation. To summarize at this point, not only are HI deficient spiral galaxies found in the core of the Pegasus I cluster, and less frequently in the foreground and background groups, but evidence is found as well for truncated HI disks, and for HI disks that are offset from the optical (stellar) disks. All of these effects have been observed at a higher level in Virgo cluster spirals, and the effects are attributed there to ram pressure stripping of the galaxies’ ISM.
Table 5 summarizes the results for the 9 galaxies discussed in this section (UGC12535 is not included because the high velocity range is completely missing from our data). The galaxy name is given in the first column, followed by the HI deficiency in the second column. Column 3 gives a measure of the displacement between the HI and optical centers, normalized by the optical diameter Do. The displacement is calculated at the point where the HI column density equals 5x1020 cm-2 and is simply the difference between the optical center, as defined by NED, and the center of the fitted HI ellipse at that column density. It is important to note that in the case of IC5309, there is a large displacement between the HI and optical centers at the highest HI column density, but at the level of 5x1020 cm-2, there is only a small offset between the optical value and the HI fitted ellipse center. For the rest of the galaxies, the displacement stays constant between the highest HI column density and the column density at 5x1020 cm-2. Column 4 indicates whether or not there is a shift in the HI center as a function of increasing semi-major axis. NGC7615 has a question mark next to the yes because the shift is only 2 arcsec, and the error is 1 arcsec. The other galaxies that show shifts show significant shifts in their HI centers, much larger than the errors in the measurement. Column 5 indicates whether or not there is an asymmetry in the HI contours. The four galaxies which show an asymmetry are the ones for which the position center shifts of the fitted ellipses, and HI profiles are shown in the previous section. Column 6 gives a measure of HI disk truncation. In order to obtain this value, a least squares fit was made to Figure 19. From the fit, the value of D at DEF=0.0 was found to be 1.7. The HI disk truncation is the difference between the measured value of D and the fiducial value of 1.7. The highly deficient galaxies show a more negative value for this measure of HI disk truncation.
6 NGC7604 and NGC7648
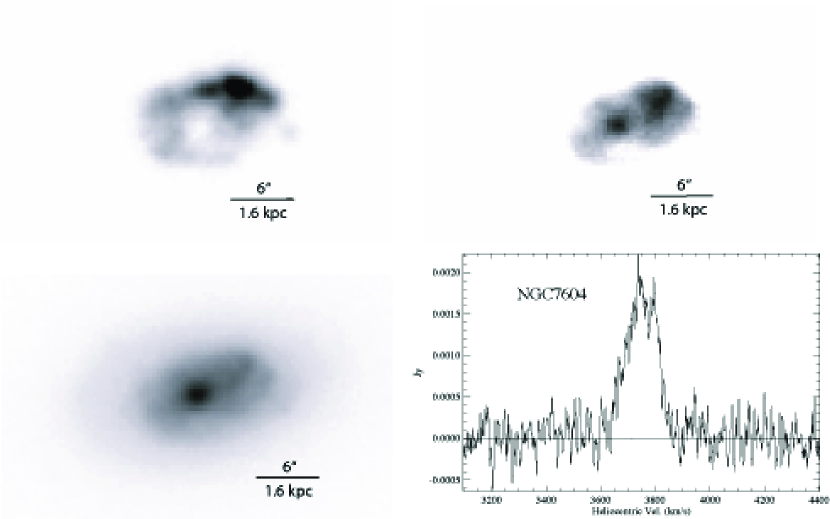
NGC7604 and NGC7648 are two morphologically peculiar galaxies whose characteristics indicate different scenarios for their unusual star formation (see Figures 20 and 21). The seeing in these images is 1-2 arcseconds FWHM. The H image of NGC7604 (top left panel of Figure 20) exhibits an asymmetric arc of star formation concentrated along the NW edge, which coincides with the bright off-nuclear emission region visible in the B-band image displayed in top right panel of Figure 20. In contrast, the I-band image, in the bottom left panel of Figure 20 shows well defined bulge and disk structures for the older stars. The arc of young star formation, concentrated on one edge of the disk, is usually regarded as the signature of a ram pressure event.
Figure 10 shows the HI contours overlaid on the H image. The bright arc of young star formation in the NW corner, coincides with a region of HI emission. This is surprising, since in a ram pressure stripping scenario, one would expect the leading edge of the galaxy to have star formation due to the ram pressure, but little, or no, HI gas in the same area. In other words, the neutral gas gets pushed out by the ram pressure, and we expect the HI gas to lie on the trailing edge, opposed to the H. Figure 10 also shows a truncated H disk, with respect to the HI disk. The HI disk extends to a diameter of approximately 30 arcseconds (7 kpc), while the H diameter is only about 15 arcseconds (3.5 kpc). Truncated H disks are commonly seen in galaxies undergoing ram pressure stripping, as is the case of many Virgo cluster disk galaxies (Koopmann & Kenney, 2004; Crowl et al., 2005; Kenney et al., 2004).
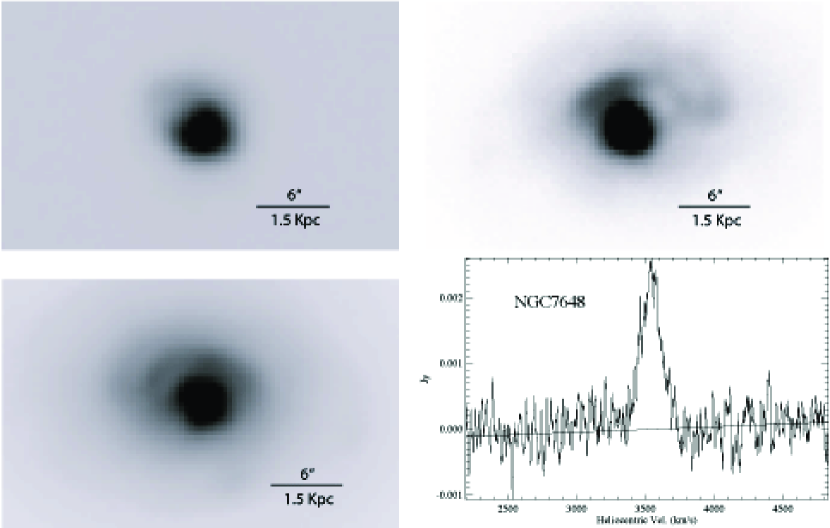
On the other hand, NGC7648 shows centrally concentrated ongoing star formation (top left panel of Figure 21), and asymmetric stellar ripples visible in both the B-band (top right panel of Figure 21) and I-band (bottom left panel of Figure 21) images. Further views of the ripple structures in NGC7648 can be seen in Rose et al. (2001). The Arecibo HI profile shows the single peak structure that indicates centrally concentrated gas. The centrally concentrated HI gas and star formation, in combination with the outer ripple structure indicate a recent tidal interaction. Thus, NGC7604 and NGC7648 indicate that both scenarios of galaxy-galaxy interactions and galaxy-ICM interactions are likely to be operating in the Pegasus I cluster.
7 Discussion
Our principal observational conclusions at this point can be summarized as
follows:
1) Approximately 40% of the spiral galaxies in the core of
the Pegasus I
cluster show mild HI deficiencies of about a factor of 2. In contrast, in the
denser environment of the Virgo cluster, HI deficiencies are typically
a factor of 4, or greater.
2) Outside of the core of Pegasus I, i.e., in the foreground and background groups, little evidence is seen for HI depletion in the spirals.
3) There is evidence as well that the HI deficient galaxies in Pegasus I also have mildly truncated gas disks.
4) Some evidence has been found for gas removal in progress in specific galaxies, in the form of HI disks that are offset from the optical disks, indicating that the gas is being displaced from the stars.
5) In all respects the gas depletion effects are substantially smaller than that seen in Virgo cluster spirals.
The results of our analysis, then, appear to point towards similar gas depletion effects occurring in Pegasus I as are found in Virgo, just smaller in magnitude. However, as was mentioned at the start of §4, simple ram pressure arguments indicate that while ram pressure stripping should be effective in the centers of major clusters such as Virgo and Coma, where the ICM density is high and the galaxy velocity dispersion is also high, in the case of Pegasus I, the basic ram pressure argument fails by nearly 2 orders of magnitude, even in the cluster center. Thus while observationally there appears to be only a gradual decline in the effectiveness of ram pressure stripping with decreasing environmental density, this result is at odds with the Gunn & Gott (1972) ram pressure argument, which predicts complete stripping at any galactic radius for which the ram pressure on the HI exceeds the gravitational restoring force, or none if this condition is not met. Consequently, one must seriously reconsider whether the ram pressure mechanism is really at work in Pegasus I, or whether the Gunn & Gott (1972) stripping criterion is overly simplistic, and we are witnessing a partial stripping of the (multi-phase) HI gas. Before considering this further, we first summarize other observations which indicate stripping effects in surprisingly low density environments.
Davis et al. (1997) obtained optical R band and H images, as well as X-ray data of NGC2276 in the NGC2300 group. Although the NGC2300 group has a low-density ICM, much like Pegasus, and is a low velocity dispersion group environment, NGC2276 appears asymmetric in the H image, in a manner that is reminiscent of a bow shock produced in a ram pressure event. However, the R band image, which tracks the older stellar population, is asymmetric as well, which is not expected in a ram pressure event affecting only the gas. Thus, given as well the fact that the calculated ram pressure is low, Davis et al. (1997) conclude that a tidal disturbance has taken place. A similar conclusion is reached in the case of NGC4273 in the NGC4261 group, i.e., an asymmetric spiral galaxy in a rather low-density environment. Finally, NGC4522 in the Virgo cluster presents another special case (Kenney et al., 2004; Vollmer et al., 2000; Kenney & Koopmann, 1999). While the ram pressure in the center of the Virgo cluster should be high enough to strip the ISM from disk galaxies, NGC4522 is located beyond the radius of strong X-ray emission, and the ram pressure force at this radius is 10 times smaller than the force needed to strip the gas. Nevertheless, optical broadband and H imaging, as well as resolved 21 cm and radio continuum data, all point towards the conclusion that NGC4522 is currently in the act of being stripped of its ISM, given the level of extraplanar gas and radio continuum emission (Kenney et al., 2004).
In short, other studies indicate examples, in addition to the Pegasus I cluster, in which spiral galaxies are being divested of their ISM under circumstances in which the ram pressure fails by an order of magnitude, or more, to provide sufficient pressure to strip the ISM. It is therefore necessary to explain these effects either by considering other mechanisms, such as tidal interactions, or by reformulating our idea of ram pressure stripping. While tidal interactions and/or preprocessing may explain some of the observed phenomena in many of these clusters (Verheijen, 2004; van Gorkom, 2004; Davis et al., 1997), it fails to explain observed characteristics in other clusters. In low density environments, such as Pegasus, where the observed HI deficiencies are moderate at around factors of 2, (as opposed to Virgo and Coma, where HI deficiencies can reach factors of 8 and more) it may be necessary to reconsider ram pressure stripping. In dense environments, ram pressure is capable of affecting the ISM as a whole, stripping away the HI gas and leaving the disk galaxies with severely truncated HI disks. It may be that in low density environments, ram pressure can operate on the lower density component of the galaxy’s ISM, without being able to completely strip and disrupt the entire HI disk.
This work was partially supported by NSF grant AST-0406443 to the University of North Carolina and by an NSF grant AST-0607643 to Columbia University. We would like to thank the referee for the valuable feedback and insight provided.
| Parameter | NGC7604 | NGC7615 | Z406-042 | NGC7608 | NGC7631 | NGC7610 | Pegasus Center | IC5309 |
|---|---|---|---|---|---|---|---|---|
| Phase Center | ||||||||
| RA (2000): (h m s) | 23 17 51.9 | 23 19 54.4 | 23 17 05.5 | 23 19 15.3 | 23 21 26.7 | 23 19 41.4 | 23 20 32.1 | 23 19 11.6 |
| DEC (2000): (d ’ ”) | 07 25 48.0 | 08 23 58.0 | 07 07 22.0 | 08 21 01.0 | 08 13 04.0 | 10 11 06.0 | 08 11 26.4 | 08 06 34.0 |
| Velocity Center: (km/s) | 3782 | 3071 | 3564 | 3508 | 3754 | 3354 | 3650 | 4198 |
| Velocity Range: (km/s) | 600 | 600 | 600 | 600 | 600 | 600 | 1200 | 600 |
| Time on Source: (hrs) | 7 | 7 | 7 | 7 | 7 | 7 | 3 | 7 |
| Bandwidth: (MHz) | 3.125 | 3.125 | 3.125 | 3.125 | 3.125 | 3.125 | 6.25 | 3.125 |
| Number of Channels | 63 | 63 | 63 | 63 | 63 | 63 | 63 | 63 |
| Velocity Resolution: (km/s) | 10.6 | 10.5 | 10.5 | 10.5 | 10.6 | 10.5 | 21.1 | 10.6 |
| Synthesized Beam (FWHM): | ||||||||
| (arcsec) | 17.3x15.8 | 17.6x16.1 | 17.6x16.1 | 17.3x16.2 | 18.4x16.6 | 17.9x16.3 | 18.5x13.6 | 17.3x16.5 |
| (position angle d) | 4 | -5 | 9 | 17.6 | 23 | 8.6 | 40 | 14.3 |
| rms noise: (mJy/beam) | 0.33 | 0.33 | 0.35 | 0.31 | 0.37 | 0.35 | 0.5 | 0.35 |
| rms noise: | 1.4 | 1.3 | 1.4 | 1.2 | 1.4 | 1.4 | 4.5 | 1.4 |
| (1019 cm-2 per velocity channel) | ||||||||
| (1) | (2) | (3) | (4) | (5) | (6) | (7) | (8) | (9) | (10) |
|---|---|---|---|---|---|---|---|---|---|
| Name | UGC Name | RA | DEC | V | T11(a) obtained using the RC3 catalogue, (b) measured by the authors using the Palomar Sky Survey prints. | mo22(a) corrected magnitude obtained using the RC3 catalogue, (b) the uncorrected magnitude is obtained using the UGC, and corrected for galactic extinction, internal extinction, and redshift correction as prescribed in Buta (1996), (c) uncorrected magnitude, obtained from the Zwicky catalog, and corrected for galactic extinction, internal extinction, and redshift correction as prescribed in Buta (1996), (d) uncorrected magnitude, obtained from the Flat Galaxy Catalogue, and corrected for galactic extinction, internal extinction, and redshift correction as prescribed in Buta (1996). | a33(a) obtained using the UGC catalogue, (b) measured by the authors using the Palomar Sky Survey prints. | b/a | Delta V |
| Foreground Cluster | |||||||||
| UGC12361 | 23 06 22.4 | 11 17 08 | 2992 | 10a | 15.60a | 1.0a | 0.400 | 184 | |
| NGC7537 | UGC12442 | 23 14 34.5 | 04 29 55 | 2674 | 4a | 12.72a | 2.1a | 0.238 | 368 |
| NGC7541 | UGC12447 | 23 14 43.9 | 04 32 04 | 2678 | 10a | 11.57a | 3.4a | 0.324 | 487 |
| UGC12522 | 23 20 16.6 | 08 00 20 | 2812 | 9a | 15.19a | 1.7a | 0.941 | 126 | |
| UGC12544 | 23 21 45.1 | 09 04 40 | 2844 | 10a | 14.56a | 1.2a | 0.917 | 84 | |
| UGC12580 | 23 24 33.8 | 08 36 58 | 3009 | 1a | 16.34b | 1.3a | 0.231 | 220 | |
| NGC7615 | 23 19 54.4 | 08 23 57 | 3071 | 3a | 14.48a | 1.0b | 0.500 | 250 | |
| Central Cluster | |||||||||
| UGC12304 | 23 01 08.3 | 05 39 16 | 3470 | 5b | 13.49a | 1.4a | 0.143 | 322 | |
| UGC12382 | 23 07 55.2 | 05 09 40 | 3523 | 6a | 14.74a | 1.2a | 0.083 | 288 | |
| IC1474 | UGC12417 | 23 12 51.2 | 05 48 23 | 3506 | 6a | 14.00a | 1.1a | 0.455 | 284 |
| NGC7518 | UGC12422 | 23 13 12.8 | 06 19 18 | 3536 | 1a | 13.81a | 1.5a | 0.933 | 83 |
| UGC12451 | 23 14 45.5 | 05 24 55 | 3645 | 10a | 14.86a | 1.6a | 0.250 | 200 | |
| NGC7563 | UGC12465 | 23 15 55.9 | 13 11 46 | 4174 | 1a | 13.43a | 2.1a | 0.429 | 300 |
| UGC12467 | 23 16 01.4 | 06 39 08 | 3507 | 8a | 14.40a | 1.5a | 0.267 | 215 | |
| UGC12480 | 23 17 27.3 | 07 37 55 | 3872 | 9a | 17.01b | 1.0a | 1.000 | 115 | |
| NGC7593 | UGC12483 | 23 17 57.0 | 11 20 57 | 4108 | 3b | 13.83a | 1.0a | 0.500 | 270 |
| UGC12494 | 23 18 52.6 | 06 52 38 | 4196 | 7a | 14.39a | 1.5a | 0.333 | 233 | |
| UGC12497 | 23 19 10.8 | 07 42 13 | 3761 | 10a | 14.90a | 1.1a | 0.273 | 188 | |
| IC5309 | UGC12498 | 23 19 11.7 | 08 06 34 | 4198 | 3a | 13.87a | 1.5a | 0.400 | 300 |
| NGC7608 | UGC12500 | 23 19 15.3 | 08 21 01 | 3508 | 3b | 13.92a | 1.5a | 0.267 | 310 |
| NGC7610 | UGC12511 | 23 19 41.3 | 10 11 06 | 3554 | 6a | 13.25a | 2.7a | 0.815 | 286 |
| UGC12535 | 23 21 01.6 | 08 10 46 | 4214 | 4a | 16.61b | 1.1a | 0.182 | 215 | |
| NGC7631 | UGC12539 | 23 21 26.7 | 08 13 03 | 3754 | 3a | 13.12a | 1.8a | 0.444 | 385 |
| UGC12553 | 23 22 13.7 | 09 23 03 | 3573 | 9a | 17.00a | 1.4a | 0.786 | 102 | |
| UGC12561 | 23 22 58.5 | 08 59 37 | 3743 | 8a | 14.93a | 1.7a | 0.235 | 217 | |
| UGC12562 | 23 22 47.3 | 11 46 22 | 3836 | 8a | 16.61b | 1.3a | 0.231 | 181 | |
| NGC7643 | UGC12563 | 23 22 50.4 | 11 59 20 | 3878 | 5b | 13.61a | 1.4a | 0.571 | 349 |
| UGC12571 | 23 23 22.5 | 13 19 09 | 3913 | 3b | 14.32a | 2.0a | 0.550 | 303 | |
| UGC12585 | 23 24 39.6 | 08 25 32 | 3675 | 8a | 14.39a | 1.6a | 0.938 | 115 | |
| Z406-042 | 23 17 05.5 | 07 07 22 | 3564 | 5b | 15.02a | 0.9a | 0.667 | 223 | |
| Z406-054 | 23 18 16.2 | 06 49 32 | 3428 | 1a | 15.80c | 1.0b | 0.200 | 206 | |
| KUG2318+078 | 23 21 05.8 | 08 06 09 | 3886 | 4b | 14.49a | 1.1b | 0.455 | 182 | |
| Z406-086 | 23 21 40.9 | 08 59 24 | 3606 | 10b | 14.41a | 1.3b | 0.462 | 208 | |
| OBC97p05-6 | 23 21 47.0 | 09 02 26 | 3667 | 4a | 16.97a | 0.8b | 0.875 | 129 | |
| FGC284A | 23 22 58.5 | 07 40 20 | 3471 | 5b | 17.70d | 1.1b | 0.182 | 162 | |
| NGC7604 | 23 17 51.8 | 07 25 49 | 3782 | pecb | 15.27a | 0.3b | 0.667 | 175 | |
| NGC7648 | UGC12575 | 23 23 54.1 | 09 40 04 | 3559 | pecb | 13.42a | 1.6a | 0.625 | 277 |
| Background Cluster | |||||||||
| NGC7469 | UGC12332 | 23 03 15.6 | 08 52 26 | 4892 | 1a | 12.64a | 1.6a | 0.688 | 238 |
| UGC12370 | 23 07 06.4 | 09 57 38 | 4892 | 6a | 14.13a | 1.5a | 0.200 | 281 | |
| NGC7495 | UGC12391 | 23 08 57.2 | 12 02 53 | 4887 | 5a | 13.56a | 2.0a | 0.900 | 224 |
| NGC7511 | UGC12412 | 23 12 26.3 | 13 43 36 | 4928 | 2b | 14.16a | 1.1a | 0.455 | 301 |
| NGC7515 | UGC12418 | 23 12 48.7 | 12 40 45 | 4475 | 5b | 13.05a | 1.7a | 0.824 | 334 |
| UGC12423 | 23 13 13.1 | 06 25 48 | 4839 | 5a | 12.74a | 3.6a | 0.111 | 515 | |
| UGC12426 | 23 13 32.7 | 06 34 05 | 4720 | 6a | 14.54a | 1.3a | 0.154 | 268 | |
| NGC7529 | UGC12431 | 23 14 03.2 | 08 59 33 | 4538 | 7b | 14.36a | 1.1a | 0.909 | 191 |
| NGC7535 | UGC12438 | 23 14 12.8 | 13 34 55 | 4604 | 7a | 14.18a | 1.7a | 1.000 | 138 |
| NGC7536 | UGC12437 | 23 14 13.2 | 13 25 34 | 4697 | 4a | 13.32a | 2.2a | 0.364 | 354 |
| NGC7570 | UGC12473 | 23 16 44.7 | 13 28 59 | 4698 | 1a | 13.50a | 1.6a | 0.500 | 204 |
| NGC7580 | UGC12481 | 23 17 36.4 | 14 00 04 | 4432 | 4b | 14.07a | 0.8a | 0.750 | 275 |
| NGC7591 | UGC12486 | 23 18 16.2 | 06 35 09 | 4956 | 4a | 13.01a | 1.9a | 0.421 | 435 |
| UGC12547 | 23 21 51.6 | 05 00 23 | 5113 | 5b | 14.16a | 1.2a | 0.500 | 248 | |
| UGC12555 | 23 22 34.0 | 05 07 13 | 4915 | 6a | 16.61b | 1.1a | 0.273 | 256 | |
| IC5283 | 23 03 18.0 | 08 53 37 | 4804 | 10a | 14.34a | 0.8b | 0.500 | 385 | |
| IC5292 | 23 13 47.2 | 13 41 14 | 4612 | 3b | 15.20c | 0.5b | 1.000 | 214 | |
| Non-Pegasus Spirals | |||||||||
| KUG2358+128A | 00 01 13.4 | 13 08 39 | 5461 | 5b | 15.2a | 1.0b | 0.500 | 400 | |
| UGC00011 | 00 03 21.5 | 22 06 11 | 4447 | 2b | 15.0a | 1.1a | 0.727 | 200 | |
| NGC7816 | UGC00016 | 00 03 48.8 | 07 28 43 | 5240 | 4a | 13.3a | 2.0a | 1.000 | 300 |
| NGC7817 | UGC00019 | 00 03 58.9 | 20 45 08 | 2309 | 4a | 11.6a | 4.0a | 0.275 | 450 |
| UGC00024 | 00 04 14.7 | 22 35 19 | 4442 | 6a | 14.6a | 1.2a | 0.667 | 200 | |
| UGC00076 | 00 08 49.2 | 24 32 25 | 4581 | 5b | 15.2b | 1.1a | 0.273 | 250 | |
| UGC00079 | 00 09 04.4 | 25 37 07 | 4345 | 6b | 14.8a | 1.7b | 0.765 | 230 | |
| NGC0041 | 00 12 48.0 | 22 01 24 | 5949 | 3a | 14.1a | 1.0a | 0.500 | 300 | |
| NGC0052 | UGC00140 | 00 14 40.1 | 18 34 55 | 5392 | 3b | 13.1a | 2.6a | 0.192 | 550 |
| UGC00144 | 00 15 26.8 | 16 14 07 | 5620 | 4b | 14.3b | 1.0a | 0.300 | 400 | |
| UGC00164 | 00 17 23.7 | 18 05 03 | 5443 | 4a | 14.1a | 1.8a | 0.389 | 300 | |
| UGC00168 | 00 18 10.6 | 18 17 32 | 5521 | 1a | 15.3b | 1.2a | 0.250 | 500 | |
| UGC00179 | 00 19 00.6 | 23 28 36 | 4485 | 6a | 14.5a | 1.3a | 0.538 | 300 | |
| IC1544 | UGC00204 | 00 21 17.5 | 23 05 27 | 5714 | 5a | 14.1a | 1.4a | 0.643 | 200 |
| IC1546 | 00 21 29.0 | 22 30 21 | 5820 | 5b | 14.5a | 1.0b | 0.500 | 230 | |
| UGC00228 | 00 23 56.7 | 24 18 20 | 5683 | 4a | 14.3a | 1.3a | 0.692 | 250 | |
| IC1552 | UGC00297 | 00 29 43.7 | 21 28 37 | 5600 | 5b | 14.3a | 1.0a | 0.200 | 350 |
| (1) | (2) | (3) | (4) | (5) | (6) | (7) | (8) | (9) |
|---|---|---|---|---|---|---|---|---|
| Name11Asterisk implies the Arecibo observations were taken on the second observing run in October 2004 (see section 2.4). | UGC Name | T | texp | Flux | log | log | log | DEF |
| (Jy km/s) | (MHI) | (LB) | (D) | |||||
| Foreground Cluster | ||||||||
| UGC12361 | 10 | 10 | 2.90.1 | 9.05 | 9.11 | 2.13 | 0.01 | |
| NGC7537 | UGC12442 | 4 | 5 | 18.30.2 | 9.84 | 9.67 | 2.78 | -0.31 |
| NGC7541 | UGC12447 | 10 | 5 | 29.10.5 | 10.00 | 10.33 | 3.19 | -0.10 |
| UGC12522 | 9 | 5 | 4.70.1 | 9.25 | 9.28 | 2.59 | 0.19 | |
| UGC12544 | 10 | 5 | 4.70.2 | 9.25 | 9.34 | 2.29 | -0.06 | |
| ∗ | UGC12580 | 1 | 10 | 0.30.1 | 8.04 | 8.82 | 2.36 | 1.11 |
| NGC7615 | 3 | 5 | 0.50.1 | 8.31 | 9.28 | 2.13 | 0.85 | |
| Central Cluster | ||||||||
| UGC12304 | 5 | 10 | 2.10.1 | 8.89 | 9.10 | 2.42 | 0.38 | |
| UGC12382 | 6 | 5 | 4.90.2 | 9.27 | 9.01 | 2.29 | -0.08 | |
| IC1474 | UGC12417 | 6 | 5 | 4.00.1 | 9.18 | 9.37 | 2.21 | -0.05 |
| NGC7518 | UGC12422 | 1 | 5 | 2.40.5 | 8.96 | 9.62 | 2.48 | 0.27 |
| UGC12451 | 10 | 5 | 3.80.1 | 9.16 | 9.28 | 2.54 | 0.24 | |
| NGC7563 | UGC12465 | 1 | 10 | 0.10.1 | 7.58 | 9.58 | 2.78 | 1.82 |
| UGC12467 | 8 | 5 | 2.90.1 | 9.04 | 9.59 | 2.48 | 0.32 | |
| ∗ | UGC12480 | 9 | 5 | 3.70.1 | 9.15 | 8.55 | 2.13 | -0.09 |
| NGC7593 | UGC12483 | 3 | 5 | 3.20.2 | 9.09 | 9.53 | 2.13 | 0.07 |
| UGC12494 | 7 | 5 | 5.10.1 | 9.29 | 9.27 | 2.48 | 0.06 | |
| UGC12497 | 10 | 5 | 3.90.1 | 9.17 | 9.28 | 2.21 | -0.04 | |
| IC5309 | UGC12498 | 3 | 5 | 3.20.1 | 9.09 | 9.34 | 2.48 | 0.29 |
| NGC7608 | UGC12500 | 3 | 5 | 2.10.1 | 8.89 | 9.19 | 2.48 | 0.48 |
| NGC7610 | UGC12511 | 6 | 5 | 22.10.1 | 9.92 | 9.60 | 2.99 | -0.15 |
| UGC12535 | 4 | 10 | 1.30.1 | 8.68 | 8.71 | 2.21 | 0.51 | |
| NGC7631 | UGC12539 | 3 | 5 | 3.60.1 | 9.13 | 9.78 | 2.64 | 0.34 |
| UGC12553 | 9 | 5 | 3.60.1 | 9.14 | 8.55 | 2.42 | 0.16 | |
| UGC12561 | 8 | 5 | 4.70.2 | 9.25 | 9.38 | 2.59 | 0.19 | |
| UGC12562 | 8 | 5 | 3.20.1 | 9.09 | 8.71 | 2.36 | 0.16 | |
| NGC7643 | UGC12563 | 5 | 10 | 1.10.2 | 8.61 | 9.51 | 2.42 | 0.65 |
| UGC12571 | 3 | 5 | 7.90.1 | 9.48 | 9.31 | 2.73 | 0.05 | |
| UGC12585 | 8 | 5 | 7.60.2 | 9.46 | 9.33 | 2.54 | -0.06 | |
| Z406-042∗ | 5 | 5 | 0.90.1 | 8.52 | 9.17 | 2.04 | 0.41 | |
| Z406-054∗ | 1 | 10 | 0.40.1 | 8.18 | 9.03 | 2.13 | 0.84 | |
| KUG2318+078∗ | 4 | 5 | 2.60.1 | 9.00 | 9.16 | 2.21 | 0.20 | |
| Z406-086∗ | 10 | 5 | 2.00.1 | 8.88 | 9.34 | 2.36 | 0.37 | |
| OBC97p05-6∗ | 4 | 5 | 2.70.1 | 9.00 | 8.56 | 1.94 | 0.02 | |
| FGC284A∗ | 5 | 5 | 1.30.1 | 8.70 | 8.27 | 2.21 | 0.38 | |
| NGC7604 | pec | 60 | 0.20.1 | 7.97 | 9.36 | 1.09 | ||
| NGC7648 | UGC12575 | pec | 40 | 0.40.1 | 8.21 | 10.01 | 2.54 | |
| Background Cluster | ||||||||
| NGC7469 | UGC12332 | 1 | 5 | 1.20.4 | 8.65 | 10.12 | 2.54 | 0.62 |
| UGC12370 | 6 | 5 | 6.60.2 | 9.39 | 9.11 | 2.48 | -0.04 | |
| NGC7495 | UGC12391 | 5 | 5 | 12.30.1 | 9.67 | 9.62 | 2.73 | -0.13 |
| NGC7511 | UGC12412 | 2 | 5 | 2.30.2 | 8.93 | 9.33 | 2.21 | 0.14 |
| NGC7515 | UGC12418 | 5 | 5 | 5.10.1 | 9.29 | 9.82 | 2.59 | 0.13 |
| UGC12423 | 5 | 5 | 16.70.1 | 9.80 | 9.41 | 3.24 | 0.18 | |
| UGC12426 | 6 | 5 | 3.70.1 | 9.14 | 9.54 | 2.36 | 0.11 | |
| NGC7529 | UGC12431 | 7 | 5 | 4.30.1 | 9.21 | 9.62 | 2.21 | -0.08 |
| NGC7535 | UGC12438 | 7 | 5 | 4.80.1 | 9.26 | 9.32 | 2.59 | 0.18 |
| NGC7536 | UGC12437 | 4 | 5 | 11.20.1 | 9.63 | 9.44 | 2.82 | -0.07 |
| NGC7570 | UGC12473 | 1 | 5 | 7.50.1 | 9.45 | 9.65 | 2.54 | -0.19 |
| NGC7580 | UGC12481 | 4 | 5 | 5.40.1 | 9.31 | 9.51 | 1.94 | -0.29 |
| NGC7591 | UGC12486 | 4 | 5 | 14.10.2 | 9.73 | 9.77 | 2.69 | -0.25 |
| UGC12547 | 5 | 5 | 3.50.1 | 9.12 | 9.30 | 2.29 | 0.03 | |
| UGC12555 | 6 | 5 | 3.80.1 | 9.15 | 8.71 | 2.21 | -0.03 | |
| IC5283 | 10 | 5 | 1.90.6 | 8.85 | 9.40 | 1.94 | 0.05 | |
| IC5292 | 3 | 5 | 1.80.1 | 8.83 | 9.27 | 1.53 | -0.05 | |
| Non-Pegasus Spirals | ||||||||
| KUG2358+128A | 5 | 5 | 1.60.2 | 8.78 | 9.27 | 2.39 | 0.46 | |
| UGC00011 | 2 | 5 | 1.80.2 | 8.83 | 9.35 | 2.29 | 0.29 | |
| NGC7816 | UGC00016 | 4 | 5 | 8.60.1 | 9.51 | 10.03 | 2.96 | 0.13 |
| NGC7817 | UGC00019 | 4 | 5 | 11.80.1 | 9.65 | 10.71 | 2.85 | -0.07 |
| UGC00024 | 6 | 5 | 4.30.2 | 9.21 | 9.51 | 2.37 | 0.05 | |
| UGC00076 | 5 | 5 | 3.30.2 | 9.09 | 9.27 | 2.32 | 0.09 | |
| UGC00079 | 6 | 5 | 5.10.1 | 9.28 | 9.43 | 2.66 | 0.21 | |
| NGC0041 | 3 | 5 | 1.70.2 | 8.80 | 9.71 | 2.47 | 0.56 | |
| NGC0052 | UGC00140 | 3 | 5 | 3.90.2 | 9.16 | 10.11 | 3.21 | 0.66 |
| UGC00144 | 4 | 15 | 0.60.5 | 8.36 | 9.63 | 2.42 | 0.96 | |
| UGC00164 | 4 | 5 | 1.10.2 | 8.62 | 9.71 | 2.90 | 0.99 | |
| UGC00168 | 1 | 5 | 1.70.2 | 8.80 | 9.23 | 2.57 | 0.48 | |
| UGC00179 | 6 | 5 | 5.30.1 | 9.30 | 9.55 | 2.44 | 0.02 | |
| IC1544 | UGC00204 | 5 | 5 | 4.30.2 | 9.22 | 9.71 | 2.73 | 0.32 |
| IC1546 | 5 | 15 | 2.20.5 | 8.91 | 9.55 | 2.45 | 0.38 | |
| UGC00228 | 4 | 5 | 12.80.1 | 9.68 | 9.63 | 2.65 | -0.23 | |
| IC1552 | UGC00297 | 5 | 5 | 2.50.2 | 8.97 | 9.63 | 2.42 | 0.30 |
| Cluster | (E+S0):11(a)Giovanelli & Haynes (1985), (b)Zabludoff et al. (1990), (c)Jones & Forman (1978), (d)Bahcall & Sarazin (1977), (e)Omar & Dwarakanath (2005), (f)Solanes et al. (2001), (g) measured by authors using the central group RA, DEC, and velocity constraints, (h)Richter & Huchtmeier (1982), (i)Canizares et al. (1986). | v11(a)Giovanelli & Haynes (1985), (b)Zabludoff et al. (1990), (c)Jones & Forman (1978), (d)Bahcall & Sarazin (1977), (e)Omar & Dwarakanath (2005), (f)Solanes et al. (2001), (g) measured by authors using the central group RA, DEC, and velocity constraints, (h)Richter & Huchtmeier (1982), (i)Canizares et al. (1986). | X-ray Luminosity11(a)Giovanelli & Haynes (1985), (b)Zabludoff et al. (1990), (c)Jones & Forman (1978), (d)Bahcall & Sarazin (1977), (e)Omar & Dwarakanath (2005), (f)Solanes et al. (2001), (g) measured by authors using the central group RA, DEC, and velocity constraints, (h)Richter & Huchtmeier (1982), (i)Canizares et al. (1986). | electron density11(a)Giovanelli & Haynes (1985), (b)Zabludoff et al. (1990), (c)Jones & Forman (1978), (d)Bahcall & Sarazin (1977), (e)Omar & Dwarakanath (2005), (f)Solanes et al. (2001), (g) measured by authors using the central group RA, DEC, and velocity constraints, (h)Richter & Huchtmeier (1982), (i)Canizares et al. (1986). | v2 |
|---|---|---|---|---|---|
| Name | (S+IRR) | (km/s) | (erg/s) | (cm-3) | (km/s)2 cm-3 |
| Coma | 86:14(a) | 1010(b) | (0.5-3 Kev) 25.7x1043(c) | 2.5x10⁻³(d) | 2550 |
| Virgo | 37:63(e) | 632(f) | (0.5-3 Kev) 4.4x1043(c) | 6.4x10⁻³(d) | 2556 |
| Pegasus | 18:82(g) | 240(h) | (0.2-4 Kev) 1.3x1042(i) | 2x10⁻⁴(i) | 12 |
| Eridanus | 46:54(e) | 240(e) | (0.1-2 Kev) 2.5x1041(e) | 2x10⁻⁴(e) | 12 |
| Ursa Major | 15:85(e) | 150(e) | (e) | (e) |
| (1) | (2) | (3) | (4) | (5) | (6) |
|---|---|---|---|---|---|
| Name | DEF | Displacement between | Shift in HI center | Asymmetry in HI | HI disk |
| HI and optical/Do | (yes or no) | (yes or no) | truncation | ||
| NGC7610 | -0.15 | 0.03 | no | no | 0.3 |
| UGC12480 | -0.09 | 0.05 | no | no | 0.1 |
| KUG2318+078 | 0.20 | 0.09 | yes | yes | -0.5 |
| IC5309 | 0.29 | 0.02 | yes | yes | -0.5 |
| NGC7631 | 0.34 | 0.05 | no | no | -0.2 |
| Z406-042 | 0.41 | 0.09 | no | no | -0.4 |
| NGC7604 | 0.43 | 0.29 | no | no | -0.2 |
| NGC7608 | 0.48 | 0.09 | yes | yes | -0.6 |
| NGC7615 | 0.85 | 0.08 | yes? | yes | -0.8 |
References
- Allen et al. (1973) Allen, R. J., Goss, W. M., & van Woerden, H. 1973, A&A, 29, 447
- Bahcall & Sarazin (1977) Bahcall, J. N., & Sarazin, C. L. 1977, ApJ, 213, L99
- Bekki (1999) Bekki, K. 1999, ApJ, 510, L15
- Bravo-Alfaro et al. (2001) Bravo-Alfaro, H., Cayatte, V., van Gorkom, J. H., & Balkowski, C. 2001, A&A, 379, 347
- Buta (1996) Buta, R. 1996, AJ, 111, 591
- Butcher & Oemler (1978) Butcher, H., & Oemler, A., Jr. 1978, ApJ, 219, 18
- Butcher & Oemler (1984) Butcher, H., & Oemler, A., Jr. 1984, ApJ, 285, 426
- Caldwell et al. (1993) Caldwell, N., Rose, J. A., Sharples, R. M., Ellis, R. S., & Bower, R. G. 1993, AJ, 106, 473
- Caldwell & Rose (1997) Caldwell, N., & Rose, J. A. 1997, AJ, 113, 492
- Canizares et al. (1986) Canizares, C. R., Donahue, M. E., Trinchieri, G., Stewart, G. C., & McGlynn, T. A. 1986, ApJ, 304, 312
- Cayatte et al. (1990) Cayatte, V., van Gorkom, J. H., Balkowski, C., & Kotanyi, C. 1990, AJ, 100, 604
- Cayatte et al. (1994) Cayatte, V., Kotanyi, C., Balkowski, C., & van Gorkom, J. H. 1994, AJ, 107, 1003
- Chincarini & Rood (1976) Chincarini, G., & Rood, H. J. 1976, PASP, 88, 388
- Crowl et al. (2005) Crowl, H. H., Kenney, J. D. P., van Gorkom, J. H., Vollmer, B. 2005, AJ, 130, 65
- RC3 (1991) de Vaucouleurs, G., de Vaucouleurs, A., Corwin, H., Buta, R., Paturel, G., & Fouqué, P., 1991, Third Reference Catalogue of Bright Galaxies (Springer, New York)(RC3)
- Davis et al. (1997) Davis, D. S., Keel, W. C., Mulchaey, J. S., & Henning, P. A. 1997, AJ, 114, 2
- Dressler & Gunn (1983) Dressler, A., & Gunn, J. E. 1983, ApJ, 270, 7
- Dressler et al. (1999) Dressler, A., Smail, I., Poggianti, B. M., Butcher, H., Couch, W. J., Ellis, R. S., Oemler, A. Jr. 1999, ApJ, 122, 51
- Gavazzi (1987) Gavazzi, G. 1987, ApJ, 320, 96
- Gavazzi et al. (1995) Gavazzi, G., Contursi, A., Carrasco, L., Boselli, A., Kennicutt, R., Scodeggio, M., Jaffe, W. 1995, A&A, 304, 325
- Giovanelli et al. (1997a) Giovanelli, R., Haynes, M. P., Herter, T., Vogt, N. P., da Costa, L. N., Freudling, W., Salzer, J. J., & Wegner, G. 1997a, AJ, 113, 22
- Giovanelli & Haynes (1985) Giovanelli, R., & Haynes, M. P. 1985, ApJ, 292, 404
- Gunn & Gott (1972) Gunn, J. E., & Gott, J. R. 1972, ApJ, 176, 1
- Han & Mould (1992) Han, M., & Mould, J. R. 1992, ApJ, 396, 453
- Haynes & Giovanelli (1984) Haynes, M. P., & Giovanelli, R. 1984, AJ, 89, 758 (HG84)
- Haynes & Giovanelli (1986) Haynes, M. P., & Giovanelli, R. 1986, ApJ, 306, L55
- Jones & Forman (1978) Jones, C., & Forman, W. 1978, ApJ, 224, 1
- Kenney & Koopmann (1999) Kenney, J. D. P., & Koopmann, R. A. 1999, AJ, 117, 181
- Kenney et al. (2004) Kenney, J. D. P., van Gorkom, J. H., Vollmer, B. 2004, AJ, 127, 3361
- Koopmann & Kenney (2004) Koopmann, R. A., & Kenney, J. D. P. 2004, ApJ, 613, 866
- Larson et al. (1980) Larson, R. B., Tinsley, B. M., & Caldwell, C. N. 1980, ApJ, 237, 692
- Moore et al. (1996) Moore, B., Katz, N., Lake, G., Dressler, A., & Oemler, A. 1996, Nature, 379, 613
- Mulchaey et al. (1993) Mulchaey, J. S., Davis, D. S., Mushotzky, R. F., Burstein, D. 1993, ApJ, 404L, 9
- Nulsen (1982) Nulsen. P. E. J. 1982, MNRAS, 198, 1007
- Omar & Dwarakanath (2005) Omar, A., & Dwarakanath, K. S. 2005, A&A, 26, 1
- Oosterloo & van Gorkom (2005) Oosterloo, T., & van Gorkom, J. H. 2005, A&A, 437, 190
- Richter & Huchtmeier (1982) Richter, O. G., & Huchtmeier, W. K. 1982, A&A, 109, 155
- Rose et al. (2001) Rose, J. A., Gaba, A. E., Caldwell, N., & Chaboyer, B. 2001, AJ, 121, 793
- Sanchis et al. (2004) Sanchis T., Mamon, G. A., Salvador-Solé, E., Solanes, J. M. 2004, A&A, 418,393
- Schommer et al. (1981) Schommer, R. A., Sullivan, W. T., & Bothun, G. D. 1981, AJ, 86, 943
- Schulz & Struck (2002) Schulz, S. & Struck, C., 2002, MNRAS, 328, 185
- Solanes, Giovanelli, & Haynes (1996) Solanes, J. M., Giovanelli, R., & Haynes, M. P. 1996, ApJ, 461, 609 (SGH96)
- Solanes et al. (2001) Solanes, J. M., Manrique, A., Garcia-Gomez, C., Gonzales-Casado,G., Giovanelli, R., & Haynes, M. P. 2001, ApJ, 548, 97
- Solanes et al. (2002) Solanes, J. M., Sanchis, T., Salvador-Solé, E., Fouqué, P., Manrique, A. 2002, ApJ, 580, 164S
- Stebbins & Kron (1957) Stebbins, J., & Kron, G. E. 1957, ApJ, 126, 266
- Sullivan et al. (1981) Sullivan, W. T. III, Bothun G. D., Bates, B., & Schommer, R. A. 1981, AJ, 86, 919 (SBBS81)
- van Gorkom (2004) van Gorkom, J. H. 2004, in Carnegie OBservatory Astrophysics Series, Vol 3: Clusters of Galaxies, Probes of Cosmology and Galaxy Evolution, ed. J.S. Mulchaey, A. Dressler, and A. Oemler (Cambridge: Cambridge University Press), p306
- Verheijen & Sancisi (2001) Verheijen, M. A. W., & Sancisi, R. 2001, A&A, 370, 765
- Verheijen (2004) Verheijen, M. A. W. 2004, in Outskirts of Galaxy Clusters: intense Life in the Suburbs, ed. A. Diaferio (IAU Colloquium #195), p394
- Vollmer et al. (2000) Vollmer, B., Marcelin, M., Amram, P., Balkowski, C., Cayatte, V., & Garrido, O. 2000, A&A, 364, 532
- Warmels (1988) Warmels, R. H. 1988, A&A, 72, 427
- Zabludoff et al. (1990) Zabludoff, A. I., Huchra, J. P., & Geller, M. J. 1990, ApJS, 74, 1
- Zwicky, Karpowicz, & Kowal (1965) Zwicky, F., Karpowicz, M., & Kowal, C. T. 1965, Catalogue of Galaxies and of Clusters of Galaxies, Vol. 5 (Pasadena: California Institute of Technology).