The weak absorbing outflow in AGN Mrk 279: evidence of super-solar metal abundances.
Abstract
We present analysis and photoionization modeling of the Chandra high resolution spectrum of Mrk 279. There is clear evidence of an absorbing outflow which is best fit by a two component model, one with a low ionization parameter and one with a higher ionization parameter. The column density of the X-ray warm absorber, about , is the smallest known of all AGNs in which X-ray absorbing outflows are observed. We find that the X-ray and UV/FUV absorbers are part of the same overall outflow. There is some evidence of super-solar carbon, nitrogen, oxygen and iron in the Chandra spectrum of Mrk 279. While this is not a robust result in itself, Chandra data in combination with the UV data and the pressure equilibrium between two phases of the outflow, support the scenario of super-solar abundances. This the first case where super-solar abundances are reported in the nucleus of a normal Seyfert galaxy. The data suggest that the outflow originates from a compact region around the nuclear black hole and that it carries insignificant amount of mass and energy.
1 Introduction
Feedback from quasars has been a key word in recent years as a way of solving many astrophysical problems ranging from cluster cooling flows to structures of galaxies. Quasars can provide energy to the surrounding medium in two ways, either through their radiative luminosity or through outflows. Strong continuum emission from quasars plays a significant role in providing the background radiation that keeps the intergalactic medium ionized at redshifts around three. Outflows from quasars themselves come in two different forms, seen as radio jets and as absorbing outflows. The feedback from jets can be sufficient to keep the cooling flows in clusters from cooling further to much lower temperatures (e.g. McNamara et al. 2001) or to regulate black hole growth (Rafferty et al., 2006) in cluster dominant galaxies. Only about 10% of all quasars, however, are radio-loud and may have radio jets, so jet-related feedback cannot be common. In a fraction of mostly radio-quiet quasars, absorption lines of highly ionized metals are observed blue-shifted with respect to the corresponding emission lines. These “absorbing outflows” then provide us with the most common form of possible quasar feedback. The outflows from active galactic nuclei (AGNs) might also be responsible for enriching the intergalactic medium with metals, especially if they are strong and contain high metallicity gas. Understanding the physical conditions in the absorbing components, and their mass and energy outflow rates, thus becomes very important.
Absorbing outflows have been studied in great detail in lower redshift, lower luminosity, Seyfert galaxies. Absorbing outflows exist in about 50% of AGNs, as seen through UV absorption lines (Crenshaw et al., 1999) and X-ray “warm absorbers” (Reynolds, 1997; George et al., 1998). In several of these AGNs, the UV absorber was found to be related to the X-ray absorber (Mathur et al., 1994, 1995, 1997, 1998; Monier et al., 2001). Chandra observations have revolutionized our understanding of absorbing outflows through detections of a large number of resonance lines, in addition to edges. One of the best spectra of AGN warm absorbers observed with Chandra is of NGC 3783 (Kaspi et al., 2002) which showed over 100 absorption lines from hydrogen-like and helium-like ions of multiple elements (Krongold et al., 2003; Netzer et al., 2003). This rich system was remarkably well-described with a simple two- or three-phase absorbing medium in pressure balance. In this paper we present results from the analysis of the Chandra spectrum of Mrk 279, a nearby Seyfert 1 galaxy (z=0.03).
Mrk 279 was observed on May 2002 with HST, FUSE and Chandra simultaneously, the results of which are published in Scott et al. (2004). These authors focus mainly on the HST and FUSE data because no O vii or O viii lines were detected in the X-ray spectrum due to the low S/N in the Chandra data, primarily because Mrk 279 happened to be in a low state at the time of the observation. A second observing campaign, again with all three observatories Chandra , HST and FUSE followed in May 2003. The results from the HST and FUSE observations are published in Gabel et al. (2005) and in Arav et al. (2005). Kaastra et al. (2004) discuss the density diagnostic power of O v K-shell absorption lines and apply it to the Mrk 279 X-ray spectrum. The detection of O v in the Chandra spectrum of Mrk 279 is not secure, but if the absorption is indeed due to O v line, then the distance of the absorber from the continuum source is constrained to be about one light week to a few light months. Costantini et al. (2005) present the Chandra LETG spectrum of Mrk 279 and report on the presence of a two component absorption system intrinsic to the source. In their preliminary analysis, presented in a conference proceedings, they find a low ionization component with total column density cm-2 and a higher ionization component with column density twice as high. These authors claim that the two absorption systems belong to two different outflow velocity systems with and km s-1 for the low and high ionization systems respectively.
We have recently developed a code called PHASE (discussed below) with the goal of understanding photoionized plasma such as found in the circumnuclear regions of AGNs. PHASE has been highly successful in its application to the Chandra spectrum of NGC 3783 (Krongold et al., 2003, 2004), NGC 985 (Krongold et al., 2005), and the XMM spectra of NGC 4051 (Krongold et al., 2006). In NGC 3783 we found an absorbing outflow with two ionization components in pressure balance with each other. We were able to accurately determine the size of the warm absorber for the first time in NGC 4051 by combining the detailed spectral model from the XMM-Newton RGS data to the variability observed in the XMM-Newton EPIC data. With the accurate PHASE modeling, we are in a position to rule out some models of AGN outflow such as those with continuous range of ionization parameters and those in which absorption arises in extended, kpc-scale structures.
Here we present our PHASE analysis of the Chandra spectrum of Mrk 279 from the 2003 observing campaign. With the long wavelength range observed, multiple ionization states of many elements are detected, which allow us to constrain the physical state of the absorber. The connection between the X-ray and the UV absorber can also be tested. Our goal is hence multi-fold: (1) we wish to constrain the physical conditions in the Mrk 279 outflow using Chandra data, (2) compare the results to the UV absorption system reported in Gabel et al. (2005), (3) compare our results with the results of Costantini et al. (2005), and (4) compare the Mrk 279 system with other AGN outflows.
2 Observations and Data Reduction
Mrk 279 was observed seven times by the Chandra X-ray observatory in May 2003, with the low energy transmission grating (LETG) and the high resolution camera spectroscopic array (HRC-S), for a total of 340 ks of exposure time. The full details of the observations and data reduction are presented in Williams et al. (2006) where the absorption system in the line of sight to Mrk 279 is discussed. The focus of this paper is instead on the intrinsic absorption line system. Spectral orders from to were included in the combined instrumental response matrix in order to model the continuum accurately. We note here that the resulting coadded LETG spectrum has a signal-to-noise ratio of S/N near 22Å, and the S/N is good over the wavelength range of 10–50Å. The typical LETG/HRC-S resolution is about 0.05Å (FWHM), or 600 km s-1 at 25Å. The 10–50Å spectrum is shown in Figure 1 of Williams et al. (2006).
3 Analysis
3.1 Spectral Fit
We conduct our analysis using Sherpa (Freeman et al., 2001) which is a part of the CIAO (Chandra Interactive Analysis of Observations, Fruscion (2002)) package. The global fit to the spectrum is performed using our recently developed code PHASE (PHotoionized Absorber Spectral Engine) which self-consistently reproduces the X-ray absorption spectrum of an intrinsic absorber. Detailed description of PHASE is given in Krongold et al. (2003); we describe it briefly here. PHASE calculates absorption due to ionized plasma using an extensive atomic database; the ionization balance is calculated using the CLOUDY code (version 90.04; Ferland 1997). As in CLOUDY, the incident continuum is from the AGN and a simple plane parallel geometry for the absorber is assumed. PHASE calculates both bound-bound and bound-free transitions, with lines including Fe L-shell transitions and the Fe M-shell UTA (unresolved transition array). At its simplest, the data can be fit with PHASE with only three input parameters: the equivalent hydrogen column density (), the ionization parameter (), and the wavelength centroid (expressed as the redshift of the absorber ). This model is also capable of fitting the velocity widths and the individual abundances of most pre-iron elements, though these are less well constrained than the primary parameters.
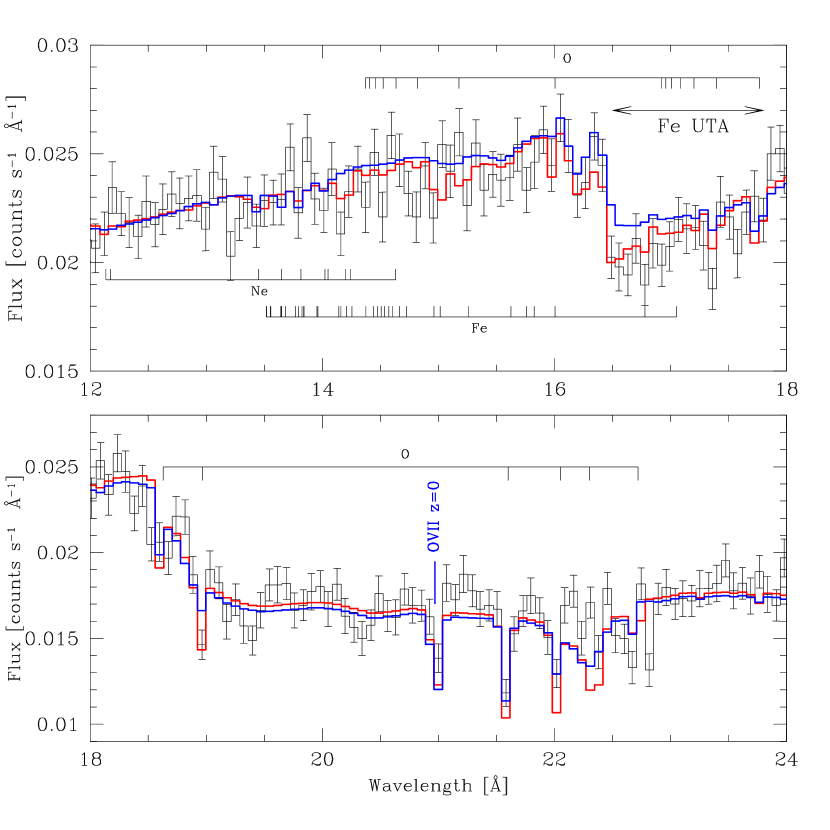
The observed continuum of Mrk 279 is reasonably fit with a single powerlaw and Galactic absorption of cm-2 as found in Williams et al. (2006). We allow the value of the Galactic absorption and the powerlaw to fit freely. The Galactic value is effectively fixed as the variation in it is small from solution to solution. The powerlaw must be allowed to fit freely as high metal column densities can have significant wide-band absorption effects. We have given the continuum the additional freedom of a broken powerlaw but the result is a fit with the break at 0.06 keV, below the observed energy range, indicating that the additional freedom is unnecessary. In all our models we shall report results with a continuum of a single powerlaw plus Galactic absorption. To this continuum model we add one (and later a second) PHASE absorber. Even with just the continuum model, the fit is good ( for degrees of freedom). As we show below, however, the fit improves significantly by adding an absorbing component. The strong 21.6 Å line in the spectrum of Mrk 279 is from O vii K at redshift zero as reported by Williams et al. (2006). In what follows we will discuss only the warm absorber intrinsic to Mrk 279.
3.2 Mrk 279 LIP Absorber
The most prominent absorption lines in the spectrum of Mrk 279 are those of C V, N VI, O V, O VI, and O VII (Figure 1) which all indicate the presence of a low-ionization absorber, similar to the low ionization phase (LIP) component observed in the spectra of other warm absorbers (e.g. NGC 3783, Krongold et al. 2003, Netzer et al. 2003). We therefore first try to fit the absorption spectrum with a single absorber. The quality of the fit will determine whether we must add additional components, and whether an additional component will improve the fit significantly. For our single-absorber fit, we use the PHASE model, and only allow three parameters to vary: the ionization parameter , the hydrogen column density , and the absorber redshift ; the continuum parameters are also allowed to vary. We fix the velocity width of the absorber to km s-1 as in Krongold et al. (2003) and the abundances are fixed to solar. Changing the velocity dispersion to smaller values did not significantly change our results.
The existence of an absorber is heavily favored with a . This absorber has best fit parameters of , , and an outflow velocity relative to systemic of km s-1. This solution is robust to initial conditions; we will refer to this absorber solution as our model 1 (Table 1) with a low-ionization phase (LIP) component.
3.3 Mrk 279 HIP Absorber
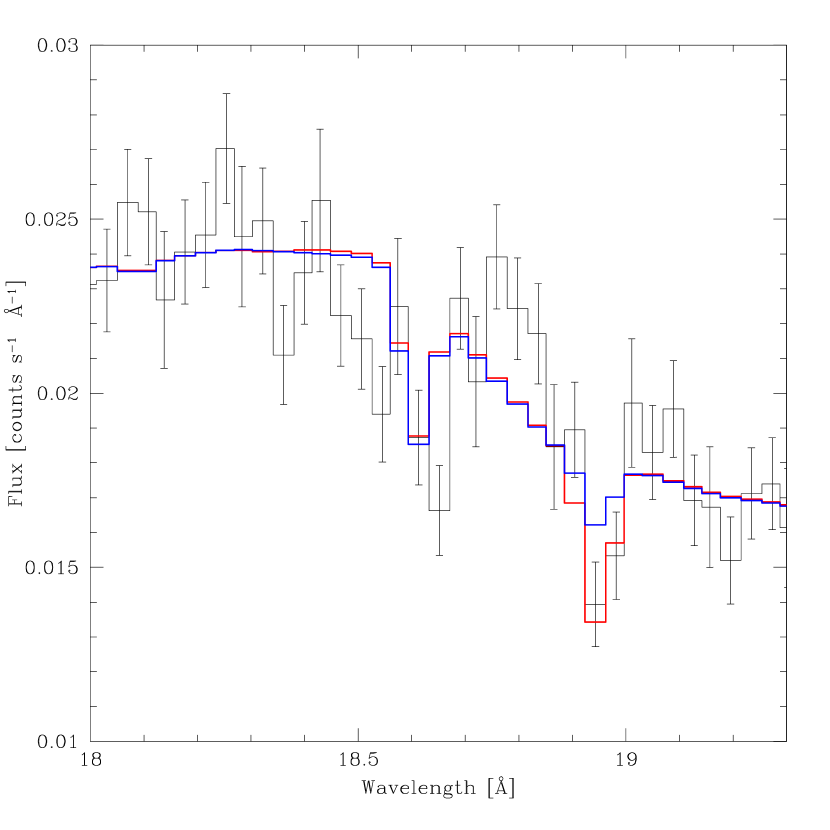
The best fit LIP single-absorber solution systematically under-predicts several lines, the most prominent of which is O VIII K (see figure 2), and also under-predicts the amount of absorption blue-ward of the Fe-UTA. This observation, again, is similar to that in NGC 3783, and suggests the presence of a higher-ionized phase (HIP) absorber component. While the LIP solution can be modified to fit the Hydrogen-like lines of carbon, nitrogen and oxygen by increasing the column densities of these elements, doing so severely over-predicts the amount of absorption due to the Helium-like ions. For this reason we add a second absorber to our model. In a similar manner to the process of fitting the LIP alone, we fit the LIPHIP model with three new degrees of freedom (, , and outflow velocity ).
The addition of this component (with three new degrees of freedom; , , and outflow velocity) has a of 43 indicating it is significant (F-test confidence of 99.999%)(Figure 1). The solution has , , and , . Typical errors on are and on are about for the LIP and for the HIP. We refer to this solution as our model 2 (Table 1). The large positive error in the ionization parameter of the LIP is due to the lack of accurate low temperature dielectronic recombination rate coefficients for Fe VII-XIII (see Krongold et al. 2005 for a detailed discussion). These charge states are responsible for absorption of the so-called unresolved transition array (UTA). Even though the UTA is weak in the Mrk 279 data, it can still produce a slight underestimation of U for this component. However, such underestimation cannot be by more than a factor of 2, as shown by Netzer (2004) and Kraemer et al. (2004).
Next we test the LIPHIP absorption solution for its sensitivity to the abundance of each element. We find that the LIP is most sensitive to the absorption lines of carbon, nitrogen, oxygen, and the UTA of iron. While the aggregate properties of all other elements influences the of the solution, the strengths of their individual lines are not significant. These elements and their ions simply do not have the cross-section or column densities to individually affect the LIP solution. In particular, we have no discriminatory power for helium, aluminum, silicon, argon, calcium, and nickel. A few remaining elements supported by PHASE are marginally seen, with slight evidence for neon absorption (though the data are also consistent with the continuum at these wavelengths). Possible magnesium absorption is also seen, but these lines are at a location in the spectrum where the continuum is not well determined; as a result, Mg absorption does not have any diagnostic power.
We find that absorption lines of C, N, and O (C V, N VI, O V, O VI, and O VII) are dominant contributers to the LIP, with tens of each, while iron contributes substantially with its UTA. On the other hand, the Carbon lines (C V and C VI) do not contribute significantly to the HIP. Oxygen and iron are the primary drivers in the need for an HIP. For this reason, we allow the metallicity of C, N, O, and Fe to vary but fix all other abundances to solar. This fit provides an additional and shifts the absorber parameters to , , and , . The improvement in the fit is again significant according to the F-test (for four additional degrees of freedom, the abundances of C, N, O, and Fe, the F-test confidence is 99.999%). We refer to this solution as our model 3 (Table 1).
All the four elements require some degree of super-solar abundance in this solution with abundances from about for carbon, for nitrogen, for iron to for oxygen. The parameters of these fits are given in Table 1 and abundances are given in Table 2. Even though the spectral fit is statistically better, this is not a robust result because the hydrogen column density in the warm absorber is not well constrained through X-ray observation. The X-ray data, however, do find non-solar abundance mixture, which is independent of the total overall metallicity. The best fit finds “super-solar” abundances for C,N,O and Fe because abundances of all other elements were fixed to solar. For this reason, we downplay this result based on X-ray data alone. However, the stability analysis and inclusion of FUV data (§4) makes the case for super-solar abundances stronger.
4 Discussion
4.1 Properties of the warm absorber
One somewhat surprising result is that we find that neon is under-abundant with respect to oxygen. We report only upper limits on the neon column because the significance of detection for any one line is small, especially if the continuum is not adequately determined. Even so, the limits we are able to set are meaningful if only because of the high abundance of oxygen. We find that the gas in the circumnuclear regions of Mrk 279 has a Ne/O ratio if not with respect to Solar (model 3). This is different from the intergalactic medium around the Galaxy where Ne is found to be overabundant with respect to oxygen (Williams et al. 2005, Nicastro et al. 2002).
The total hydrogen column density adding together the two phases detected in the X-ray is about cm-2. To our knowledge, this is the smallest column density of all known AGN outflows observed in X-rays. It is unlikely that there is a significant amount of column in any other intermediate temperature phase as all of the major absorption features are reasonably fit by the LIP and HIP combination (however, we cannot rule out the presence of a third, hotter, component producing absorption lines Fe XXIV to Fe XXVI as LETG data are not sensitive to these lines). In this sense, Mrk 279 contains the weakest absorber of all, and perhaps because of its weakness, it allows metallicity diagnostics. If the absorber column densities are large, there is a heavy blending of lines from different elements or even from different charge states of the same element, making it difficult to separate metallicity from total column density. In Mrk 279, however, the total column density is low, so only the strong lines are present, thus there is no blending and lines are also not saturated. This led us to find good evidence for super-solar abundances of C, O, N and Fe.
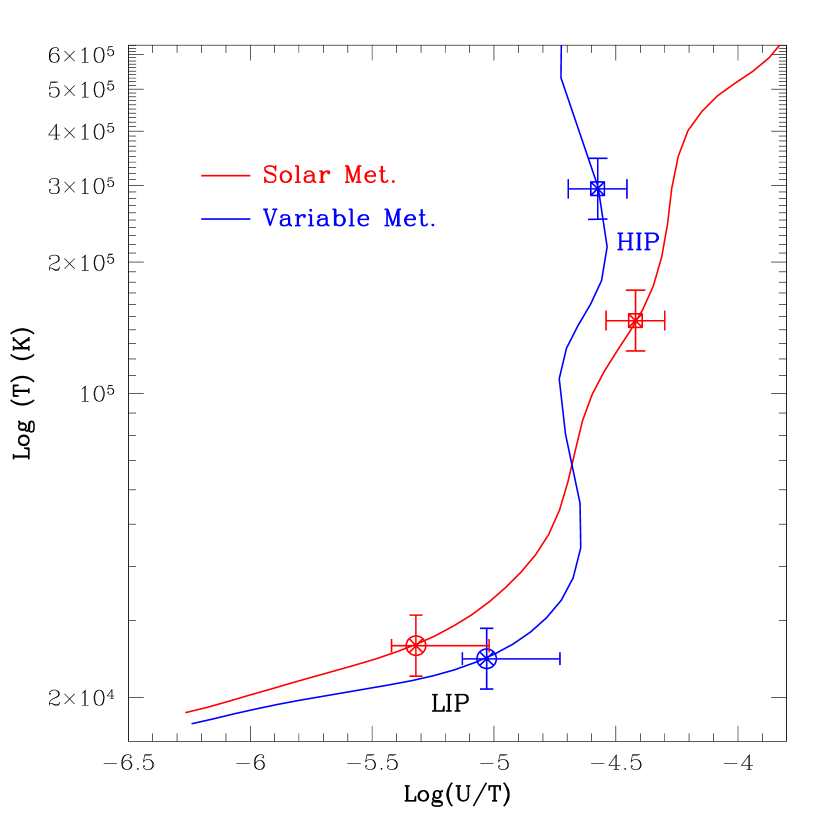
In NGC 3783, the LIP and HIP components were found to be in pressure balance. To test whether the same is true in Mrk 279, we generated a pressure–temperature equilibrium curve (the so called “S” curve) for the assumed spectral energy distribution which is shown in Figure 3. The solid red curve corresponds to absorbers with solar metallicity. Interestingly, we find that the LIP and HIP are not at the same pressure in this case. Another interesting thing about the red curve is that it shows a monotonic rise in pressure with temperature; it has no equilibrium zone where components of different temperatures can exist in pressure balance with each other. Such behavior is seen in sources with steep soft X-ray spectra (e.g. NGC 4051, Komossa & Mathur (2001)). Indeed, in Mrk 279, the continuum fit has a slope of , which may be the cause of the observed shape of the equilibrium curve. It should be noted, however, that with LETG data, we are not sensitive to the harder X-ray range, so it is possible that the intrinsic continuum of Mrk 279 is flatter, and in that case, the true “S” curve will have an equilibrium zone. Given the observed spectral shape, however, there is no equilibrium zone and the LIP and HIP components are not in pressure balance. Komossa & Mathur (2001) showed that the shape of the equilibrium curve not only depends upon the spectral energy distribution of the source, but also on the metallicity of the absorber and that super-solar abundances restore the equilibrium zone in steep spectrum sources. Since we have some evidence of super-solar abundances in Mrk 279, we generated a new pressure–temperature with super-solar abundances of C, O, N and Fe as observed; this is shown as the solid blue curve in figure 3. As expected, the new solution develops an equilibrium zone and, within the uncertainties, the LIP and HIP components are now at the same pressure. This exercise makes the case for super-solar abundances stronger.
4.2 Comparison with the UV absorber
We can also compare our results to that of Gabel et al. (2005) who looked at the absorption in UV wavebands covered by FUSE and HST simultaneously with the X-ray observations. The UV/FUV resolution is much higher than X-ray resolution, and each absorption line was found to be made of multiple kinematic components (labeled 2, 2a and 4a by Gabel et al. (2005)). These authors report column densities for “2+2a” and “4a” components, each in H I, C IV, N V, and O VI for two models (A & B). In model A, a single covering factor was assumed to describe all lines while in model B, independent covering factors for the continuum source and emission lines were assumed. Since none of the kinematic components can be resolved in the X-ray spectrum of Mrk 279, we will consider total column density of each ion in their two models A & B. Since Gabel et al. (2005) do not discuss a photoionization model that best fits their ionic column densities, and since PHASE does not yet have the capacity to fit UV/FUV spectra simultaneously with X-ray spectra, we construct photoionization models with Cloudy (Ferland et al., 1998) and look for solutions to each of their two models to test the consistency with our X-ray results. Without detailed knowledge of the data reduction process we assign conservative 0.1dex uncertainties to each of their column density measurements, since the errors are not reported in Gabel et al. (2005).
We create Cloudy models with solar abundance and mixtures and with the Mrk 279 SED (consistent with the PHASE models above) and search for models with predictions consistent with column densities of all four ions observed in the UV. In Gabel et al. (2005), the C IV and H I columns are measurements, while the N V and O VI columns are lower limits in most of the models. We then note which – values produce models with column densities consistent with observations; this process is similar to that presented in Fields et al. (2005a, b). Recall that we have assigned uniform conservative uncertainties to these column densities and thus the best-fit model should only be considered “plausible”. Let us first focus on Model B which is the preferred model of Gabel et al. (2005). We find that the HIP solution does not contribute significantly to the UV absorber. This is no surprise and this result is similar to that found in other AGNs, e.g. NGC 3783. As in other AGNs, it is possible that the LIP solution is related to the UV absorber, so we compared the predictions from the LIP solution of our model 2 (two absorber solution with solar abundance) with UV column densities as in Model B. To out surprise we found that the the X-ray model significantly overproduces UV column densities for either “” or “” systems (figure 4).
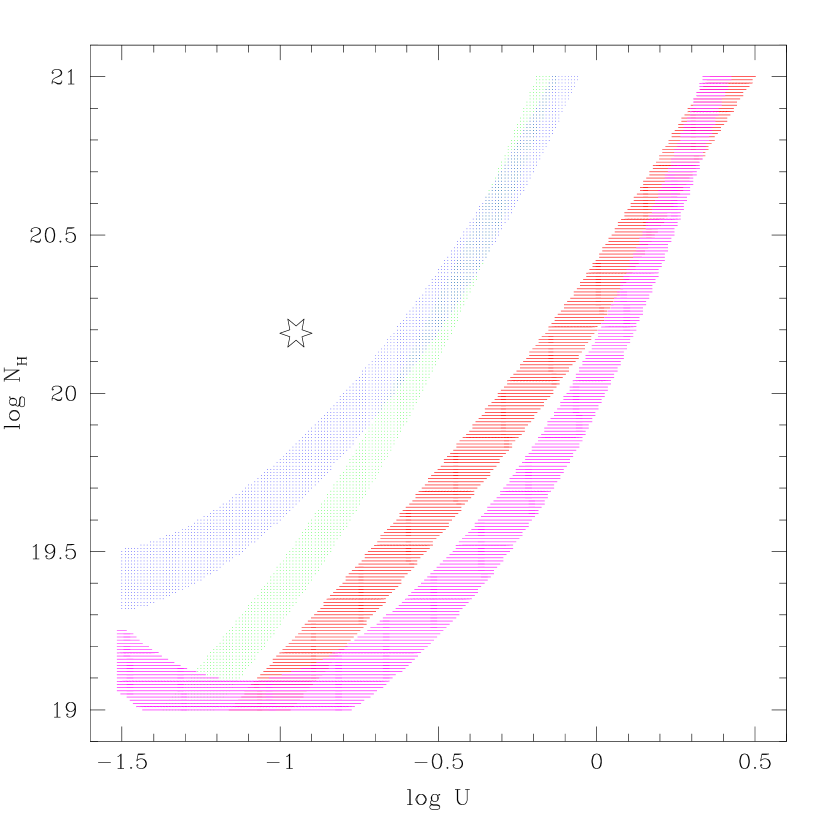
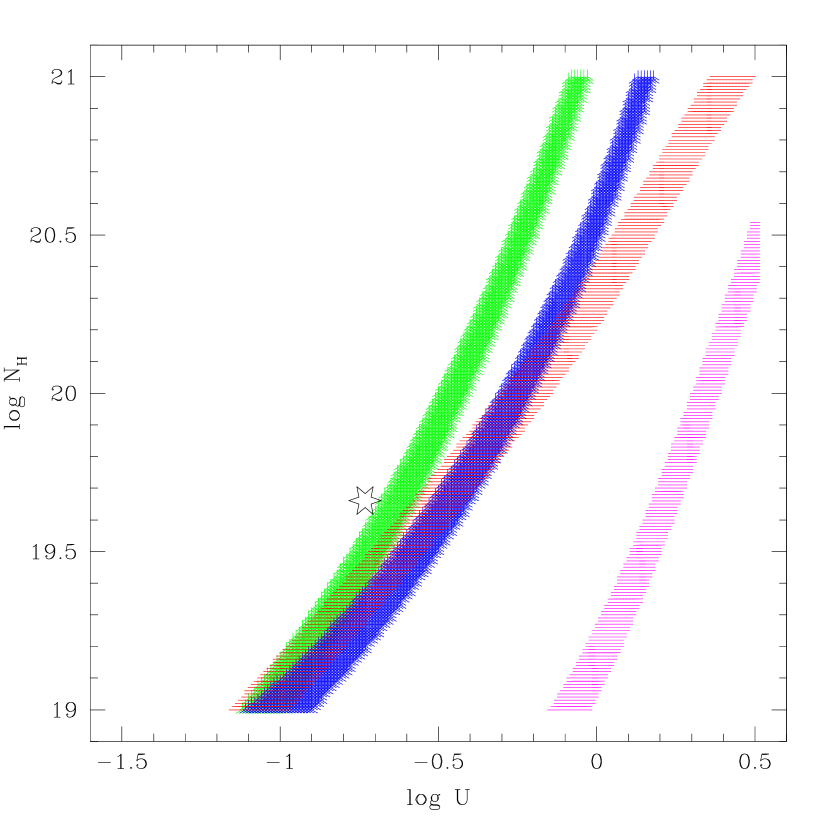
Next we tried our model 3 (two absorber solution with variable abundance) for comparison with the UV data. In this case, the LIP solution has elemental abundances for carbon, for nitrogen, and for oxygen (§3.2). The C IV, N V and O VI column densities were adjusted accordingly to reflect the super-solar abundances in producing the – plot. The result is shown in figure 5 and it clearly shows that the LIP solution (marked with an open star) is consistent with the contours of allowed values of the UV data for “” systems (model B). Note that the N V and O VI contours are lower limits, so all the values toward upper left of the contours are allowed. H I is not detected in system , so the allowed range is for system “” only.
The above analysis leads to two results: (1) the LIP component of the X-ray absorber and the UV absorber appear to arise in the same part of the nuclear outflow of Mrk 279 and (2) there is evidence of super-solar metals in the outflow. The first result is interesting in that it unifies the X-ray and UV absorbers (e.g. Mathur et al. 1994, 1995), but is not particularly surprising given that such a relationship is now seen in several AGNs. The second result is, however, surprising. The PHASE analysis of the X-ray spectrum itself pointed toward this solution, but given the uncertainty in various parameters we did not consider this as a robust result, even though it was statistically significant. The unification of the X-ray/UV data, however, requires super-solar abundances of metals, making this a much more robust result.
4.3 Comparison with Costantini et al. and Arav et al.
The parameters of the ionized outflow that we find are different from the preliminary report by Costantini et al. (2005) (§1). The total column density of the ionized absorber that we find () is lower by over two orders of magnitude for both the LIP and HIP. We note that our result is consistent with the UV value in Gabel et al. (2005). A total column density larger than cm-2, as in Costantini et al. (2005), is clearly ruled out. In the final stages of our work we found that Costantini et al. (2006) have published their work. Our new result agrees with their new result in that they too find the column density of the absorber to be about with two distinct components of low- and high-ionization parameter, similar to our LIP and HIP. Costantini et al. (2006) find somewhat different outflow velocities for their two components ( and km s-1). We find the outflow velocity of km s-1, similar to that of their low-velocity component, and the LIP and HIP have similar velocities within the uncertainties (2). The Costantini et al. (2006) paper does not discuss the relation between the X-ray and UV absorbers or the evidence for super-solar carbon, nitrogen and oxygen. They rule the presence of a “compact” Mrk 279 outflow in which LIP and HIP are in pressure balance based on analysis similar to what is shown in figure 3. As we show, however, that the super-solar abundances alleviate this problem (and, perhaps, a flatter intrinsic continuum). The present observations are thus fully consistent with a compact absorber in Mrk 279.
After we submitted our paper, we became aware that Arav et al. (2007) have independently arrived at conclusions similar to ours in that the CNO abundances in Mrk 279 are super-solar.111Their preprint appeared on the electronic preprint archive astro-ph. These authors derived abundances based on UV data and found their result to be consistent with the X-ray data; in this sense their approach is complementary to ours and it is good to see that two different methods gave similar results overall. The exact abundance values are consistent for carbon and nitrogen (about 2.4 and 4.5 solar respectively), but differ by 3 for oxygen (we get while Arav et al. report solar). Arav et al. method is not sensitive to iron abundance, which we find to be solar.
5 Conclusion
The column density of the outflow in Mrk 279 is much lower than that in other AGNs, e.g. NGC 3783 (Krongold et al., 2003), NGC 5548 (Mathur et al., 1995), or NGC 4051 (Krongold et al., 2006). In this sense, the outflow in Mrk 279 is the weakest one we know. The column density does not seem to be correlated to the source luminosity; the luminosity of NGC 4051 is a factor of one hundred lower than that of Mrk 279.
By itself, the evidence of super-solar abundances in the X-ray spectrum of Mrk 279 is not strong. However, the unification of UV and X-ray absorbers and the pressure balance between the two components (LIP and HIP) of the outflow, both require super-solar abundance. This strengthens the case for it.
Among all the AGNs for which high resolution X-ray spectra are available, Mrk 279 is the first case in which super-solar elemental abundances are found . This may be related to the fact that Mrk 279 contains the weakest absorber, so the absorption lines are not blended. This allows us to separate the effect of metallicity from that of column density, which was difficult to do in other AGNs with stronger absorbers. The only other AGN in which a robust metallicity measurement is made, based on absorption line study, is Mrk 1044 (Fields et al., 2005b). Mrk 1044 is a narrow-line Seyfert 1 galaxy (NLS1) and the super-solar metallicity in its nuclear outflow was related to its being a NLS1. The evidence of super-solar metallicity in Mrk 279, a normal, low luminosity Seyfert galaxy, makes us wonder if high metallicities are common in circumnuclear regions of AGNs. If this is the case, then strong outflows may contribute significantly toward enriching the intergalactic medium.
Since we do not know the exact geometry and location of the warm absorber in Mrk 279, it is difficult to calculate its rate of mass and energy outflow. The location of the warm absorber in NGC 4051 is found to be 0.5–1.0 light days from the central source (Krongold et al. 2006). If the distance of the warm absorber from the nucleus scales as the square root of the luminosity, then, it would be about 5–10 light days for Mrk 279. Assuming a covering fraction of 10%, the mass outflow rate is M⊙ yr-1 and the kinematic luminosity is erg s-1. This wind is a negligible component of the AGN both bearing away a small fraction of the total mass accretion rate () and carrying a small fraction of the radiative luminosity ().
To summarize, we find that the warm absorbing outflow in Mrk 279 has two components in pressure balance with each other. The X-ray and UV absorbers appear to be parts of the same overall outflow. Super-solar metal abundances are required to reconcile the X-ray and UV absorber properties. The outflow is very weak, however, and is unlikely to make any significant impact on the energy balance in the host galaxy or the surrounding intergalactic medium.
References
- Arav et al. (2005) Arav, N., Kaastra, J., Kriss, G.A., Korista, K.T., Gabel, J., & Proga, D. 2005, ApJ, 620, 665
- Costantini et al. (2005) Costantini, E., Kaastra, J.S., Steenbrugge, K.C., Arav, N., Gabel, J.R., & Kriss, G. 2005, AIPC, 774, 321
- Costantini et al. (2006) Costantini, E. et al. 2006, A&A, in press (astro-ph/0609385)
- Crenshaw et al. (1999) Crenshaw, D.M., Kraemer, S.B., Boggess, A., Maran, S.P., Mushotzky, R.F., & Wu, C-C. 1999, ApJ, 516, 750
- Freeman et al. (2001) Freeman, P., Doe, S., & Siegiginowska, A. 2001, Proc. SPIE, 4477, 76
- Fruscion (2002) Fruscione, A. 2002, Chandra News, 9, 20
- Ferland et al. (1998) Ferland, G. J., Korista, K. T., Verner, D. A., Ferguson, J. W., Kingdon, J. B., & Verner, E. M. 1998, PASP, 110, 761.
- Fields et al. (2005a) Fields, D.L., Mathur, S., Pogge, R.W., Nicastro, F., & Komossa, S. 2005, ApJ, 620, 183
- Fields et al. (2005b) Fields, D.L., Mathur, S., Pogge, R.W., Nicastro, F., Komossa, S., & Krongold, Y. 2005, ApJ, 620, 183
- Gabel et al. (2005) Gabel, J.R., Arav, N., Kaastra, J.S., Kriss, G.A., Behar, E., Costantini, E., Gaskell, C.M., Korista, K.T., Laor, A., Paerels, F., Proga, D., Quijano, J.K., Sako, M., Scott, J.E., & Steenbrugge, K.C. 2005, ApJ, 623, 85
- George et al. (1998) George, I.M., Turner, T.J., Netzer, H., Nandra, K., Mushotzky, R.F., & Yaqoob, T. 1998 ApJS, 114, 73
- Kaastra et al. (2004) Kaastra, J.S., Raassen, A.J.J., Mewe, R., Arav, N., Behar, E., Costantini, E., Gabel, J.R., Kriss, G.A., Proga, D., Sako, M., & Steenbrugge, K.C. 2004, A&A, 428, 57
- Kaspi et al. (2002) Kaspi, S., Brandt, W.N., George, I.M., Netzer, H., Crenshaw, D.M., Gabel, J.R., Hamann, F.W., Kaiser, M.E., Koratkar, A., Kraemer, S.B., Kriss, G.A., Mathur, S., Mushotzky, R.F., Nandra, K., Peterson, B.M., Shields, J.C., Turner, T.J., & Zheng, W. 2002, ApJ, 574, 643
- Komossa & Mathur (2001) Komossa, St. & Mathur, S. 2001, A&A, 374, 914
- Krongold et al. (2006) Krongold, Y., Nicastro, F., Elvis, M., Brickhouse, N., Binette, L., Mathur, S., & Jiménez-Bailón. 2006, ApJ, in preparation
- Krongold et al. (2005) Krongold, Y., Nicastro, F., Elvis, M., Brickhouse, N.S., Mathur, S., & Zezas, A. 2005, ApJ, 620, 165
- Krongold et al. (2004) Krongold, Y., Nicastro, F., Brickhouse, N.S., Elvis, M., & Mathur, S. 2004, ApJ, 622, 842
- Krongold et al. (2003) Krongold, Y., Nicastro, F., Brickhouse, N.S., Elvis, M., Liedahl, D.A., & Mathur, S., 2003, ApJ, 597, 832
- Mcnamara et al. (2001) McNamara, B. et al. 2001, ApJ, 562, L149
- Mathur et al. (1994) Mathur, S., Wilkes, B., Elvis, M., & Fiore, F. 1994, ApJ, 434, 493
- Mathur et al. (1995) Mathur, S., Elvis, M., & Wilkes, B. 1995, ApJ, 452, 230
- Mathur et al. (1997) Mathur, S., Wilkes, B.J., & Aldcroft, T. 1997, ApJ, 478, 182
- Mathur et al. (1998) Mathur, S., Wilkes, B., & Elvis, M. 1998, ApJ, 504, 23
- Monier et al. (2001) Monier, E.M., Mathur, S., Wilkes, B., & Elvis, M. 2001, ApJ, 559, 675
- Netzer et al. (2003) Netzer, H., Kaspi, S., Behar, E., Brandt, W.N., Chelouche, D., George, I.M., Crenshaw, D.M., Gabel, J.R., Hamann, F.W., Kraemer, S.B., Kriss, G.A., Nandra, K., Peterson, B.M., Shields, J.C., & Turner, T.J. 2003, ApJ, 599, 933
- Nicastro et al. (2002) Nicastro, F., Zezas, A., Drake, J., Elvis, M., Fiore, F., Fruscione, A., Marengo, M., Mathur, S., & Bianchi, S. 2002, ApJ, 573, 157
- Rafferty et al. (2006) Rafferty, D.A., McNamara, B.R., Nulsen, P.E.J., & Wise, M.W. 2006, ApJ, submitted (astro-ph/0605323)
- Reynolds (1997) Reynolds, C.S., 1997, MNRAS, 286, 513
- Scott et al. (2004) Scott, J.E., Kriss, G.A., Lee, J.C., Arav, N., Ogle, P., Roraback, K., Weaver, K., Alexander, T., Brotherton, M., Green, R.F., Hutchings, J., Kaiser, M.E., Marshall, H., Oegerle, W., & Zheng, W. 2004, ApJS, 152, 1
- Williams et al. (2005) Williams, R.J., Mathur, S., Nicastro, F., Elvis, M., Drake, J.J., Fang, T., Fiore, F., Krongold, Y., Wang, Q.D., & Yao, Y. 2005, ApJ, 631, 856
- Williams et al. (2006) Williams, R., Mathur, S., & Nicastro, F. 2006, ApJ, 645, 179
| Absorberbb Model 1 Single absorber, Solar metallicity
Model 2 Two absorbers, Solar metallicity Model 3 Two absorbers, CNOFe variable abundances. |
/d.o.f. | ||||||
|---|---|---|---|---|---|---|---|
| Model 1 | 19.94 | 16.49 | 15.91 | 16.81 | 15.45 | 2888/3195 | |
| Model 2: LIP | 20.19 | 16.74 | 16.16 | 17.03 | 15.70 | 2845/3192 | |
| Model 2: HIP | 19.5 | 16.27 | 16.05 | 17.26 | 15.72 | … | |
| Model 3: LIP | 19.66 | 16.61 | 16.29 | 17.46 | 16.04 | 2814/3188 | |
| Model 3: HIP | 19.5 | 16.44 | 16.13 | 17.29 | 15.88 | … |
| Element | Abundance relative to Solar |
|---|---|
| Carbon | 2.5 |
| Nitrogen | 4.6 |
| Oxygen | 8.4 |
| Iron | 7.4 |