The UV Properties of SDSS Selected Quasars
Abstract
We present an analysis of the broadband UV and optical properties of quasars matched in the Galaxy Evolution Explorer (GALEX) General Data Release 1 (GR1) and the Sloan Digital Sky Survey Data Release 3 (SDSS DR3). Of the 6371 SDSS DR3 quasars covered by 204 GALEX GR1 tiles, 5380 (84%) have near-UV detections, while 3034 (48%) have both near-UV and far-UV detections using a matching radius of 7″. Most of the DR3 sample quasars are detected in the near-UV until , with the near-UV detection fraction dropping to by . Statistical tests performed on the distributions of non-detections indicate that the optically selected quasars missed in the UV tend to be optically faint or at high redshift. The GALEX positions are shown to be consistent with the SDSS astrometry to within an rms scatter of 0.6-0.7″ in each coordinate, and the empirically determined photometric errors from multi-epoch GALEX observations significantly exceed the Poissonian errors quoted in the GR1 object catalogs. The UV-detected quasars are well separated from stars in UV/optical color-color space, with the UV/optical relative colors suggesting a marginally detected population of reddened objects due to absorption along the line of sight or due to dust associated with the quasar. The resulting spectral energy distributions (SEDs) cover Å (rest frame), where the overall median SED peaks near the Ly emission line, as found in other UV quasar studies. The large sample size allows us to construct median SEDs in small bins of redshift and luminosity, and we find the median SED becomes harder (bluer) at UV wavelengths for quasars with lower continuum luminosity. The detected UV/optical flux as a function of redshift is qualitatively consistent with attenuation by intervening Lyman-absorbing clouds. A table containing the 6371 DR3 quasars covered by GALEX GR1 and the results of the matching is available in the electronic edition of the journal, and a table containing the overall median SED is also available.
1 INTRODUCTION
One of the primary goals of large-scale UV and optical sky surveys is to create large sample sizes, crucial for a statistically significant measurement and interpretation of the ubiquitous properties displayed by active galactic nuclei (AGN), such as broad emission lines and power-law continua. In quasars, a large fraction of the bolometric luminosity is emitted in a strong, broad feature that begins to dominate the spectral energy distribution (SED) at the bluest optical wavelengths (the ‘big blue bump’; hereafter BBB; Sanders et al., 1989) and appears to extend shortward to the current limits of UV satellite data ( Å). Previous work that interprets the rise in the continuum as the thermal signature of a large and hot accretion disk surrounding a central supermassive black hole (e.g., Shields, 1978; Malkan & Sargent, 1982) has argued that the BBB should peak in the extreme ultraviolet (EUV), shortward of the Lyman limit at 912 Å (Mathews & Ferland, 1987; Hubeny et al., 2000; Frank et al., 2002). Superimposed on the BBB is yet another feature (the ‘small blue bump’; hereafter SBB) attributed to Balmer continuum and complex Fe II emission from the broad line region (Grandi, 1981; Wills et al., 1985). The BBB and SBB are characteristic features of quasar emission; therefore UV and optical observations are a critical probe of the physics of the inner regions of quasars. Deep UV observations have the added capability of sampling the ionizing flux, which gives rise to the powerful emission lines that are a trademark of quasar spectra.
Zheng et al. (1997) have used Hubble Space Telescope (HST) observations to construct composite rest-frame UV spectra from 101 AGN with that display a break in the UV/optical power-law continuum near Å (specifically, the EUV continuum blueward of the break is softer than the continuum redward of the break). This result was confirmed by Telfer et al. (2002) for a larger sample of 184 AGN with redshifts in the range , who also demonstrated no evolution of the EUV spectral index () with redshift and only a moderate trend with luminosity for the radio-loud objects. However, Scott et al. (2004) concluded that the UV continuum from their composite of 85 AGN spectra with taken from Far Ultraviolet Spectroscopic Explorer (FUSE) archival data, can be characterized by a single power law. Given that the FUSE sample spectra have enhanced emission lines relative to the HST sample and have a median luminosity that is nearly an order of magnitude lower, this suggests that the strength of any continuum break may be luminosity dependent. The results obtained from the redshift and luminosity distributions of the FUSE and HST AGN samples also suggest possible evolution of the UV SED with redshift.
High S/N rest-frame UV/optical composites have also been constructed from large samples in ground based optical surveys, such as the composite of 688 optically-selected quasars from the Large Bright Quasar Survey (Francis et al., 1991), 657 radio-selected quasars (with a larger fraction of low-redshift objects) from the First Bright Quasar Survey (Brotherton et al., 2001), and for 2200 optically-selected quasars spanning from the Sloan Digital Sky Survey (SDSS; Vanden Berk et al., 2001). These studies have provided great insight into the detailed properties of quasars longward of Ly , but optical spectra alone can only probe the regions shortward of Ly at higher redshifts (), where the density of Lyman-absorbing clouds is high and significantly limits both the number of detections and the S/N.
We investigate the results reported for FUSE and HST UV composite SEDs by expanding the sample size by more than an order of magnitude — covering the full range of luminosity and redshift spanned by both studies. We also perform an empirical analysis of the Galaxy Evolution Explorer (GALEX; Morrissey et al., 2005) astrometry and photometry that is crucial for any assessment of the reliability of GALEX positions and interpretations of the resulting UV/optical colors and SEDs. In §2, we describe the data sets used to find UV/optical candidates taken from the GALEX General Data Release 1 (GR1)111GR1 documentation can be accessed at http://galex.stsci.edu/GR1/ and the Sloan Digital Sky Survey (SDSS; York et al., 2000) Data Release 3 (DR3; Abazajian et al., 2005), as well as the description of the construction of a clean and statistically significant photometric sample of quasars. An analysis of the UV/optical colors of the photometric sample of GALEX/SDSS matches, as well as the resulting SEDs, are given in §3, and §4 summarizes our results obtained from the clean sample and the interpretation of the mean quasar SED luminosity and redshift dependence. Throughout this paper we assume a -dominated flat cosmology with and H0 = 70 km s-1 Mpc-1, consistent with the latest WMAP results of Spergel et al. (2006). In our study, none of the objects in our UV/optical sample have been corrected for photometric contributions from the host galaxy. Unless otherwise indicated, we correct all photometry for Galactic extinction using the extinction maps of Schlegel et al. (1998).
2 THE DATA SET
The inclusion of UV observations allows for (1) diagnostics that can probe the evolution of the UV/optical SED with redshift, and (2) observations of the rest-frame UV emission from lower redshift quasars that are not heavily affected by the Ly forest of absorption (Lynds, 1971), which one cannot accomplish with optical surveys alone. The accurate photometry ( mag) and size (46,420 quasars) of the SDSS DR3 Quasar Catalog (Schneider et al., 2005) provides a unique context for the interpretation of UV observations.
2.1 GALEX
The GALEX General Data Release 1 (GR1; Morrissey et al., 2005; Martin et al., 2005) includes observations covering nearly 8000 deg2 of sky in four imaging surveys and two grism surveys as of December 2004. GALEX is a NASA Explorer Mission that is performing an All-Sky Imaging Survey (AIS) to , a Medium Imaging Survey (MIS) covering 1000 deg2 to , a Deep Imaging Survey (DIS) covering 100 deg2 to , and a Nearby Galaxy Survey (NGS) with a surface brightness limit of arcsec-2. The observations are obtained in two UV bands — the far-ultraviolet (the FUV band) covering Å and the near-ultraviolet (the NUV band) covering Å. The AB-magnitudes corresponding to the FUV and NUV bands will hereafter be denoted by and , respectively. The 125 field-of-view was designed to attain 4″-6″ resolution; currently the processing pipeline is achieving a FWHM of 65 in the FUV band and 72 in the NUV band (Martin et al., 2005). The large sample of objects provided by GALEX, along with deep surveys in the optical and the near-IR, provides multiwavelength coverage for a large number of galaxies, constraining star-formation models and their evolution with cosmic time. Lyman absorption causes the flux of many optically identified sources to quickly diminish with redshift at shorter wavelengths; however, the extended coverage beyond the rest-frame Lyman limit at 912 Å for higher redshift objects has allowed for a number of UV counterparts to optical SDSS sources to be identified. For many objects, GALEX also allows a glimpse of the wavelength regime shortward of Ly , and has permitted observations as blue as Å in the rest frame (), beyond which the Lyman absorption becomes very strong.
2.2 SDSS
The SDSS will map deg2 of the sky (mainly concentrated at high Galactic latitudes) and obtain spectra for galaxies and quasars in five optical photometric bands (u,g,r,i,z; Fukugita et al., 1996) to a depth of r (York et al., 2000) — with photometric errors of less than 0.02 magnitudes (Ivezić et al., 2004), and an astrometric accuracy better than 01 for r (Pier et al., 2003). The SDSS obtains imaging with a CCD mosaic camera (Gunn et al., 1998) coupled to a dedicated 2.5m telescope (Gunn et al., 2006) at the Apache Point Observatory. The SDSS DR3 (Abazajian et al., 2005) contains more than cataloged objects covering over 5000 deg2 of sky, and the Quasar Catalog includes observations of 46,420 type 1 quasars with and (Schneider et al., 2005). In common with the GALEX photometric system, the u, g, r, i, and z magnitudes are normalized to lie on the AB-system (Oke & Gunn, 1983; Smith et al., 2002).
The SDSS quasar survey is largely motivated by two science goals: (1) to address the evolution of the quasar luminosity function with time and (2) to examine the redshift dependence of quasar clustering. The SDSS quasar target selection algorithm (Richards et al., 2002) uses point-spread function magnitudes corrected for Galactic extinction; it involves targeting those objects that are unresolved in the FIRST radio survey (Becker et al., 1995) and occupy distinct regions of multi-dimensional color space outside of the stellar locus and the regions occupied by nonactive galaxies — optimized for the low- and high-redshift objects and to detect quasars for . For quasars with i , 95% are found by the SDSS color-selection technique (Vanden Berk et al., 2005). The DR3 Quasar Catalog (46,420 objects) consists of images taken between 1998 September 19 and 2003 May 1, as well as spectra obtained between 2000 March 5 and 2003 July 6. The bright limit of the target selection algorithm is i = 15.0.
2.3 Cross-Matching and Astrometry
Previous work finding matches between GALEX and the SDSS has been implemented using GALEX Early Release Observations (ERO) for fields not restricted to quasars (e.g., Agüeros et al., 2005), for internal data releases (e.g., Bianchi et al., 2005; Seibert et al., 2005), and for small regions covered by Spitzer (Richards et al., 2006). We searched for UV counterparts to the 6371 SDSS DR3 quasars covered by 204 GALEX tiles in the GALEX GR1 merged object catalogs (hereafter referred to as the ‘quasar sample’) — using an initial search radius = 7″ (roughly 1″ larger than the FWHM of the angular resolution limit in the NUV band; for a more complete description see Morrissey et al., 2005). For a mean SDSS quasar separation of 20′ on the sky, the astrometry of GALEX (see below) and the SDSS is more than sufficient such that the typical astrometric errors for a given source location will be significantly smaller than the average quasar separation — this simplifies the matching routine significantly, since the probability of more than one quasar lying within our search radius is extremely small. In the case of more than one GALEX UV source coincident with an SDSS DR3 quasar to within 7″, the closest one was selected. When overlapping GALEX GR1 tiles each covered the same SDSS quasar, we have selected the observation from the tile with the highest effective exposure time () in the NUV band (and, in general, correspondingly smaller photometric uncertainties for the same objects due to higher S/N).
After matching the DR3 quasar sample with the GR1 catalogs, 5380 quasars (84.4%) are detected in the NUV, while 3034 (47.6%) are detected in both the NUV and the FUV. We also note that 38 quasars (0.6%) were detected only in the FUV (see discussion below). There were 953 (14.9%) quasars with no GR1 counterparts; a statistical analysis of the DR3 quasars with and without a UV detection is given in §3.1. The mean separation between a DR3 quasar and the nearest GALEX UV source was 1″, with of the quasars having more than one UV source within 7″. If a specific tile has been observed multiple times, then we use the coadded result; however, the GALEX source extractor can and does identify UV sources unique to each epoch, so it is possible that an appreciable fraction of the quasars with multiple UV sources within 7″ are simply due to this phenomenon. For the quasars with multiple associated UV sources, the mean nearest separation is 07, while the mean separation of the next nearest UV source is 14.
Our matches with only an FUV detection were rare — with 18 sources appearing on MIS tiles, 19 on AIS tiles, and a single source on a NGS tile. Diffuse reflections from bright stars located immediately outside the GALEX detector field of view are not flagged as image artifacts in the merged object catalogs, and can artificially increase the number of false point source extractions for a given field. In addition, the source extractor of the GALEX image processing pipeline will often fragment resolved objects into individual UV sources, thereby contaminating search results with multiple matches to the same optical counterpart222For additional GR1 documentation and a description of data caveats see http://www.galex.caltech.edu/DATA/.. For the remainder of our analysis, we exclude the FUV-only matches to the quasar sample, and given the small fraction of the total sample with FUV only detections, we expect the remainder of our matches to be negligibly contaminated by false detections.
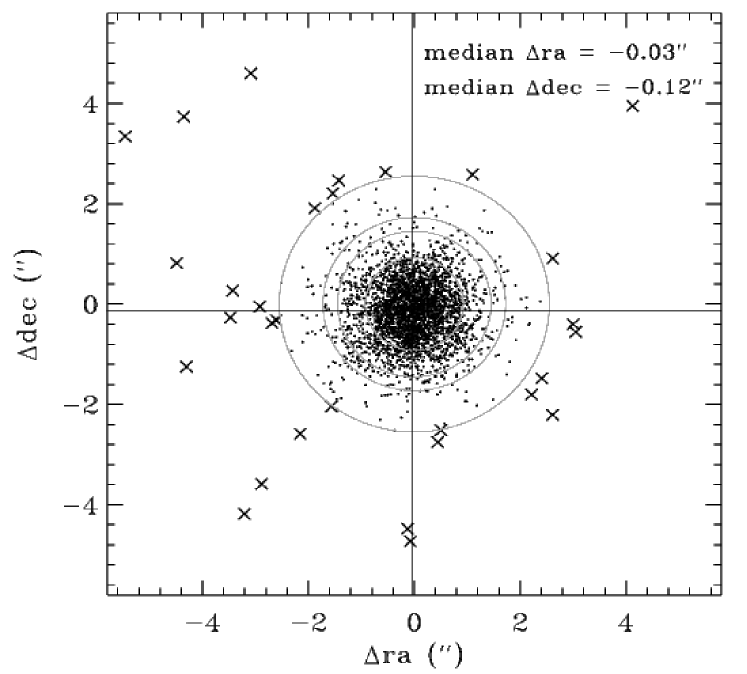
Figure 1 illustrates the coordinate offsets between SDSS and GALEX positions for all of the matches in both UV bands. These results show that % of our matches lie within a matching radius = 1.7″, while % are included if = 2.6″. The median offsets in right ascension and declination are -003 and -012 respectively. Monte Carlo simulations were used to generate predicted distributions of coordinate offsets between GALEX and SDSS positions, using a set objects and assuming an rms = 01 for each SDSS coordinate. A comparison of the simulation results with our observed distribution of positional offsets shows that our statistics are consistent with = 0.6-0.7″ for each GALEX coordinate (the 01 rms for the majority of SDSS objects contributes negligibly when added in quadrature). Our sample is not significantly contaminated by false matches (there is no large excess of objects at larger separations); although, as one might expect, there are noticably more high- matches than predicted by our simulations, primarily because our Monte Carlo runs do not take into account possible systematic errors affecting the GALEX astrometry (e.g., the rate of false matches introduced by multiple source extractions of resolved sources or image artifacts). Our assessments of the GALEX astrometry by making use of SDSS positions are fully consistent with the astrometry derived from ground-based calibrations conducted by the GALEX collaboration333The GALEX collaboration website is http://www.galex.caltech.edu/..
For a completely random distribution of GALEX UV sources in the deepest (DIS) fields, the probability of any (star or galaxy) UV source coincident with an SDSS quasar for = 7″ is , while it is for = 26. Given that the majority () of the SDSS quasars are covered by shallower tiles, we use 1% as a liberal upper bound to our contamination rate by non-quasar counterpart UV detections (either by stars or image artifacts). Accordingly, for the remainder of our analysis and our discussion we will refer to the ‘detections’ as those matches with GALEX/SDSS separations less than 26 (5165 NUV detections and 3004 NUV+FUV detections).
2.4 GALEX Photometry
In contrast to observations of relatively bright objects in the local Universe (e.g., nearby resolved galaxies, stars, etc.) where the photometric errors are usually small, photometric uncertainties of relatively faint objects such as quasars in flux limited surveys are no longer negligible and can largely determine the confidence of the interpretation of the overall photometric properties of a sample. UV observations are more sensitive to line of sight extinction than optical observations; thus quasars (being fainter and at higher redshifts) are not as readily detected in the UV, despite emitting a significant fraction of their bolometric luminosity in the UV region. For the ones that are found in the UV, the photometric uncertainties can become comparable to the detected flux itself, and one must therefore know the distribution of errors well before forming conclusions (e.g., the resulting UV colors and SEDs of optically-selected quasars) in the context of the rest-frame emission.
The GR1 UV source extractor of the GALEX image processing pipeline quotes photometric uncertainties for each object by assuming the observations are Poisson noise limited (based on the number of detected photons). Therefore, the magnitude errors given in the GR1 object tables do not take into account additional sources of noise — including unknown variances of the detector background level and flat-field maps, or any other systematic errors present in the data. If one assumes the bulk of the stars observed in a GALEX field are non-variable, then fields with multi-epoch observations are a useful tool for analyzing the repeatability of the GALEX UV photometry for the same objects, and one can use large numbers of objects to empirically estimate the true photometric uncertainties. In §3, we incorporate the results of using this method (described below) into our analysis of the UV colors of the quasars in our sample.
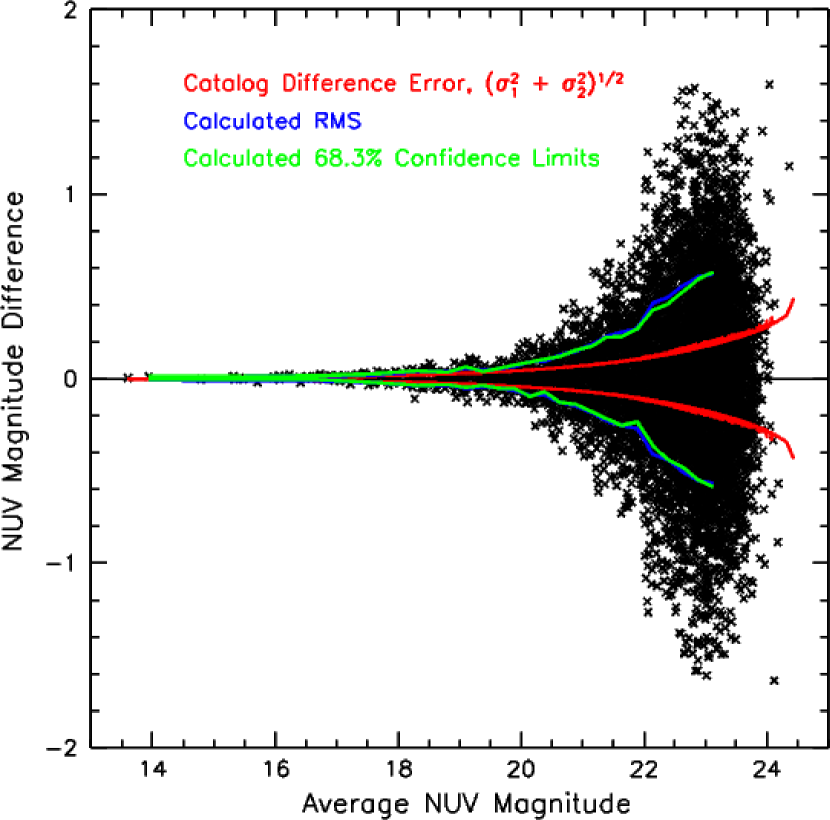
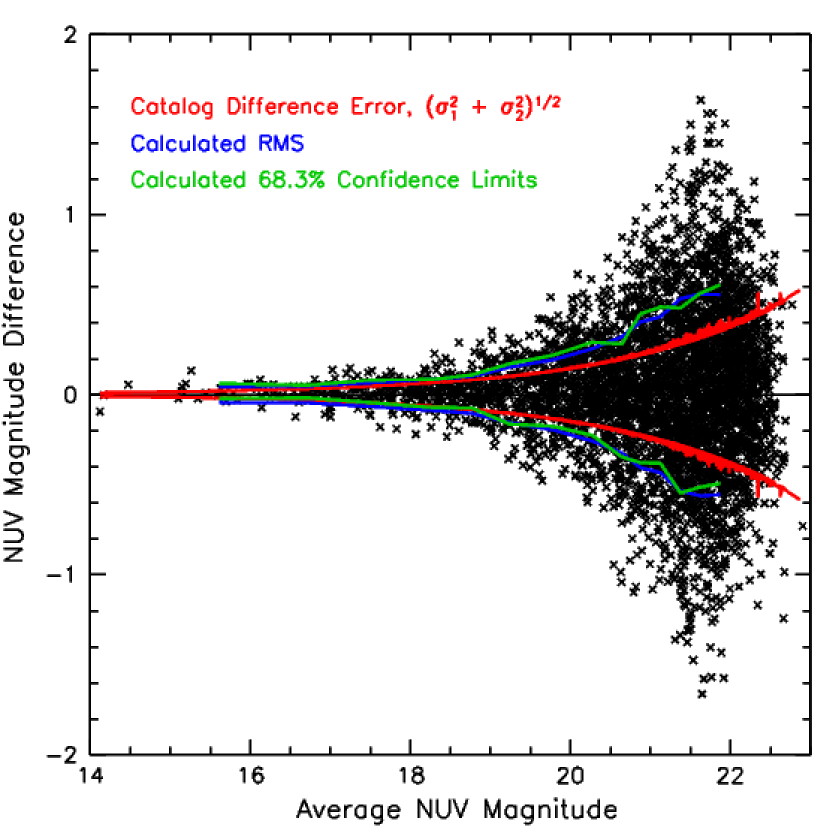
Using multi-epoch GALEX tiles from the Spitzer First Look Survey area with similar exposure times taken from the Deep Imaging Survey, we matched 7090 NUV detections using a search radius of 7″ ( FWHM in the NUV band) and restricted the matching out to 95% of the tile radius, thus minimizing the contamination by image artifacts and multiple source extractions of diffuse out-of-field bright stars that can dominate the sources near the edge of the fields. After removing matches with magnitude differences from the median of each magnitude bin, 6965 (98.2%) objects remain. Figure 2 shows the NUV magnitude differences (NUV) as a function of NUV magnitude, with the red curves showing the errors given in the GR1 tables after adding the errors in quadrature for each epoch (and reflected about NUV = 0). The green and blue curves are the rms and 68.3% confidence limits respectively, which were calculated in NUV magnitude bins. There is good agreement between the rms and confidence limits, indicating that the errors in the NUV photometry are approximately Gaussian distributed at the locations of each magnitude bin. A similar analysis was also performed for repeated FUV observations, as well as for both the NUV and FUV bands in the All-Sky Imaging Survey (e.g., Figure 3).
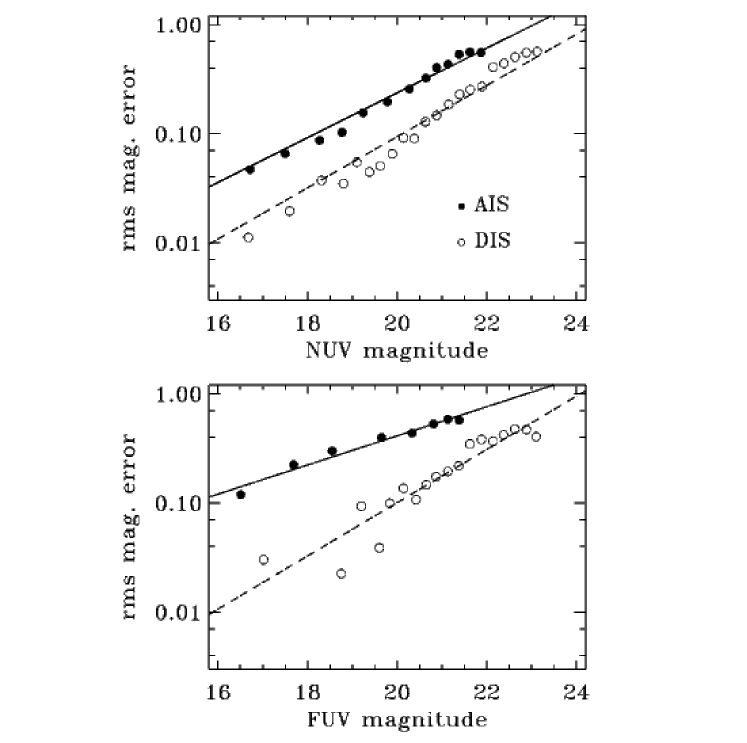
Figure 4 shows the least-squares fits to the binned NUV and FUV magnitude rms as a function of magnitude. Open and closed symbols are calculated from the DIS and AIS results, respectively, as discussed above. Due to the mean exposure time for an AIS tile being roughly an order of magnitude lower than that for a DIS tile, the AIS empirical error best-fit curves lie above those for the DIS due to lower S/N. The qualitatively larger error and fewer bins in the FUV results from the lower density of FUV sources on the sky above the threshold flux and the lower sensitivity of the FUV band relative to the NUV band. Figure 5 shows the distribution of effective exposure times for all of the quasar matches in both UV bands. Given the bimodal distribution, we divide the sample at an effective NUV exposure time of log — for our empirical estimates of the true photometric uncertainty, we employ the AIS curves for detections with log and the DIS curves for log (see Figure 4). If we define and to be the slope and y-intercept of the overplotted curves respectively, then the empirical photometric error () is given by
| (1) |
where is the quasar NUV/FUV magnitude. Table 1 gives our best-fit values for and , which we have used to determine the empirical photometric errors given in our table of matching data (§2.5).
From the number of repeated NUV detections across multiple epochs for a DIS field, we estimate an % probability that a quasar from the SDSS DR3 will have have a false match in the NUV band for a search radius of 7″, while this drops to 1% if the search radius is limited to 2.6″ — this justifies the selection process discussed previously in §2.3. In addition, we extend this contamination rate to the entire quasar sample, given that these calculations are based on the deepest GALEX fields with the highest density of UV sources. The results of the empirical analysis of the GALEX NUV and FUV photometry clearly show the true photometric error rises above the Poissonian errors quoted in the GR1 tables (e.g., Figure 2), where for the NUV band quasar detections (median ), the photometric errors (assuming the stars to be non-variable) are already in excess of % — further justifying this analysis as necessary for constraining the behavior of the quasar UV colors with redshift, the relative colors (§3.3), and the UV/optical SEDs (§3.4).
2.5 Data Table
Our database (see Table 2) of GALEX GR1 matches to SDSS DR3 quasars contains all of the parameters listed in Table 3 (and described below) for each of the 6371 SDSS DR3 quasars covered by GR1 tiles. Each entry consists of selected parameters from both the GR1 catalogs and the SDSS DR3 quasar catalog, as well as our measured quantities. Full versions of the GALEX GR1 tables are publicly available at http://galex.stsci.edu/GR1/ and the DR3 quasar catalog is available via the SDSS public website at http://www.sdss.org. Of the 6371 quasars in the table, 5380 (84.4%) are NUV detections and 3034 (47.6%) are NUV+FUV detections, found by matching coordinates and before any quality cuts are made (see §2.3). The table also includes 38 (0.6%) FUV only detections — these objects are likely contamination by false matches (a mean separation of ″) and we therefore do not refer to them as ‘detections’ for the purposes of our analysis.
For the DR3 sample quasars without an NUV and/or FUV source within 7″, the entries in columns 33 - 34 are the NUV and/or FUV taken from the tile that covered the quasar — the GR1 tables do not give upper limits in magnitudes. In principle, the relative would be the only parameter necessary to calculate upper limits for a given tile, but the non-uniform response of the GALEX detectors as well as changing UV background levels would necessitate calculating upper limits on a tile-by-tile basis. Future GALEX data releases may enable a more straightforward calculation of upper limits for each optically-selected quasar without a UV detection.
Description of the table parameters:
1. The SDSS DR3 object designation from the quasar catalog in the format SDSSJhhmmss.ss+ddmmss.s, where ‘SDSSJ’ is omitted.
2. The GALEX GR1 object designation from the merged object catalog. The same object identified on multiple GALEX tiles can have more than one object id. Thus, one should always use object coordinates and not object designations to identify individual objects as such. DR3 quasars without a UV detection (see §2.3) will have a ‘-999’ entry.
3-4. The object coordinates (right ascension and declination; J2000.0) from the SDSS DR3 quasar catalog, given in decimal degrees. For a significant majority of the objects, the SDSS astrometric accuracy of each coordinate is 01, with the largest errors expected not to exceed 02 (see Pier et al., 2003).
5-6. The object coordinates (right ascension and declination; J2000.0) from the GALEX GR1 merged object catalogs, given in decimal degrees. Our empirical analysis of §2.3 demonstrates the derived rms of 06 - 07 for each GALEX coordinate. DR3 quasars without any UV detection will have a ‘-999’ entry for both coordinates.
7. The coordinate offsets between the GALEX and SDSS positions (GALEX - SDSS), given in arcseconds. Objects with separations 7″ or non-detections have a ‘-999’ entry
8. The quasar redshifts from the DR3. For any given object, the estimated redshift uncertainty is , except for Broad Absorption Line (BAL) quasars (e.g., Trump et al., 2006).
9-18. The DR3 PSF magnitudes and errors for all of the quasars (no Galactic extinction corrections applied), given in AB-magnitudes from the five SDSS photometric (u, g, r, i, and z) bands. The magnitudes are those derived from BEST photometry (or TARGET if BEST is unavailable; see Schneider et al. (2005) and references therein).
19-24. The GALEX PSF magnitudes and errors (both as quoted in the GR1 object catalogs and from our empirical analysis of the photometry), in units of AB-magnitude from both UV photometric bands. The effective wavelengths of the FUV and NUV channels are 1528 Å and 2271 Å, respectively (Morrissey et al., 2005).
25. The Galactic extinction in the SDSS-u band () derived from Schlegel et al. (1998). The extinction in the remaining SDSS bands can be expressed as and with values corresponding to 0.736, 0.534, 0.405, and 0.287 times . For the GALEX and bands, the corrections and are 1.584 and 1.684 times , respectively (Wyder et al., 2005). All correction factors assume an absorbing medium.
26. Log represents the logarithm of the neutral Hydrogen column density along our Galactic line of sight to each quasar, interpolated via 21 cm data (also see Schneider et al. (2005) and references therein).
27. The absolute i-band magnitude — calculated after correcting for Galactic extinction and assuming a power-law continuum index of (), and a -dominated flat cosmology with and H0 = 70 km s-1 Mpc-1 (same for this paper).
28. The logarithmic monochromatic quasar luminosity (Lν) computed at 2200 Å (rest-frame). A ‘-999’ entry is given if there is no wavelength coverage.
29. The same as column 28, but for 5100 Å — only computed for the quasars where 5100 Å has not been redshifted out of the SDSS- band. A ‘-999’ entry is given if there is no wavelength coverage.
30-31. The and relative colors (§3.3), defined as the and colors minus the corresponding median colors at the redshift of the quasar, given in units of AB-magnitude.
32. Object distance from GALEX field center in decimal degrees. Note that for the case of objects with multi-epoch observations across multiple GALEX fields, the entry from the tile with the highest effective NUV exposure time (‘NUV_WEIGHT’ in the GR1 catalog) is used (see §2.3).
33. The GALEX NUV effective exposure time in seconds. The non-detections have a ‘-999’ entry. For the 991 DR3 quasars covered by a GALEX tile for which no NUV source was found within 7″ (a ‘-999’ entry for columns 22-24), the NUV effective exposure time for the next nearest near-UV source to the DR3 quasar is given in seconds.
34. The GALEX FUV effective exposure time in seconds. The non-detections have a ‘-999’ entry. Of the 3072 FUV detections, 38 are only detected in the FUV (a ‘-999’ entry for columns 19-21), and are not analyzed as true matches in this study (see the discussion in §2.3).
35. The GALEX survey flag. The possible values are integers from 1-4 that specify the survey from which the UV identification of the SDSS quasar was drawn (4 = AIS, 3 = NGS, 2 = MIS, and 1 = DIS; also see §2.1 for the data/survey descriptions).
3 ANALYSIS
3.1 Matching Statistics
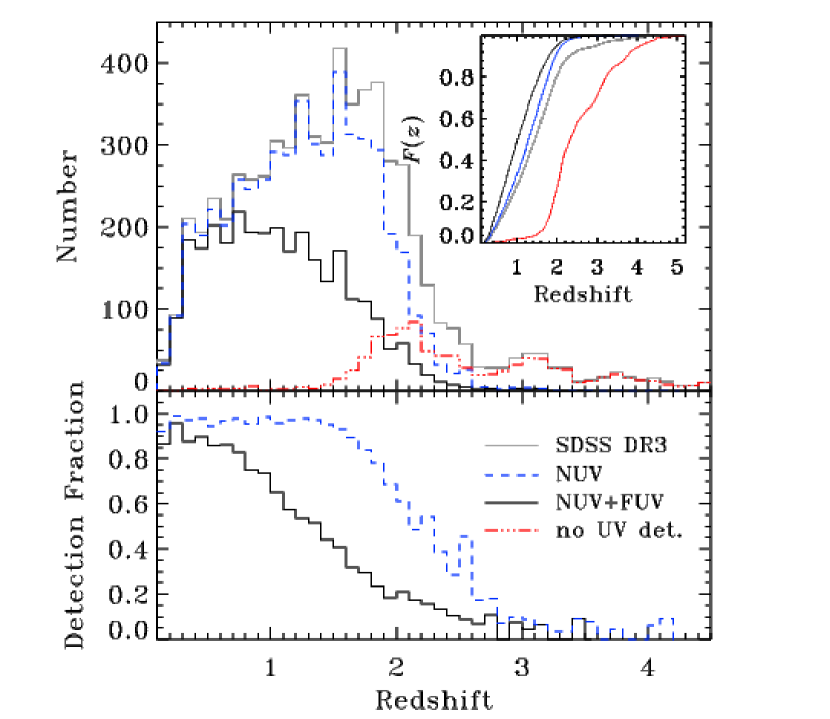
Both intrinsic differences among quasars (e.g., due to reddening by dust within the host galaxy) and observational effects (e.g., the Ly forest entering the FUV band at and the NUV band at ) will affect the detection probability in UV observations. The top panel of Figure 6 illustrates the redshift distribution of the DR3 sample (gray line), the NUV detections (blue dashed-line), the NUV+FUV (black solid-line) detections, and the non-detections (red line), using redshift bins of width . In the DR3 sample, the local minima seen at redshifts correspond to where the SDSS star-quasar separation is less efficient ( and ), also where quasars cross into the stellar locus in multi-dimensional color-color space (Richards et al., 2002). The bottom panel shows the respective fraction of DR3 quasars detected for the same distributions using the same color scheme. The NUV+FUV detection fraction begins to noticeably decrease as soon as Ly leaves the FUV band (). Note that in the NUV band, we recover nearly all of the DR3 quasars until (also where the Ly forest is extinguishing flux in the entire GALEX bandpass), with the detection fraction dropping to 50% by . The resulting UV/optical colors from these matches are discussed in §3.2.
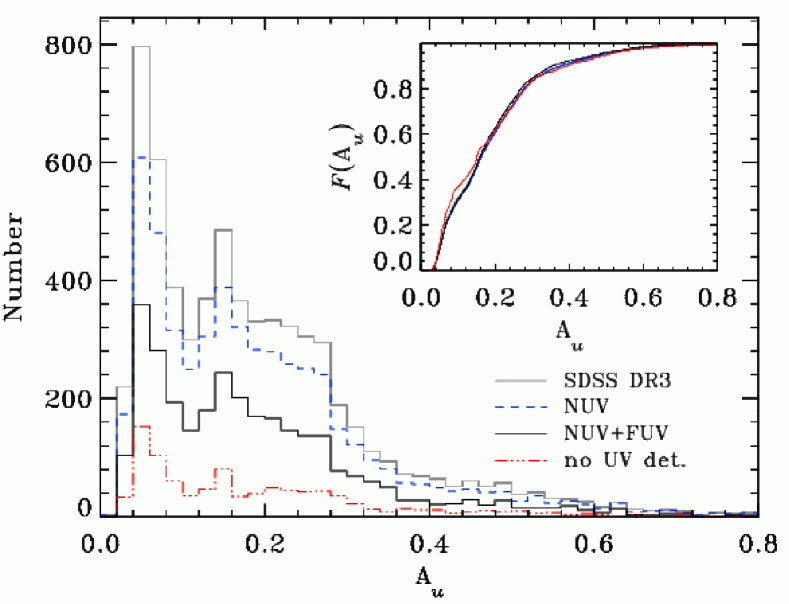
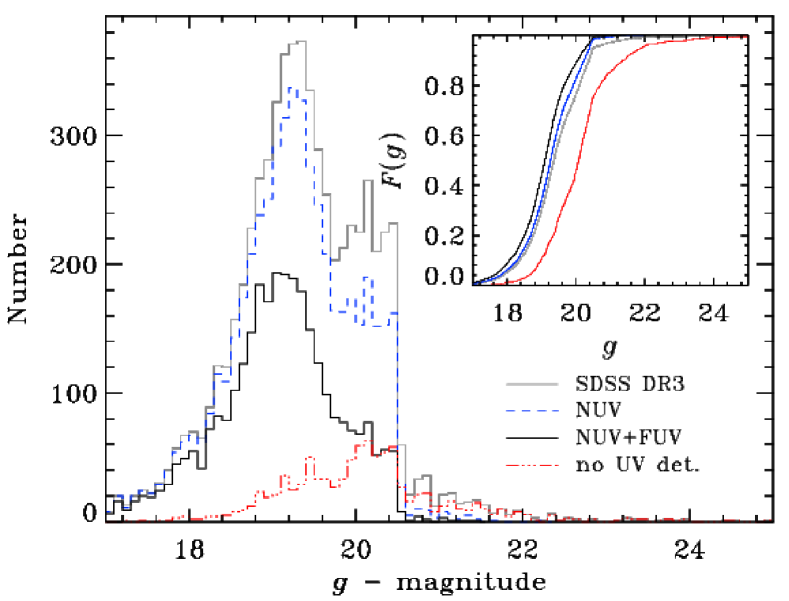
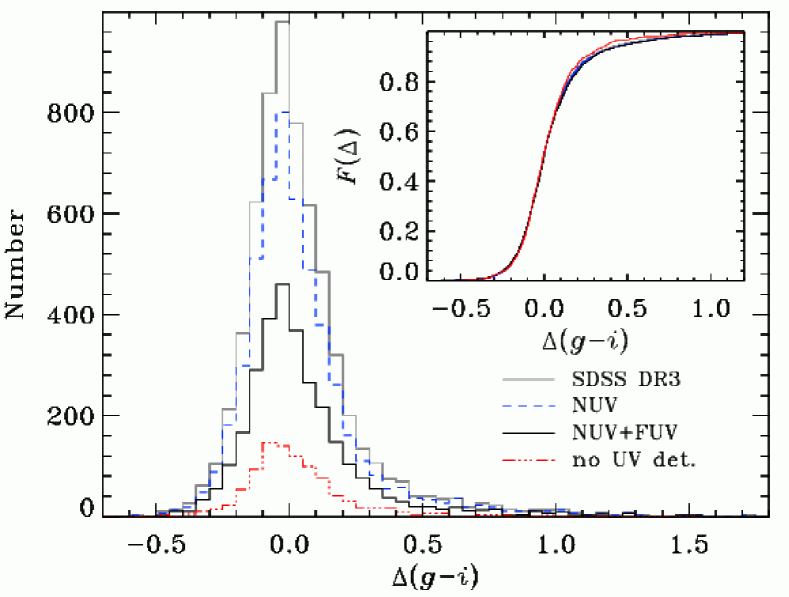
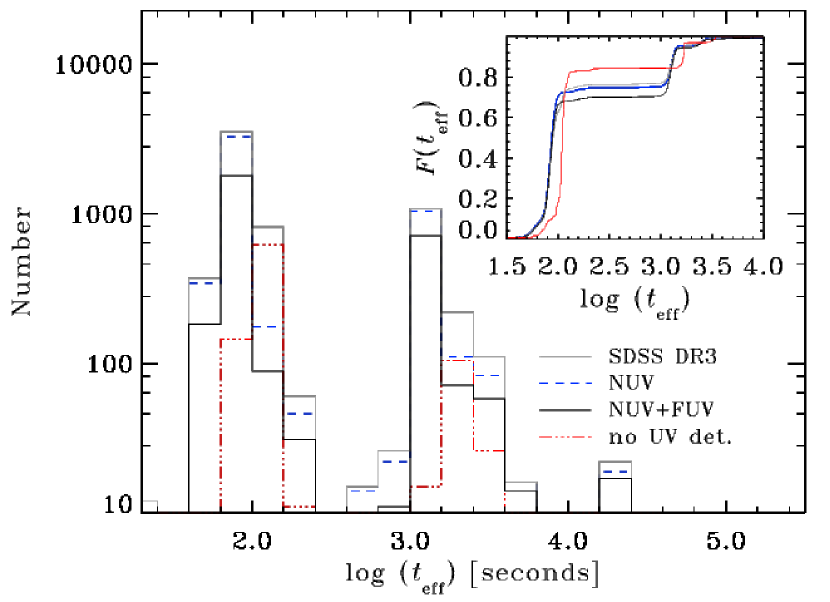
For our statistical tests of the matching results, we analyzed the UV detections and non-detections by dividing our dataset into four subsamples: (1) the parent sample of DR3 quasars, (2) those with an NUV detection, (3) those with an NUV+FUV detection, and (4) those with no UV detection. The FUV-only detections were not analyzed as a separate subsample (see discussion in §2.3). Figures 6 - 10 display the distributions of each as functions of redshift, Galactic extinction in the band (), -magnitude, relative optical color , as well as NUV effective exposure time . The inset of each histogram plot also displays the cumulative distribution functions for each parameter. Table 4 summarizes the results of performing the two-sided Kolmogrov-Smirnov (KS) test on each subsample relative to the parent DR3 quasar sample. The results of the KS tests indicate that brightness (-magnitude) and redshift are the primary explanations for non-detections in the UV. Gas and dust along our line of sight preferentially attenuates the flux most strongly in the UV bands, which is consistent with the KS test results that show Galactic extinction () is likely contributing to the lower number of detections in the FUV band. Although the KS statistics would suggest as another explanation for the non-detections, an inspection of Figure 10 reveals the subsample of non-detections appears to be more heavily weighted toward larger , which is in the opposite sense of what one would expect for the quasars with no UV detection.
3.2 Color-Color Relations
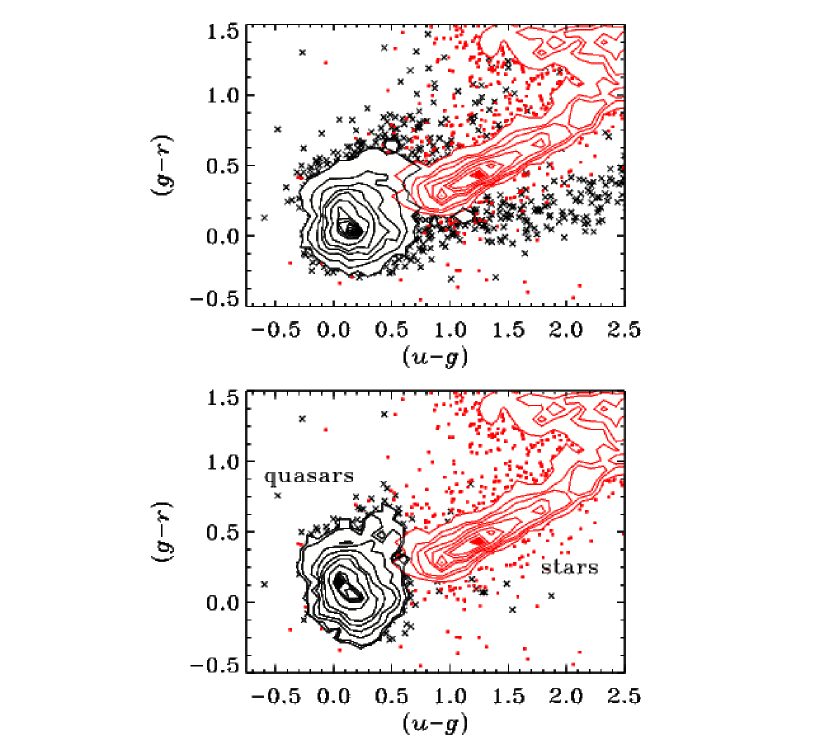
Using photometry from the DR3 quasar catalog and the GALEX object catalogs, we constructed the color-color diagrams in Figures 11 and 12. The top panel of Figure 11 shows the locations of SDSS stars (red points and contours) and the quasar sample (black points and contours) in vs. color-color space. The bottom panel of Figure 11 shows only the 3004 quasars with detections in both UV bands that comprise the clean sample, along with the same set of SDSS stars. Nearly all of the optically red quasars with are not detected in both UV bands. Note that the colors of the DR3 quasars with UV detections are uniformly distributed within the same region that the quasar locus in the top panel occupies, indicating no strong optical bias in our detections.
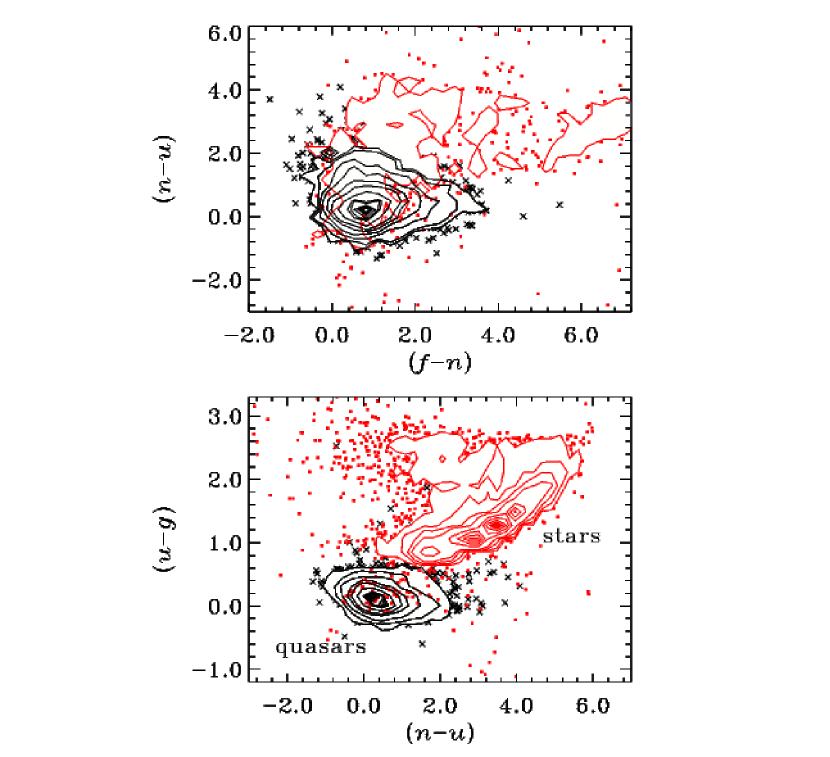
Using the same color scheme as Figure 11, Figure 12 shows the UV/optical colors of the quasars detected in both UV bands, along with GALEX stars from selected DIS fields, which we matched to the SDSS database. Since nearly all of the DIS fields covering SDSS quasars are centered on the high galactic latitude sky, the density of stars on the sky is relatively low (especially in the FUV) and most of the FUV detections are near the flux limit. Since far fewer quasars have FUV detections and the scatter in the UV photometry is large, the regions of () vs. () color-color space occupied by stars and quasars are not as well defined. For the bottom panel of Figure 12, the NUV quasar detections were used to construct the vs. colors.
The density of stars in the NUV for a given location on the sky is higher than the corresponding density in the FUV by about an order of magnitude, and thus we were able to match more GALEX stars to the SDSS database. The star-quasar separation in vs. color-color space indicates that the inclusion of UV colors can aid in the color selection of quasars using UV/optical photometry. In addition, the loci of points are consistent with reddening along the line of sight through the intergalactic medium — that is to say the bulk of the matches do not have “blue” colors in the UV while having “red” colors for the optical bands.
3.3 Color-Redshift Relations
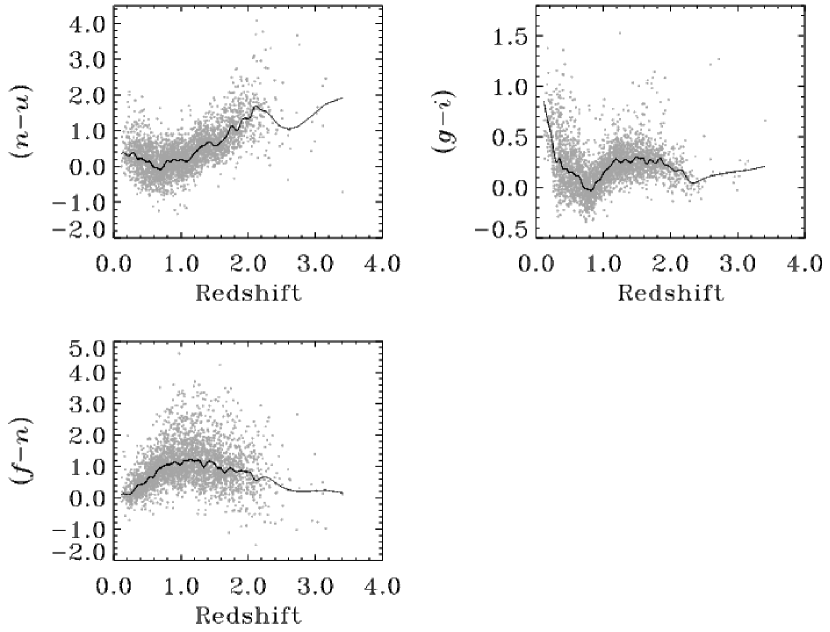
The observed structure of the quasar colors with redshift is quite complex — in addition to intergalactic reddening of the continuum, there are strong emission lines (e.g., Balmer recombination lines, Mg II, CIV, and Ly ), and there is the SBB ( Å) due mostly to Balmer continuum and Fe II complex emission. Figure 13 shows the color-redshift relations for the UV/optical colors , , and colors (all magnitudes corrected for Galactic extinction). After binning the quasars by redshift, we have used a cubic spline fit to interpolate and subtract the median color at each redshift to obtain the relative colors. Broad emission and/or absorption lines will affect the quasar colors as they pass through the photometric bands, and are primarily responsible for the observed color-redshift relations. For example, in the top-left panel of Figure 13 the Ly emission line has entered the NUV band by and exits at , after which the Ly forest continues to redden the UV/optical color with increasing redshift. Quasars that display broad absorption lines in their spectra (BALQSOs) can have colors that are either redder or bluer, depending on the location of absorption troughs relative to the photometric filter bandpasses, and Reichard et al. (2003) showed that the overall flux deficit due to reddening dominates over the extinction due to the absorption troughs themselves.
We select the distributions of the relative and relative colors (hereafter () and (), respectively) shown in Figure 14 for further analysis. The solid curves are the least- Gaussian fits to the blue side and peak of each histogram. Richards et al. (2003) and Hopkins et al. (2004) have shown that the red tail on the () distribution is not produced by errors in the SDSS photometry, but is rather a true indicator of reddening by dust along our line of sight at the redshift of the quasar. The reddest quasars may not be detected in the NUV or FUV, and therefore would not contribute to the observed relative color distribution in Figure 14. However, the KS-test (§3) seems to show that there is no significant bias with respect to ().
The dashed curve on the top panel of Figure 14 is the result from Monte Carlo simulations ( runs) of () using a Gaussian distribution of photometric errors that use the empirical UV magnitude-rms relations as determined in §2.4. Each best-fit Gaussian has , which is more than a factor of 2 larger than if the errors quoted in the GR1 tables are used. The blue and red curves in the top panel of Figure 14 indicate the dispersion in () is dominated by photometric uncertainties, and that it is not purely the result of intrinsic differences in the UV quasar SEDs. However, the red tail of the () distribution () suggests a marginally detected population of quasars heavily reddened in the UV, which is also supported by a red tail observed in the () distribution.
In terms of -magnitude, , and redshift, the quasars with both red () and () colors are statistically indistinguishable from those with bluer relative colors (see Figure 15). From computing the Spearman Rank-Order correlation coefficients, the significance level () indicates that it is unlikely the relative colors are correlated (or anticorrelated) in any way. The quasars with red UV colors in our detections could be the result of intrinsically redder SEDs, the Ly forest, or due to the presence of emission or absorption lines in one of the bands that can produce quasar colors that are redder than the bulk of the quasars at that redshift. Therefore, while the use of UV colors may aid in the selection of dust-reddened quasars, it will also select normal (but perhaps optically steep) quasars (see Richards et al., 2003, and references therein).
3.4 SEDs
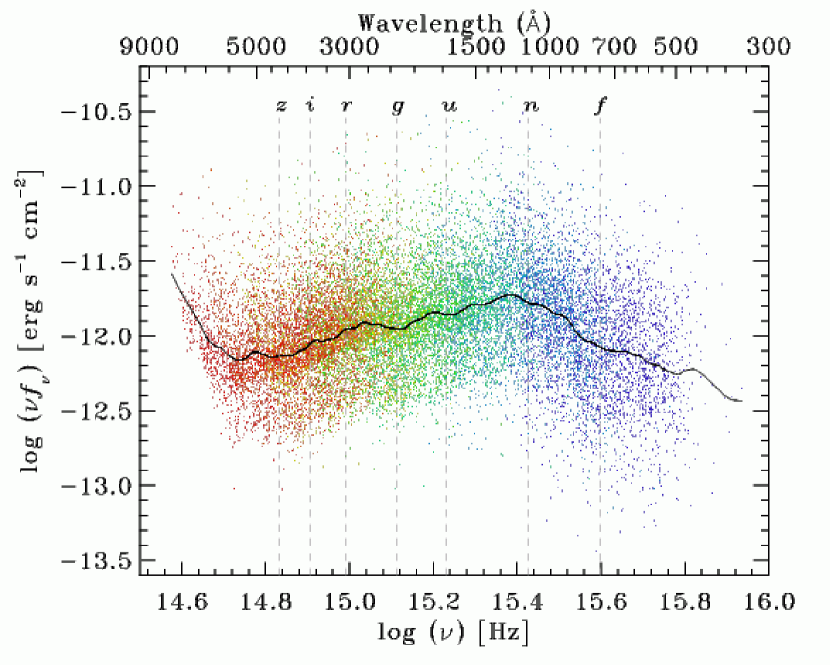
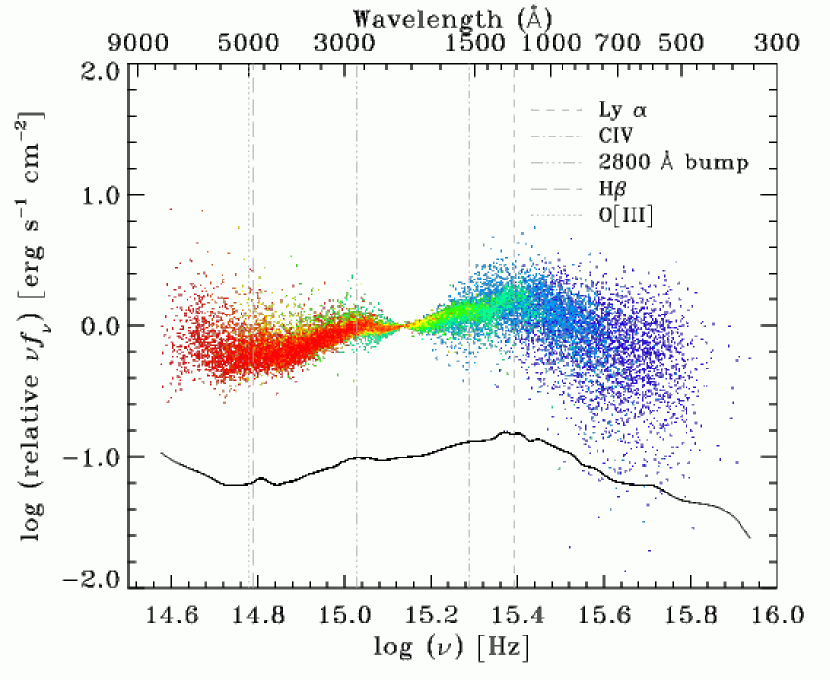
After applying Galactic extinction corrections to the UV/optical photometry and de-redshifting the effective frequency of each filter, we constructed the rest-frame SEDs shown in Figure 16. The bluest points are the FUV photometry, with the reddest points representing the reddest optical band (the SDSS- filter). The black line is the median smoothed SED for all of the detections, and the vertical dashed lines show the effective frequencies of each photometric band, after de-redshifting using the median redshift of all of the detections (). Figure 17 shows the result after each individual SED was normalized to its own flux at 2200 Å by linear interpolation in log vs. log space. A cubic spline interpolated median SED is the curve shown below the colored points, shifted downward 1 dex in logarithmic relative flux for clarity. The signatures of various canonical features known to be present in quasar composite spectra (such as that of Vanden Berk et al. (2001)) are visible, denoted by reference lines given for the locations of Ly , C IV , the 2800 Å bump (Fe II complex, Mg II, and Balmer continuum emission), H , and O [III] .
In addition to observational effects (e.g., line-of-sight absorption), measurement uncertainties, and any intrinsic differences in the quasar emission, variability also plays a role in the variety of SEDs present in Figure 17. The anticorrelations between the variability amplitude and wavelength, as well as luminosity (see Vanden Berk et al., 2004, and references therein) render UV observations more sensitive to changes in emergent flux levels. Variability can therefore not only displace quasars from their true locations in multidimensional color-color space, but also increases the dispersion of the SEDs in our sample. In principle, foreground absorption systems can exclude a significant fraction of the quasar population from flux-limited surveys such as the SDSS due to attenuation in the rest-frame UV. However, Akerman et al. (2005) found no direct evidence for this effect (c.f. York et al., 2006). The scatter in Figure 17 extending toward larger relative flux at longer wavelengths is primarily due to the increasing contribution of the host-galaxy to the optical flux for the lower redshift quasars, which dominate the SED near the long wavelength limits of our composite SED. The peak flux of the SED occurs near Å or so, before the Ly forest begins to significantly extinguish the detected UV flux (Ly has been redshifted beyond the NUV band by ). The rest-frame wavelength coverage of the UV/optical SEDs extends shortward to Å for the highest redshift detection at and longward to Å for the lowest redshift detection at . Table 5 illustrates the format and content of our overall SED that accompanies the electronic edition of the journal.
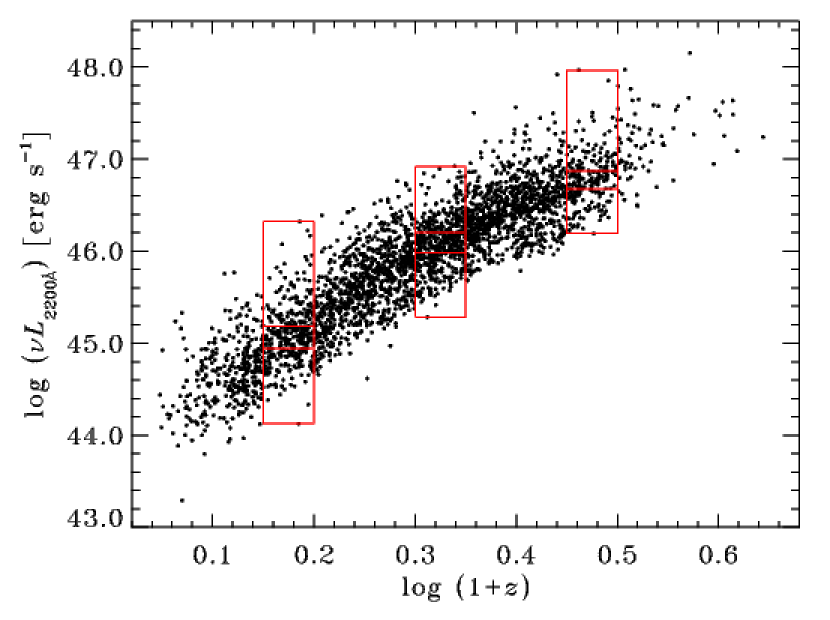
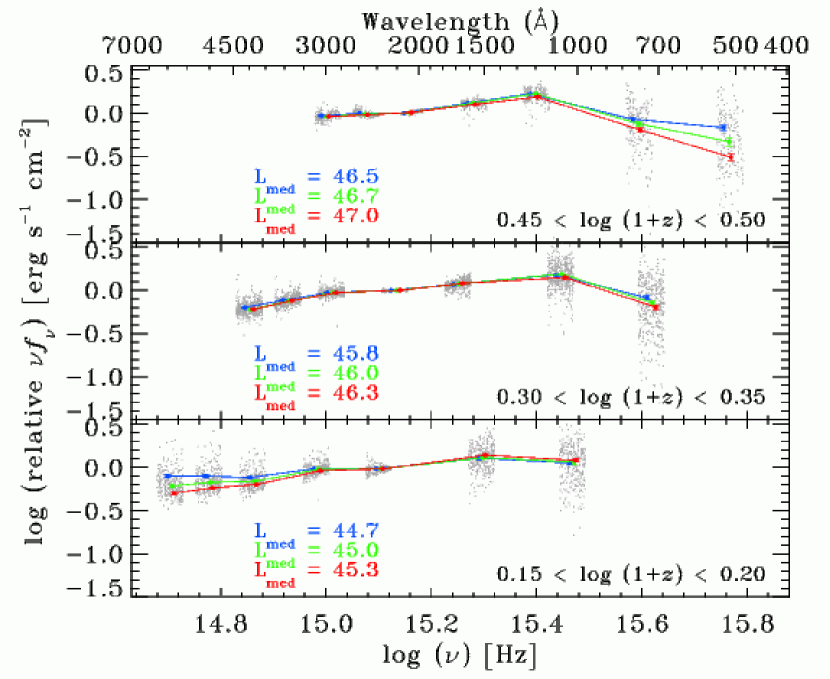
In order to constrain our understanding of the UV spectral slope, as well as its redshift and luminosity dependence, one must take into account various observational effects. A significant fraction of the quasar luminosity comes from broad emission lines, and Lyman absorption along our line of sight can significantly alter the quasar colors (especially beyond z 1). In addition, there is an artificial correlation between quasar redshift and luminosity (e.g., Figure 18), and Lyman absorption strongly attenuates the SEDs. The analysis of any luminosity-dependence of the SEDs requires the sample to have a large range in luminosity (and therefore redshift), and small redshift windows allow for study of the luminosity-dependence as a function of wavelength. In order to remove the effects of the emission lines, Lyman absorption and to account for the correlation, we divide our UV detections with redshifts into three redshift bins: (1) log (2) log and (3) log (see the highlighted regions of the distribution in Figure 18). We then computed median SEDs by binning the quasars in each redshift bin by their 2200 Å luminosity. The resulting median UV/optical SEDs are shown in Figure 19. The three panels each correspond to the redshift range indicated; the blue, red, and green points and lines represent different luminosity bins — the median monochromatic luminosity at 2200 Å for the quasars in each bin (denoted by ) is given in units of log () and the error bars on each median SED are the 1 rms (the standard deviation normalized by , where is the number of objects) calculated for all objects in each bin (gray points). For several points, the errors in the median are smaller than the plotting symbols.
The weak anticorrelation between the UV power-law spectral slope () and the quasar luminosity for the lowest redshift bin (bottom panel of Figure 19) is primarily due to contamination by the host-galaxy, as the lower luminosity quasars are preferentially at lower redshifts where the host-galaxy contribution can be comparable to the nuclear emission. A discussion of the relationship between the AGN and host-galaxy fluxes of SDSS broad-line active galaxies is given by Vanden Berk et al. (2006). Our results also reveal a significant anticorrelation between and luminosity for our highest redshift bin (top panel of Figure 19) covering the shortest rest-frame wavelengths, in the sense that the higher luminosity quasars have a steeper UV SED. In terms of the relative FUV flux for each median SED in the highest redshift bin, the lowest luminosity () UV continuum level is 37% higher (5.2) than for the most luminous () median SED.
The observed luminosity-dependence of the UV SED shape at the shortest wavelengths is consistent with idea that the Baldwin Effect (hereafter BE; Baldwin, 1977) may be due to intrinsic differences in the strength of the ionizing continuum (see Osmer & Shields, 1999, for a review). Other studies have also drawn similar conclusions, while also taking into account the importance of metallicity in determining the emission line strengths as functions of the SED shape (e.g., Korista et al., 1998). For the higher luminosity quasars (having apparently redder SEDs), fewer incident UV photons are available to photoionize the broad-line gas and will result in lower emission line equivalent widths. Except for the strong luminosity-dependence of our SEDs at the shortest wavelengths, and the host-galaxy contributions seen at the longest wavelengths, the median SEDs within each redshift bin are largely indistinguishable.
4 DISCUSSION AND CONCLUSIONS
We have presented the results of GALEX GR1 UV matches to optically-selected quasars in the SDSS DR3 quasar catalog. In the final clean sample, 81.1% of the DR3 quasars have an NUV detection, while 47.2% have a detection in both the NUV and FUV bands. An analysis of the subsamples of the detections and non-detections indicates that the non-detections tend to be optically faint objects or at high redshift. The accuracy of the SDSS astrometry has allowed us to obtain a rigorous estimate of the accuracy of GALEX positions — showing them to be accurate to 0.6-0.7″. We have also carried out an empirical analysis of the GALEX UV photometry using multi-epoch tiles from the Deep Imaging and All-Sky Imaging Surveys that shows the true photometric errors are a factor of larger than those given in the GR1 object tables. The distributions of UV/optical colors of the quasar matches indicate that the inclusion of UV/optical colors can aid in the color selection of quasars, but also that large uncertainties in the GALEX UV photometry prevents the use of UV colors alone to separate stars from quasars. In addition to other observational effects (e.g., Lyman absorption), extinction within our own Galaxy is likely causing some of the optically-selected quasars to be missed by GALEX, especially in the FUV band. Although the observed width of the relative UV color distribution is dominated by photometric error, the red tail suggests a marginally detected population of reddened quasars — either due to intervening absorption systems or due to dust at the quasar redshift.
In order to investigate a possible luminosity-dependence of the shape of the UV quasar continuum, we have constructed rest-frame SEDs for 3004 quasars — for which we can also make comparisons to theoretical models. For example, Hubeny et al. (2000) have used non-LTE accretion disk models to predict the emergent SEDs, and their results predict both a change in the slope of the power-law continuum in the vicinity of Ly and a steepening of the continuum with increasing quasar luminosity (for fixed values of ). To properly account for the correlation between redshift and luminosity, we have analyzed our SEDs in independent redshift and luminosity bins. Our results show an anticorrelation between and the quasar luminosity at the shortest wavelengths at the 5.2 level, which appears to be consistent with the idea that the BE may be due to intrinsic differences in the strength of the ionizing continuum. The Scott et al. (2004) results show a harder UV continuum in their FUSE composite relative to the HST composites of Zheng et al. (1997) and Telfer et al. (2002), which display a break in the spectral index near Å. Scott et al. (2004) note that their sample of AGN has a median luminosity that is nearly an order of magnitude lower than the sample of Telfer et al. (2002). The anticorrelation we find in the UV between and luminosity is qualitatively consistent with the idea that the FUSE composite having a significantly harder spectral index () than the HST composite (), is due to the lower median luminosity of the FUSE sample.
Despite the range of spanned by our sample, our findings are also in good qualitative agreement with the model predictions of Hubeny et al. (2000). Our observed luminosity-dependent UV SED shape is also consistent with the results of Shang et al. (2005) making use of both FUSE and HST spectra, who report a softer FUV spectral index for the higher luminosity AGNs in their sample. However, Shang et al. (2005) also note that most of their objects display a spectral break near 1100 Å, which is in rough agreement with previous work using HST composite spectra (e.g., Telfer et al., 2002). Therefore, although the Shang et al. (2005) results seem to confirm the change in the continuum slope near Ly predicted by Hubeny et al. (2000), it remains unclear as to whether or not the location of any UV spectral break is a function of luminosity.
Some work has suggested that the shape of the ionizing continuum may be correlated with metallicity, or that it may be the result of luminosity-dependent spectral variations (e.g. Dietrich et al., 2003). Differences in the Lyman absorption along different sightlines are unlikely to cause the luminosity-dependence we see, since the composite SEDs are averaged over a large number of objects at nearly equal redshifts. Our study has not taken into account the presence of intervening absorption systems (e.g., York et al., 2006). The GALEX photometric bands are wide, covering a significant range of Lyman absorption — a rigorous treatment of corrections that take into account absorption by the Ly forest, Lyman limit systems (LLSs), and damped Ly absorbers (DLAs) is beyond the scope of this paper. However, our large sample size has permitted detailed study of the UV/optical regime without being highly sensitive to intervening galaxy absorbers or lines of sight that intersect LLSs and/or DLAs. Future SDSS and GALEX data releases will permit the construction of even larger UV/optical samples of quasars. In addition, the larger data volume and the anticipated improvements in the photometric calibration of GALEX data released in GR2 should increase the number of UV detections of SDSS quasars, as well as aid the future studies that make use of UV/optical colors in the color selection of quasars.
References
- Abazajian et al. (2005) Abazajian, K., et al. 2005, AJ, 129, 1755
- Agüeros et al. (2005) Agüeros, M. A., et al. 2005, AJ, 130, 1022
- Akerman et al. (2005) Akerman, C. J., Ellison, S. L., Pettini, M., & Steidel, C. C. 2005, A&A, 440, 499
- Baldwin (1977) Baldwin, J. A. 1977, ApJ, 214, 679
- Becker et al. (1995) Becker, R. H., White, R. L., & Helfand, D. J. 1995, ApJ, 450, 559
- Bianchi et al. (2005) Bianchi, L., et al. 2005, ApJ, 619, L27
- Brotherton et al. (2001) Brotherton, M. S., Tran, H. D., Becker, R. H., Gregg, M. D., Laurent-Muehleisen, S. A., & White, R. L. 2001, ApJ, 546, 775
- Dietrich et al. (2003) Dietrich, M., Hamann, F., Shields, J. C., Constantin, A., Heidt, J., Jäger, K., Vestergaard, M., & Wagner, S. J. 2003, ApJ, 589, 722
- Francis et al. (1991) Francis, P. J., Hewett, P. C., Foltz, C. B., Chaffee, F. H., Weymann, R. J., & Morris, S. L. 1991, ApJ, 373, 465
- Frank et al. (2002) Frank, J., King, A., & Raine, D. J. 2002, Accretion Power in Astrophysics, by Juhan Frank and Andrew King and Derek Raine, pp. 398. ISBN 0521620538. Cambridge, UK: Cambridge University Press, February 2002.
- Fukugita et al. (1996) Fukugita, M., Ichikawa, T., Gunn, J. E., Doi, M., Shimasaku, K., & Schneider, D. P. 1996, AJ, 111, 1748
- Grandi (1981) Grandi, S. A. 1981, ApJ, 251, 451
- Gunn et al. (1998) Gunn, J. E., et al. 1998, AJ, 116, 3040
- Gunn et al. (2006) Gunn, J. E., et al. 2006, AJ, 131, 2332
- Hopkins et al. (2004) Hopkins, P. F., et al. 2004, AJ, 128, 1112
- Hubeny et al. (2000) Hubeny, I., Agol, E., Blaes, O., & Krolik, J. H. 2000, ApJ, 533, 710
- Ivezić et al. (2004) Ivezić, Ž., et al. 2004, Astronomische Nachrichten, 325, 583
- Korista et al. (1998) Korista, K., Baldwin, J., & Ferland, G. 1998, ApJ, 507, 24
- Lynds (1971) Lynds, R. 1971, ApJ, 164, L73
- Malkan & Sargent (1982) Malkan, M. A., & Sargent, W. L. W. 1982, ApJ, 254, 22
- Martin et al. (2005) Martin, D. C., et al. 2005, ApJ, 619, L1
- Mathews & Ferland (1987) Mathews, W. G., & Ferland, G. J. 1987, ApJ, 323, 456
- Morrissey et al. (2005) Morrissey, P., et al. 2005, ApJ, 619, L7
- Oke & Gunn (1983) Oke, J. B., & Gunn, J. E. 1983, ApJ, 266, 713
- Osmer & Shields (1999) Osmer, P. S., & Shields, J. C. 1999, ASP Conf. Ser. 162: Quasars and Cosmology, 162, 235
- Pen (1999) Pen, U.-L. 1999, ApJS, 120, 49
- Pier et al. (2003) Pier, J. R., Munn, J. A., Hindsley, R. B., Hennessy, G. S., Kent, S. M., Lupton, R. H., & Ivezić, Ž. 2003, AJ, 125, 1559
- Reichard et al. (2003) Reichard, T. A., et al. 2003, AJ, 126, 2594
- Richards et al. (2001) Richards, G. T., et al. 2001, AJ, 121, 2308
- Richards et al. (2002) Richards, G. T., et al. 2002, AJ, 123, 2945
- Richards et al. (2003) Richards, G. T., et al. 2003, AJ, 126, 1131
- Richards et al. (2006) Richards, G. T., et al. 2006, ArXiv Astrophysics e-prints, arXiv:astro-ph/0601558
- Richards et al. (2006) Richards, G. T., et al. 2006, AJ, 131, 2766
- Sanders et al. (1989) Sanders, D. B., Phinney, E. S., Neugebauer, G., Soifer, B. T., & Matthews, K. 1989, ApJ, 347, 29
- Schlegel et al. (1998) Schlegel, D. J., Finkbeiner, D. P., & Davis, M. 1998, ApJ, 500, 525
- Schneider et al. (2005) Schneider, D. P., et al. 2005, AJ, 130, 367
- Scott et al. (2004) Scott, J. E., Kriss, G. A., Brotherton, M., Green, R. F., Hutchings, J., Shull, J. M., & Zheng, W. 2004, ApJ, 615, 135
- Seibert et al. (2005) Seibert, M., et al. 2005, ApJ, 619, L23
- Shang et al. (2005) Shang, Z., et al. 2005, ApJ, 619, 41
- Shields (1978) Shields, G. A. 1978, Nature, 272, 706
- Smith et al. (2002) Smith, J. A., et al. 2002, AJ, 123, 2121
- Spergel et al. (2006) Spergel, D. N., et al. 2006, ArXiv Astrophysics e-prints, arXiv:astro-ph/0603449
- Telfer et al. (2002) Telfer, R. C., Zheng, W., Kriss, G. A., & Davidsen, A. F. 2002, ApJ, 565, 773
- Trump et al. (2006) Trump, J. R., et al. 2006, ArXiv Astrophysics e-prints, arXiv:astro-ph/0603070
- Vanden Berk et al. (2001) Vanden Berk, D. E., et al. 2001, AJ, 122, 549
- Vanden Berk et al. (2004) Vanden Berk, D. E., et al. 2004, ApJ, 601, 692
- Vanden Berk et al. (2005) Vanden Berk, D. E., et al. 2005, AJ, 129, 2047
- Vanden Berk et al. (2006) Vanden Berk, D. E., et al. 2006, AJ, 131, 84
- Wills et al. (1985) Wills, B. J., Netzer, H., & Wills, D. 1985, ApJ, 288, 94
- Wyder et al. (2005) Wyder, T. K., et al. 2005, ApJ, 619, L15
- York et al. (2000) York, D. G., et al. 2000, AJ, 120, 1579
- York et al. (2006) York, D. G., et al. 2006, MNRAS, 367, 945
- Zheng et al. (1997) Zheng, W., Kriss, G. A., Telfer, R. C., Grimes, J. P., & Davidsen, A. F. 1997, ApJ, 475, 469


| Object (SDSS J) | GALEX Object I.D. | R.A. (SDSS) | Decl. (SDSS) | Coord. Offset (″) | Redshift |
|---|---|---|---|---|---|
| 000009.42102751.9 | 2435007175665396402 | 0.039269 | 10.464428 | 1.62 | 1.8442 |
| 000011.96+000225.3 | 2667127184236220309 | 0.049842 | 0.040372 | 0.44 | 0.4790 |
| 000017.38085123.7 | 2434901622551226166 | 0.072421 | 8.856607 | 1.17 | 1.2499 |
| 000026.29+134604.6 | 2665121679322122922 | 0.109578 | 13.767970 | 0.65 | 0.7678 |
| 000028.82102755.7 | 2435007175666450605 | 0.120086 | 10.465496 | 0.32 | 1.1377 |
Note. — A full version of the above table accompanies the electronic edition of the journal. Table 2 serves as a reference for its final form and content. All object coordinates are given in decimal degrees (J2000.0).
| Column | Data Format | Description |
|---|---|---|
| 1 | A18 | SDSS DR3 Quasar Catalog object designation in hhmmss.ss+ddmmss.s (J2000.0) |
| 2 | A19 | GALEX GR1 merged object catalog designation; -999 indicates no detection |
| 3 | F11.6 | SDSS right ascension in degress (J2000.0) |
| 4 | F11.6 | SDSS declination in degrees (J2000.0) |
| 5 | F11.6 | GALEX right ascension (degrees) |
| 6 | F11.6 | GALEX declination (degrees) |
| 7 | F7.2 | Coordinate offset between GALEX/SDSS positions given in arcseconds |
| 8 | F7.4 | redshift (SDSS) |
| 9 | F7.3 | SDSS magnitude (not corrected for Galactic extinction) |
| 10 | F6.3 | error in SDSS PSF magnitude |
| 11 | F7.3 | SDSS magnitude (not corrected for Galactic extinction) |
| 12 | F6.3 | error in SDSS PSF magnitude |
| 13 | F7.3 | SDSS magnitude (not corrected for Galactic extinction) |
| 14 | F6.3 | error in SDSS PSF magnitude |
| 15 | F7.3 | SDSS magnitude (not corrected for Galactic extinction) |
| 16 | F6.3 | error in SDSS PSF magnitude |
| 17 | F7.3 | SDSS magnitude (not corrected for Galactic extinction) |
| 18 | F6.3 | error in SDSS PSF magnitude |
| 19 | F9.3 | GALEX magnitude (not corrected for Galactic extinction); -999 if no detection |
| 20 | F8.3 | error in PSF magnitude (from GR1 object catalog); -999 if no detection |
| 21 | F8.3 | error in PSF magnitude (empirical calibration) |
| 22 | F9.3 | GALEX magnitude (not corrected for Galactic extinction); -999 if no detection |
| 23 | F8.3 | error in PSF magnitude (from GR1 object catalog); -999 if no detection |
| 24 | F8.3 | error in PSF magnitude (empirical calibration) |
| 25 | F7.3 | Galactic extinction in the band () |
| 26 | F7.3 | Logarithmic Galactic H I column density |
| 27 | F8.3 | ( km s-1 Mpc)* |
| 28 | F8.3 | Lν at 2200Å (rest-frame; -999 if no coverage) |
| 29 | F8.3 | Lν at 5100Å (rest-frame; -999 if no coverage) |
| 30 | F6.3 | relative color (corrected for Galactic extinction) |
| 31 | F8.3 | relative color (corrected for Galactic extinction) |
| 32 | F7.5 | object distance from GALEX field center (degrees) |
| 33 | F8.3 | GALEX near-UV effective exposure time (seconds) |
| 34 | F8.3 | GALEX far-UV effective exposure time (seconds) |
| 35 | I1 | GALEX survey identifier (4 = AIS, 3 = NGS, 2 = MIS, 1 = DIS) |
Note. — Data format and content for the full version of Table 2 that accompanies the electronic edition of the journal.
| Sample 1 | Sample 2 | -magnitude | Redshift | NUV | ||
|---|---|---|---|---|---|---|
| NUVFUV detections | DR3 Sample | 0.18 | 0.69 | |||
| NUV detections | DR3 Sample | 0.80 | 0.67 | |||
| no UV detection | DR3 Sample | 0.63 | ||||
| NUVFUV detections | no UV detection | 0.27 | ||||
| NUV detections | no UV detection | 0.62 |
Note. — Our Kolmogorov-Smirnov significance parameters computed for the indicated subsample distributions of selected parameters, after matches with 26 have been removed.
| Log (Å) | Log (Hz) | rms | |
|---|---|---|---|
| 3.831 | 14.646 | 0.810 | 0.041 |
| 3.788 | 14.689 | 0.699 | 0.030 |
| 3.752 | 14.725 | 0.611 | 0.018 |
| 3.731 | 14.747 | 0.610 | 0.026 |
Note. — A full version of the above table accompanies the electronic edition of the journal. Table 5 serves as a reference for its final form and content.