Complex Physics in Cluster Cores: Showstopper for the Use of Clusters for Cosmology?
1 Introduction
Galaxy clusters can be rather messy objects, e.g. rsk04 . Why should one use them to help solving pressing cosmological problems, especially about the nature of dark matter and dark energy? Are there not cleaner probes for this purpose?
First of all, the possible implications of dark energy, e.g., a modification of the fundamental gravity law or an introduction of a fifth force, are too far-reaching that we could afford to rely on just one single method: several independent observational methods are necessary if our picture of the universe is to be changed dramatically. Secondly, measurements of the primary anisotropies in the cosmic microwave background are not sensitive to any evolution of the equation of state of dark energy. Thirdly, it would appear that we may be able to simulate relevant physical processes in galaxy clusters actually more realistically than, e.g., in galaxies or supernovae. That is, clusters may indeed be relatively simple and clean probes. Fourthly, with purely geometric tests, e.g., using supernovae as standard candles, we cannot differentiate between, e.g., quintessence and a possible breakdown of general relativity. This can, however, be achieved with tests based on structure growth, e.g., the evolution of the galaxy cluster mass function.
Moreover, clusters are unique cosmological probes in the sense that there are many, more or less independent methods to constrain cosmological parameters with clusters and basically all wavelengths can be used to study clusters. Tests include, e.g., cluster baryons (fraction and its apparent evolution), power spectrum (normalization, shape, and baryonic wiggles), mergers (frequency and its evolution), and mass function (normalization, shape, and evolution). Wavelengths to find and study clusters include, e.g., optical/infrared (galaxies, lensing), radio (Sunyaev–Zeldovich-effect, halos and relics, wide and narrow angle tailed galaxies), -rays (especially with future instruments like GLAST), and X-rays.
Finally, after a phase of skepticism, renewed trust in clusters seems to spread. Skepticism was in part caused by low values of (for ) indicated early from cluster studies brt01 ; rb01 ; sel01 ; vnl01 , which seemed to be at variance with values obtained from other probes, including the 1st year WMAP data svp03 . This has changed since the release of the 3rd year WMAP data, which now confirms the low values sbd06 . Furthermore, the new best fit results from WMAP indirectly suggest that the intrinsic scatter and bias of cluster scaling relations like the X-ray luminosity–gravitational mass (–) relation may be smaller than previously thought r06 .
For future determinations of the evolution of the cluster mass function with the new generation of X-ray surveys (e.g., eROSITA is expected to detect about 100 000 clusters), primarily only X-ray luminosites will be available (gas temperatures only for a small subset of clusters). Therefore, we concentrate in this contribution on effects of cluster physics on the – relation. And since this is a cooling flow conference, we concentrate on the influence of cool cores on this relation.
2 Cool cores and the luminosity–mass relation
As mentioned above, indirectly the WMAP 3rd year data require no large bias or intrinsic scatter in the – relation. However, we would rather like to determine the intrinsic scatter directly from the data. This can be difficult because the measured scatter is a combination of statistical, systematic, and intrinsic scatter. So, a detailed understanding of all relevant systematic effects is required for a reliable determination of the intrinsic scatter. We are confident that the high quality cluster samples and state of the art data now available from Chandra, XMM-Newton, and Suzaku will be sufficient for a good estimate. We are currently working on this using the HIFLUGCS clusters. The preliminary results we show in this contribution are very closely related to other work that has been done recently with older data omb06 ; crb07 .
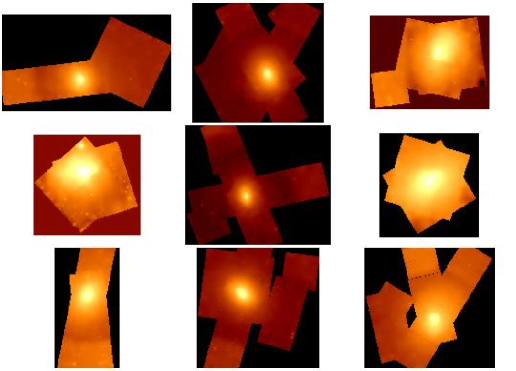
HIFLUGCS contains the 64 X-ray brightest clusters in the sky excluding 20 deg around the Galactic plane and some small regions around the Magellanic clouds and the Virgo cluster. It is a complete X-ray flux-limited sample selected from deep surveys based on the ROSAT All-Sky Survey rb01 (RB02). It is currently the best available sample in terms of homogeneous selection, size, completeness, representativeness, and full Chandra and (almost) XMM-Newton coverage. We are currently analyzing 120 Chandra and 100 XMM-Newton observations with a total exposure time approaching 7 Ms (see Fig. 1, and Hudson & Reiprich, these proceedings, and Nenestyan & Reiprich, these proceedings).
We are currently studying several methods to classify clusters as cool core (CC) and non-cool core (NCC) clusters with Chandra, including the slopes of the inner temperature and density profiles, central cooling times (the time the gas needs to cool below X-ray emitting temperatures), and central entropies. There is a large but not complete overlap between the results of these methods. Here we use a special “central” entropy to select CC (low entropy; i.e., high density and low temperature) and NCC (high entropy) clusters (see Hudson & Reiprich, these proceedings).
Now let us check if the two populations, CC and NCC clusters, behave differently in the – diagram. For the nearby clusters in HIFLUGCS, is best determined with ROSAT data due to its large field-of-view and low background. Gravitational masses have not, yet, been determined with Chandra or XMM-Newton for all HIFLUGCS clusters so we simply use the old masses determined from the ROSAT gas density profiles and overall (primarily ASCA) gas temperatures (RB02). Figure 2 (left) shows that the – relation for CC clusters has a factor of 2.5 higher normalization (at ) than the relation for NCC clusters – the CC clusters segregate out to the high (or low ) side (see also Chen et al., these proceedings). Also, the CC clusters seem to exhibit smaller scatter around their best fit relation than the NCC clusters. This may be at variance with the results of O’Hara et al. omb06 who found a larger scatter for CC clusters in the – relation. Furthermore, it appears that all low mass clusters and groups in the sample have a cool core.
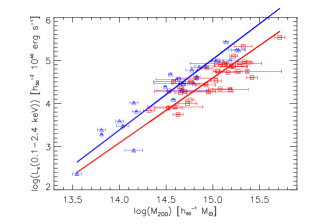
The factor 2.5 offset between the two best fit relations may indicate significant intrinsic scatter; i.e., since CC clusters have higher central densities and since X-ray emissivity is proportional to density squared, CC clusters may have significantly higher for given compared to NCC clusters, if the central regions of CC clusters account for a very significant fraction of the total cluster luminosities.
On the other hand, systematic effects can play a role as well. If, e.g., cool cores bias overall cluster temperature estimates low compared to their virial temperatures then the estimated masses will be biased low, too. A possible mass bias is enhanced compared to a temperature bias because and the offset to be accounted for in direction is smaller then the offset in direction because . So, even relatively small biases can have a significant effect on the offset in the – relation. Also other systematic differences between CC and NCC clusters with the potential of biasing simple mass estimates might be important, e.g., a difference between the steepening of the surface brightness profiles in the very outer CC/NCC cluster parts (e.g., Burns et al., these proceedings).
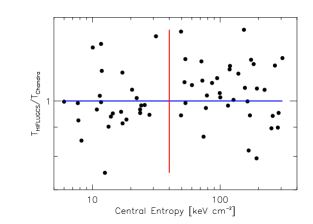
Many of the temperature estimates we used for the original mass determination in RB02 were, one way or another, “corrected” for cooling flows. So, we actually do not expect a very large bias. With the new preliminary Chandra temperature profiles for all HIFLUGCS clusters available (Hudson & Reiprich, these proceedings) it is straightforward to exclude thoroughly any cool core emission for overall temperature estimates. Figure 2 (right) shows the ratio of the original temperature estimates and the preliminary Chandra overall determinations as a function of central entropy. Clusters to the left in this diagram are CC clusters, those to the right NCC clusters. While in general there is very good agreement between the temperatures, one notes that most of the CC clusters have a ratio below 1 while most of the NCC clusters have a ratio larger than 1, indicating that indeed a small temperature bias is present. However, currently the magnitude of this effect alone does not seem large enough to account for all of the observed offset. Soon the Chandra analysis will be completed (including the mass determination). We will then be able to derive very tight and robust limits on the intrinsic scatter in the – relation.


Having a continuous measure for the “strength” of a cool core one can try to include it as a scaling parameter in the – relation; e.g., O’Hara et al. omb06 used the central surface brightness for this purpose. Here we play with the central entropy. Figure 3 shows the – relation again (left) and then, on the right, the same relation but all values multiplied with the central entropy, , and chosen such that scatter is minimized. And, indeed, such a scaling does reduce the scatter. Again, we will work this out in more detail once we are completely done with the Chandra analysis. The specific choice of using central entropy to reduce scatter will possibly only be of limited practical value because if the data are good enough to determine the central entropy then is probably better determined directly from the density and temperature profile than from the – relation.
3 Summary
Soon we should be able to quantify robustly the intrinsic scatter in scaling relations directly from cluster data, eliminating the need to estimate it indirectly by comparison to other cosmological probes. Even if it turns out that cool cores cause a relatively large intrinsic scatter, it is straightforward to correct for the resulting effects in cosmological tests. So, cool cores do not appear to be a showstopper for using clusters for precision cosmology.
Something else that will be required in the near future from the X-ray cluster community is a coordinated effort to perform detailed consistency checks, similarly to what the weak lensing and simulation communities have already done fwb99 ; hvb06 . We are trying to do a first simple step in this direction by analyzing the HIFLUGCS sample independently with Chandra and XMM-Newton but a larger scale effort involving several more groups and also simulations is necessary to convince the general cosmology community that cluster systematics are sufficiently under control.
References
- (1) T. H. Reiprich, C. L. Sarazin, J. C. Kempner, and E. Tittley, ApJ, vol. 608, pp. 179–188, June 2004.
- (2) S. Borgani, P. Rosati, P. Tozzi, S. A. Stanford, P. R. Eisenhardt, C. Lidman, B. Holden, R. Della Ceca, C. Norman, and G. Squires, ApJ, vol. 561, pp. 13–21, Nov. 2001.
- (3) T. H. Reiprich and H. Böhringer, ApJ, vol. 567, pp. 716–740, Mar. 2002.
- (4) U. Seljak, MNRAS, vol. 337, pp. 769–773, Dec. 2002.
- (5) P. T. P. Viana, R. C. Nichol, and A. R. Liddle, ApJ, vol. 569, pp. L75–L78, Apr. 2002.
- (6) D. N. Spergel, L. Verde, H. V. Peiris, E. Komatsu, M. R. Nolta, C. L. Bennett, M. Halpern, G. Hinshaw, N. Jarosik, A. Kogut, M. Limon, S. S. Meyer, L. Page, G. S. Tucker, J. L. Weiland, E. Wollack, and E. L. Wright, ApJS, vol. 148, pp. 175–194, Sept. 2003.
- (7) D. N. Spergel, R. Bean, O. Dore’, M. R. Nolta, C. L. Bennett, G. Hinshaw, N. Jarosik, E. Komatsu, L. Page, H. V. Peiris, L. Verde, C. Barnes, M. Halpern, R. S. Hill, A. Kogut, M. Limon, S. S. Meyer, N. Odegard, G. S. Tucker, J. L. Weiland, E. Wollack, and E. L. Wright, ApJ, submitted. Preprint: astro-ph/0603449, Mar. 2006.
- (8) T. H. Reiprich, A&A, vol. 453, pp. L39–L42, July 2006.
- (9) T. B. O’Hara, J. J. Mohr, J. J. Bialek, and A. E. Evrard, ApJ, vol. 639, pp. 64–80, Mar. 2006.
- (10) Y. Chen, T. H. Reiprich, H. Böhringer, Y. Ikebe, and Y.-Y. Zhang, A&A, submitted., Sept. 2006.
- (11) C. S. Frenk, S. D. M. White, P. Bode, J. R. Bond, G. L. Bryan, R. Cen, H. M. P. Couchman, A. E. Evrard, N. Gnedin, A. Jenkins, A. M. Khokhlov, A. Klypin, J. F. Navarro, M. L. Norman, J. P. Ostriker, J. M. Owen, F. R. Pearce, U. . Pen, M. Steinmetz, P. A. Thomas, J. V. Villumsen, J. W. Wadsley, M. S. Warren, G. Xu, and G. Yepes, ApJ, vol. 525, pp. 554–582, Nov. 1999.
- (12) C. Heymans, L. Van Waerbeke, D. Bacon, J. Berge, G. Bernstein, E. Bertin, S. Bridle, M. L. Brown, D. Clowe, H. Dahle, T. Erben, M. Gray, M. Hetterscheidt, H. Hoekstra, P. Hudelot, M. Jarvis, K. Kuijken, V. Margoniner, R. Massey, Y. Mellier, R. Nakajima, A. Refregier, J. Rhodes, T. Schrabback, and D. Wittman, MNRAS, vol. 368, pp. 1323–1339, May 2006.