Initial Results from the
USNO Dispersed Fourier Transform Spectrograph
Abstract
We have designed and constructed a “dispersed Fourier Transform Spectrometer” (dFTS), consisting of a conventional FTS followed by a grating spectrometer. By combining these two devices, we negate a substantial fraction of the sensitivity disadvantage of a conventional FTS for high resolution, broadband, optical spectroscopy, while preserving many of the advantages inherent to interferometric spectrometers. In addition, we have implemented a simple and inexpensive laser metrology system, which enables very precise calibration of the interferometer wavelength scale. The fusion of interferometric and dispersive technologies with a laser metrology system yields an instrument well-suited to stellar spectroscopy, velocimetry, and extrasolar planet detection, which is competitive with existing high-resolution, high accuracy stellar spectrometers. In this paper, we describe the design of our prototype dFTS, explain the algorithm we use to efficiently reconstruct a broadband spectrum from a sequence of narrowband interferograms, and present initial observations and resulting velocimetry of stellar targets.
1 Introduction
The past two decades have seen a tremendous improvement in the capabilities of astronomical spectrometers. Velocity precisions of 1 km/s were rarely achieved prior to 1980, while the current generation of high-precision spectrometers boast precisions of a few m/s or less. Such instruments have been able to find planetary companions with in over 150 stellar systems (where is the inclination angle of the orbit of the companion, and is the mass of Jupiter), by detecting periodic variation in the stellar radial velocity (RV).
Summaries of the advantages and limitations of the spectroscopic instrumentation and data reduction procedures are discussed elsewhere (Butler et al. 1996; Marcy & Butler 1998; Baranne et al. 1996). The majority of the planet detections to date have been made using cross-dispersed echelle spectrometers equipped with molecular iodine absorption cells. The gas absorption lines provide a wavelength reference scale, superposed on each observed stellar spectrum, which is sufficiently stable to give long-term radial velocity accuracies as small as 1 m/s. More recently, thorium-argon emission line calibration has gained popularity, and also achieves 1 m/s accuracy (Lovis et al. 2006). These precision wavelength calibration techniques have been refined by a number of different research groups, and are now in widespread use. However, if planetary masses significantly smaller than are to be inferred spectroscopically, or if other spectroscopic studies requiring instrumental precisions better than m/s are needed, it is likely that a very different type of instrument is required.
Echelle spectrographs are not the only option for high-precision, high-resolution spectroscopy. For many observations, a Fourier Transform Spectrograph (FTS) provides superior resolving power and wavelength accuracy (Brault 1985). The concept of the FTS has been around for over a century; the theoretical basis was laid at the end of the century (Michelson 1891, 1892), but FTSs did not achieve widespread use until 75 years later (Ridgway & Brault 1984 and references therein), after requisite technological advances in optics, precise motion control, and laser metrology were made. FTS devices are now common for laboratory spectroscopy, atmospheric sensing, and numerous other applications. However, astronomers have yet to embrace interferometric spectrometers for the purpose of obtaining precise velocities of stars in the optical regime. (For spectroscopy at radio wavelengths, by contrast, the FTS is the standard device of choice.)
The unpopularity of the FTS for optical spectroscopy is well-founded: interferometric devices are generally more complex, mechanically demanding, and cumbersome than their grating spectrometer counterparts. But most importantly, the effective throughput of a conventional FTS observing a broadband source in the photon-noise-limited regime is inferior compared to a conventional spectrometer with an array detector. To achieve good fringes over a range of delays, the bandwidth of an FTS is typically restricted to a narrow slice of the optical spectrum, and for broadband use, a scanning FTS, which collects one interferogram data point at each delay position, has an efficiency equivalent to a single-pixel scanning spectrometer or monochromator. This drawback has prevented the FTS from being widely used in astronomy at optical wavelengths, where sensitivity is of paramount importance. For precise stellar radial velocity measurements, spectral resolutions of 50,000 are required in order to resolve stellar absorption lines. A broadband, conventional, photon-limited FTS operating at this resolution will convert detected photons into spectral signal-to-noise ratio with an efficiency 50,000 times smaller than a dispersive spectrograph. For all the advantages of FTS devices, their poor efficiency renders them essentially useless for precise stellar velocimetry. As a result of this limited sensitivity, FTSs are commonly used only in situations where sensitivity can be sacrificed for precision, such as laboratory spectroscopy (Kerber et al. 2006; Aldenius, Johansson, & Murphy 2006; Ying et al. 2005), solar observations (Fawzy, Youssef, & Engvold 1998), or where very high spectral resolution or accurate wavelength calibration are required, such as in measurements of planetary atmospheres (Cooper et al. 2001; Krasnopolsky, Maillard, & Owen 2004).
The key to surmounting this limitation of the traditional FTS is to divide the broad spectral bandpass into many narrow-bandpass channels, by placing a dispersive grating at the output of the interferometer, and then focusing the resulting medium-resolution spectrum onto an array detector. Each pixel on the detector sees only a tiny range of wavelengths, so the interferometric fringes remain visible with a high signal-to-noise ratio over a much wider range of optical path difference, and the interferograms can be sampled much more coarsely without sacrificing information. In essence, by adding a post-disperser, we have created a few thousand separate narrow-band FTSs, all operating in parallel. We have named the resulting device the “dispersed Fourier Transform Spectrograph,” or dFTS.
Combinations of FTS and dispersive technologies have been considered or developed by other instrumentation projects. Jennings et al. (1986) briefly describe using a grating monochromator at the output of the Kitt Peak 4-meter facility FTS to select specific narrowband output channels (albeit without multiplexing). Mosser, Maillard, & Bouchy (2003) discuss the advantages of using a low-resolution dispersive element to collect multiple parallel interferograms in simulations of an FTS-based asteroseismology spectrograph. In a similar vein, the “Externally Dispersed Interferometer” (EDI) concept described by Erskine (2003) and Erskine, Edelstein, & Feuerstein (2003) uses a Michelson interferometer to induce spectral fringes on a high-resolution optical spectrum, providing wavelength calibration and boosting the spectral resolution by a factor of 2 to 3. An EDI-based device recently discovered a new planet (Ge et al. 2006), demonstrating the potential of spectral interferometry for stellar velocimetry. Both the Mosser et al. and Erskine et al. concepts operate at a fixed non-zero delay position, or scanning over a small range of closely-spaced delays, whereas the dFTS coarsely samples the interferogram over a wide range of delay positions, so that a complete high-resolution broadband spectrum can be reconstructed.
Another advantage of the dFTS design lies in its built-in laser metrology system. In order to accurately reconstruct the input spectrum from the measured interferograms, we must precisely measure the optical path difference (OPD) between the two arms of the interferometer while fringe data are being acquired. We send a collimated polarization-modulated beam from a frequency-stabilized laser through the same interferometer path as the starlight beam, from splitting to recombination, and then extract the laser signal to measure OPD changes with an accuracy of nm. By continuously monitoring the path length difference during data acquisition via the metrology system, we can unambiguously assign a path length difference, or delay, to each fringe measurement of the dFTS, preserving the wavelength scale of the resulting spectrum with high precision (we use the term “lag” interchangeably with “delay”). This wavelength solution extends across the entire optical bandpass, unlike the iodine calibration technique, which loses effectiveness for nm.
Yet another virtue of the interferometric approach is that the instrument can be smaller and cheaper than an echelle with equivalent resolving power. This is particularly important for telescopes with large apertures. Since the interferometer section of the dFTS provides all of the high-resolution spectral capability, the demands on the dispersing element are greatly relaxed, and the collimated beam diameter within the dispersive spectrograph section can be an order of magnitude smaller than otherwise. Smaller optics will be considerably less expensive, and the overall instrument size can be as large as a desk instead of occupying an entire room.
With these instrumental modifications, the FTS has the potential of surpassing the m/s accuracy achieved by absorption-cell echelle spectrographs, and doing so with smaller and cheaper hardware. At this level of RV precision, apparent Doppler velocity oscillations can be induced by the convective and turbulent motions of the star’s surface, even for relatively old, inactive stellar types. These sources of “astrophysical noise” pose a significant challenge to detection of low-mass planets.
In this paper, we describe the design, construction, and testing of a prototype dFTS. In §2, we compare the optical configurations of a conventional FTS and a dFTS, and describe the hardware implementation of our dFTS instrument. The data acquisition and processing systems are detailed in §3. Initial results on calibration light sources, which test the systematic error limits of the device, are shown in §4. Radial velocity measurements on stellar targets, including spectroscopic binaries and exoplanet systems, are presented in §5, along with a discussion of the precision limits of the instrument. In §6, we summarize the status and initial results of the current dFTS, and explore future prospects for this technology. Appendices A and B then describe the theory of spectral multiplexing and our FROID (Fourier Reconstruction of Optical Interferometer Data) algorithm in detail.
2 Interferometer Design
2.1 Review of Conventional FTS
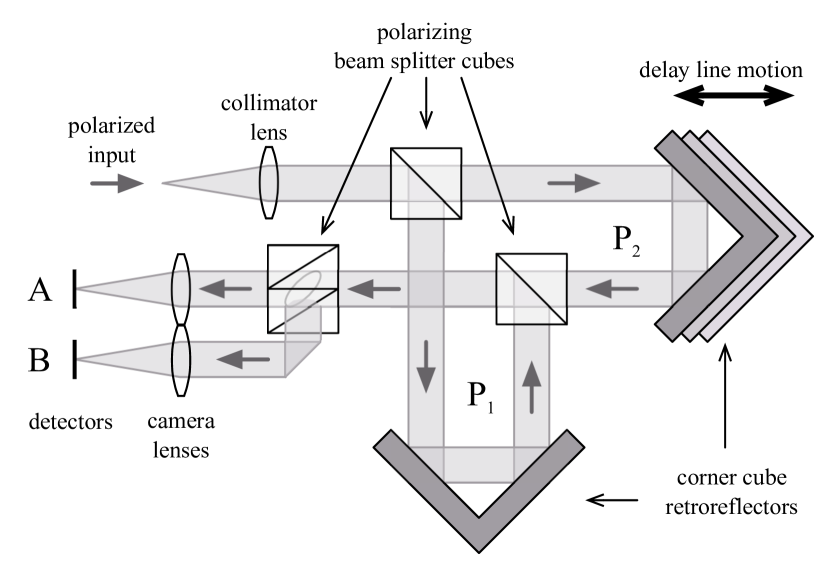
In Figure 1, we show a cartoon layout of a conventional white-light FTS using polarizing optics. The progress of the light beam through this apparatus can be outlined in five stages: (1) The incoming collimated beam of light is divided into two beams by a polarizing beam splitter cube (PBSC). (2) The beams follow separate paths, and . The length of , the “delay line,” can be precisely adjusted by translating the moving retroreflector. (3) The beams are recombined by another PBSC. (4) Using a third PBSC, the recombined beam is split into two orthogonal diagonal polarizations to induce fringing. (5) The intensity of each of the recombined beams (A, B) is separately measured by a detector for a sequence of different delay line positions. As is the case for most interferometers, these two outputs are complementary (e.g. their fringes will be 180o out of phase from each other to conserve energy). The following discussion refers only to output A.
The wavelengths in the incoming light beam cover a range from to , i.e., centered on and covering a range . The most important length parameter in the FTS is the delay, , which is equal to the optical path length difference between paths and . At any given wavelength , complete constructive interference between light from the two paths occurs when is an integer, and complete destructive interference occurs when is an integer plus . When the paths and are precisely equal to within a small fraction of (i.e., at all wavelengths), the intensity of the output beam is at its maximum, , since the light waves at all wavelengths constructively interfere. This position is known as the central fringe. As we move the delay line and increases, the interference fringes weaken and decreases. As continues to increase, reaches a minimum at and then rises again to a new (but weaker) maximum at . This weakening oscillation of continues as increases. When is many times larger than , some wavelengths interfere constructively and some destructively, so is close to the mean light level (i.e. 0.5 ). Thus, if the observed spectral region is wide, there is only a small range of delay near the central fringe with large deviations from the mean level for both output beams.
The resulting data set of intensity measurements at many values of is known as an interferogram. The region of over which there are large deviations from the mean level is termed the fringe packet. Illustrative examples of interferograms are shown in Figure 2. In the limit of infinite bandwidth, the Nyquist Theorem requires sampling the interferogram in steps of in order to avoid losing spectral information. In practice, the interferogram is often sampled somewhat more finely than this. The resolution of the spectrum is determined by the maximum value of . We can see this if we imagine a spectrum consisting of a single narrow emission feature. Its interferogram will have a large range of over which oscillates. In order to see just how narrow the spectral feature is, we must continue to increase until the oscillations in diminish.
In principle, an FTS offers three advantages over a dispersing spectrometer. (1) The spectral resolution can be changed simply by changing the maximum value of , i.e. the delay line scan range. (2) The wavelength scale in the resulting spectrum is computed directly from the delay line measurements, and is insensitive to such effects as scattered light and flexure of the instrument. (3) The line spread function (instrumental broadening function) of the resulting spectrum can be derived, to a high degree of precision, directly from the delay sampling function.
However, as mentioned previously, traditional FTSs suffer from low sensitivity, because much of the delay scan range produces a small signal, and because a large number of measurements must be done sequentially to produce a well-sampled interferogram. Also, fringes can be difficult to distinguish from temporal flux variations in the source, so some flux normalization procedure must be implemented when observing stars through the turbulent atmosphere.
2.2 Dispersing the White Light Fringe
Our strategy for mitigating these shortcomings is to use a grating spectrometer to disperse the recombined white light beam emerging from a conventional FTS. This technique converts a single, broadband FTS into numerous narrowband interferometers, all functioning in parallel. Since the width of the fringe packet is inversely proportional to the spectral bandwidth, dispersing the white light beam into narrowband channels serves to broaden the fringe packet for each channel by a factor of or more.
There are two significant gains that are realized by the dispersed interferometer. The first advantage results directly from the Nyquist Theorem, which states that in order to avoid aliasing, the fringes must be sampled at intervals, , that are at most:
| (1) |
where is the bandwidth in wavenumber. Since the postdispersion narrows the bandwidth for a given spectral channel, the fringes can be sampled at wider intervals. For a fixed total delay range (i.e. spectral resolution), fewer samples are needed to reconstruct an unaliased narrowband signal than an unaliased broadband signal.
Second, since the fringe packet for a narrowband channel is wider than that of the broadband white light (recall Figure 2), a larger fraction of the delay range is spanned by high-contrast fringe signal. As a result, the signal-to-noise ratio in the resulting spectrum is increased. We prove this from basic principles in Appendix A. More detailed discussions, derivations, and specific examples of the advantages resulting from dispersing the white light fringe can be found in Appendix B, where we discuss our spectral reconstruction algorithm in detail.
2.3 Instrument overview
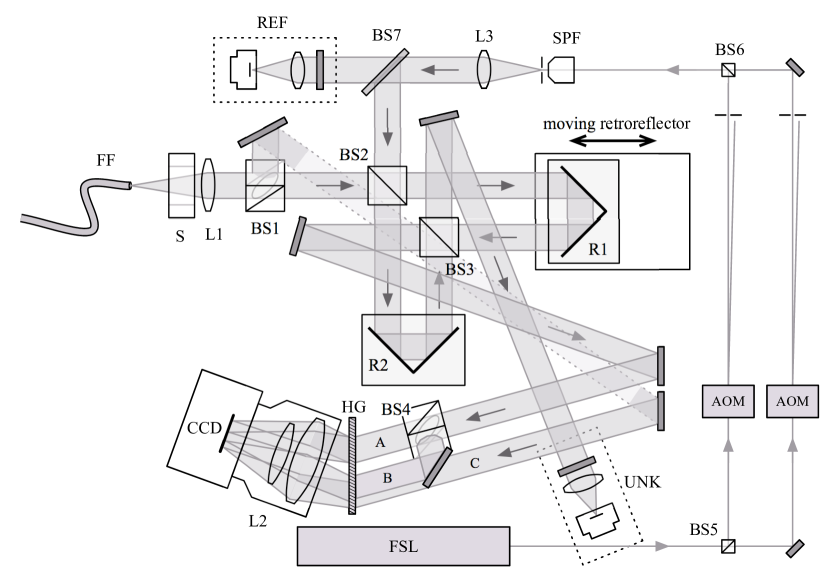
Our adopted configuration for the dispersed FTS prototype is shown in Figure 3. Light is guided from the telescope to the interferometer through a multimode optical fiber feed FF. (The implications of this mode of transport on the measured interferometric correlation is discussed in §2.5.) The light passes through a mechanical shutter S (a Uniblitz VS25, with a nominal opening time of 6 ms) and is then collimated with an achromatic doublet lens L1 into a beam with a diameter of mm.
It is assumed that the electric field at any position in the light beam has a random polarization vector. Since the resulting performance of an FTS is optimal when the input beam is split in two equal portions, and since we intend to use a polarizing beamsplitter (which reflects vertically polarized light and transmits horizontally polarized light) for the interferometer, we must ensure that all of the light reaching the interferometer is linearly polarized at 45o to the plane of the table. To achieve this polarization, the light passes through BS1, a PBSC oriented at relative to the optical table. The light transmitted through this cube is thus polarized at relative to the axes of the interferometer beamsplitters, while the light reflected from BS1 is routed by two relay mirrors to the dispersive back-end of the instrument, where it serves as an unfringed “photometric” signal for flux normalization (the so-called C beam).
The beam then enters the interferometer proper, splitting into its vertically and horizontally polarized components, the V beam and the H beam, at PBSC BS2. Each sub-beam travels down one arm of the interferometer, enters a retroreflecting corner cube (R1 or R2) consisting of three mirrors, and emerges parallel to the incoming sub-beam, but displaced laterally by approximately 4 cm. The H and V sub-beams meet at BS3, where they recombine. Since this “beam-combiner” cube is also polarizing — reflecting vertically-polarized light, and transmitting horizontally-polarized light — nearly all of the starlight emerges from one face of BS3 (traveling leftwards in the figure).
At this point, the recombined beam contains two sub-beams, H and V. In order to see interference patterns, we must send the beam through yet another polarizing beamsplitter, BS4, oriented at to the optical table plane (like BS1). Half of each of the H and V beams are transmitted by BS4 and emerge with a diagonal linear polarization. We call this beam A. The other half of the H and V beams are reflected by BS4 and have a diagonal linear polarization. They are reflected by a mirror into beam B, parallel to beam A. Since the photons in each of beams A and B have the same polarization, they can interfere, and broadband fringes would appear if we placed detectors within the beams at this point.
Instead, we send both the A and B beams (plus the photometric C beam, which did not pass through the interferometer section) into the dispersive “backend” of the dFTS system. We are interested in dispersing the white light to form spectra covering a wavelength range of 460–560 nm, as the density of absorption lines in this region is high for late-type stars, and thus is rich in radial velocity information. Our choice for the dispersing element is a holographic transmission grating HG, manufactured by Kaiser Optical Systems. We obtained a 10 cm 10 cm grating with 1800 lines/mm, blazed to first order at = 470 nm at an angle of . The peak efficiency of these gratings is very high, as illustrated by the transmission curves in Figure 4.
The dispersed beams are focused onto the detector by an f/2 Nikon camera lens L2 (see Figure 3) with focal length 135 mm. The A, B, and C beams enter the lens aperture tilted slightly relative to each other so that the three spectral “tracks” do not overlap on the detector. Our detector is an Andor DU-440 CCD ( pixels, m per pixel), which yields an average dispersion of 0.05 nm/pixel. The m input fiber diameter subtends several pixels on the CCD, and from our calibration data, we derive a FWHM bandpass per channel of 0.30 nm, so the spectral resolving power of the grating backend is thus . To prevent stray laser reflections from entering the CCD, a shortpass filter with a 50% cutoff wavelength of 600 nm is placed in front of the CCD window.
2.4 Metrology System
In order to achieve the desired wavelength accuracy in the final stellar spectra, we need to precisely measure the optical path difference in the interferometer at each delay position. We use a laser metrology system to accomplish this. The metrology beam follows the same optical path through the interferometer as the starlight does. We then employ a phase-locked loop (PLL) to track the metrology fringes in real time. Instead of implementing the PLL in hardware, we do most of the phase tracking in software, resulting in a simple, inexpensive design that requires only off-the-shelf components. The lack of custom signal acquisition boards (as is necessary in the case of a hardware PLL) results in cost and time savings.
The metrology system begins with a frequency-stabilized helium-neon (HeNe) laser, FSL in Figure 3, operating at a wavelength of 632.8 nm. We selected the Melles Griot 05-STP-901 laser, which offers good wavelength stability and output power for a modest price. A collimated beam with a diameter of mm emerges from the laser. The laser tube is rotated so that the plane of polarization is oriented at relative to the plane of the optical table. The laser beam is split by a polarizing beamsplitter cube BS5, and each sub-beam passes through a separate acousto-optical modulator (AOM), one of them driven at 40 MHz, the other at 40 MHz + 11 kHz. (The same controller unit drives both AOMs, to ensure that the 11 kHz frequency difference remains constant.) The AOMs act like a “moving grating”, with an unshifted zero-order beam, flanked by first order beams with frequency shifts of MHz (for one AOM) and MHz (for the other AOM). We rotate each AOM (in essence, adjusting the angle of incidence of the “grating”) to put as much power into the desired first-order beam as possible, and block the other beams. Each AOM thus produces one beam; the two beams have orthogonal linear polarizations and a frequency difference of 11 kHz.
These two laser beams are recombined at a second polarizing beamsplitter cube BS6, spatially filtered with a microscope objective and a pinhole (SPF), collimated with lens L3, and sent through an iris with a diameter of mm, which is the same diameter as the starlight beam. The resulting metrology beam contains horizontally-polarized light at one frequency and vertically-polarized light at a slightly different frequency. A non-polarizing beamsplitter BS7 is used to divert one half of this beam to the “reference detector cluster” (REF), consisting of a sheet polarizer (oriented at ), followed by a lens which focuses the beam onto a Thorlabs PDA-55 PIN photodiode detector. The polarizer mixes the H and V metrology beams, producing an intensity modulation at 11 kHz, which is detected by the photodiode and then transported via coaxial cable to one of the inputs of a digital lock-in amplifier, the Stanford Research SR830.
The remaining metrology signal is injected into the interferometer, entering BS2 orthogonal to the incoming white light beam. At BS2, the two polarizations of the metrology beam are separated: one travels through one arm, the other through the other arm. By adjusting the input angle and position at BS2, the metrology beams are made to be completely coincident in position and direction with the white light beams, so that they pass through the same airmass and reflect off of the same mirror surfaces within the interferometer section of the instrument. This alignment, and the resulting full-aperture metrology data, is crucial for accurately measuring the optical path difference for the starlight beam. Full aperture metrology eliminates a large number of potential instrumental systematic errors, which would otherwise plague the stellar spectra obtained with this device.
At BS3, the metrology beams are recombined, and they exit the interferometer orthogonal to the white light exit beam. The combined beam is routed to the “unknown detector cluster” (UNK), which is identical to the reference detector cluster: a sheet polarizer at , which causes the horizontal and vertical polarizations to mix together, and a lens to focus the beam onto a second PIN detector, where we detect a similar 11 kHz modulation. This UNK signal is sent to the second input of the lock-in amplifier, where it is phase-referenced to the REF reference signal (see §3.1).
2.5 Fiber Input
In order to transport photons from the telescope focal plane to the spectrometer, we utilize a Ceramoptec Optran UV-50/125 multimode fiber cable, 20 meters in length, with an armored jacketing to prevent excessive bending or damage. This fiber has a core diameter of m and a rated numerical aperture (NA) of 0.22. (Previous iterations of the dFTS hardware utilized different fibers with lower NA, chosen in order to control focal-ratio degradation, but the throughput of these “slow fibers” was correspondingly poor: 33% to 50% in some cases, compared to % for the current fiber.) Light from the telescope typically enters the fiber at f/6.5, and it emerges at approximately f/4, so that nearly all of it makes it through the initial collimating lens and iris.
Keeping the star image centered on the fiber input aperture requires feedback to the telescope steering system. We have constructed a customized “guider box,” which bolts on to the Cassegrain port of the telescope. The converging f/10 beam from the telescope secondary is sped up to f/6.5 by a focal reducer lens, then passes through a 8% reflective pellicle. The beam comes to focus at the front face of the fiber ferrule, where most of the starlight “disappears” down the fiber aperture, which subtends 2.5 arcsec on the sky. A small fraction of the light (the extreme wings of the seeing profile, which hits the polished metal ferrule face outside the fiber cladding diameter, as well as the % Raleigh reflection from the fiber core region) bounces back up to the pellicle, and is reflected to a small achromatic lens, which reimages the image from the fiber end onto an Astrovid StellaCam II video camera. We manually steer the telescope to place the star on the fiber center, and then enable custom guiding software, which adjusts the telescope pointing to keep the star image centered on the fiber core based on feedback from the Astrovid camera.
Using multimode fiber results in good light gathering ability at the telescope focal plane, and a scrambled wavefront emerging from the waveguide. The scrambling of the wavefront would be fatal if we were correlating light from spatially separated apertures (spatial interferometry), but we are autocorrelating the light from a single aperture (temporal interferometry).
2.6 Alignment system
For maximum fringe contrast and metrology accuracy, the collimated beams within the interferometer must be coincident in pupil position to mm, and parallel to within a few arcseconds. In order to achieve these specifications, many of the key optical elements within the instrument are under remote tip-tilt or X-Y translation control, using New Focus “Picomotor” actuators. To align pupil positions, we insert white cards into the collimated beams using electric-motor actuators, and then view the pupil images using modified webcams. For evaluating angular differences between beams, we use a Picomotor to rotate a pick-off mirror into a collimated beam, rerouting it through a long-focal-length lens and directly onto another webcam detector. Using beam blockers to blink between two different overlapping beams (e.g. metrology vs. starlight, or interferometer arm 1 vs. arm 2), we can then evaluate any positional or angular misalignments, and correct them via Picomotor. A Java-based user interface controls all the alignment motors and cameras, and walks the user through the proper alignment sequence. Using this system, we achieve positional accuracy of mm and angular accuracy of arcsec.
2.7 Temperature stabilization
The temperature of the dFTS optical elements, optomechanical mounts, and breadboard must remain constant, to minimize nightly realignment. This requirement is a particular challenge at the prototype’s current location, in a room which is vented to the outside air to reduce dome seeing during observations. The entire dFTS instrument is enclosed in a sturdy wooden crate, with 4-inch thick Celotex insulation panels on all six faces. Air is circulated through the enclosure in a closed cycle, exiting the box via insulated flexible pipe and passing through a 400 BTU/hr thermoelectric air conditioner and a 150 W heater, which are regulated by an Omega CNi8 temperature controller. Thermocouple probes are located throughout the interior of the instrument box, to provide feedback signal to the Omega controller, and allow us to monitor the instrument temperature. This temperature control system has proven sufficient to maintain internal air temperatures to F, even when the room temperature drops to F (during winter observing) or rises to F (during the summertime). We also monitor the atmospheric pressure and relative humidity within the box, and use these data to correct for atmospheric dispersion effects within the interferometer.
3 Data Acquisition
In order to minimize the complexity of the control software, we wanted to avoid a realtime operating system for the dFTS computer systems. Fortunately, the adopted hardware configuration and observing logistics permitted us to adequately control the hardware with two standard 450 MHz PC computers running the Microsoft Windows 2000 operating system. We name these the “metrology” and “fringe” computers, and describe their functions and interactions below.
3.1 Metrology Data
The lock-in amplifier (LIA) takes the analog signals from the REF and UNK metrology detectors as its inputs. Within the LIA, signals are passed through an analog-to-digital converter and mathematically analyzed by a digital signal processor. The phase difference between the two signals at the carrier frequency is isolated by the LIA, suppressing noise at other frequencies and resulting in a high signal-to-noise ratio detection. The outputs from the LIA consist of cosine (X) and sine (Y) components of the phasor which represents the phase difference between the REF and UNK signals. These outputs are analog to 10 V signals, which we digitize using a National Instruments PCI-6034E board, a 4-channel data acquisition system with 16-bit resolution and a total bandwidth of 200 kHz. Board channels 1 and 2 capture the X and Y signals, and the third board channel monitors the TTL trigger signal for the mechanical shutter. The three signals are acquired at a rate of 50 kHz and written to the hard drive of the “metrology” computer for later processing.
3.2 Fringe Data
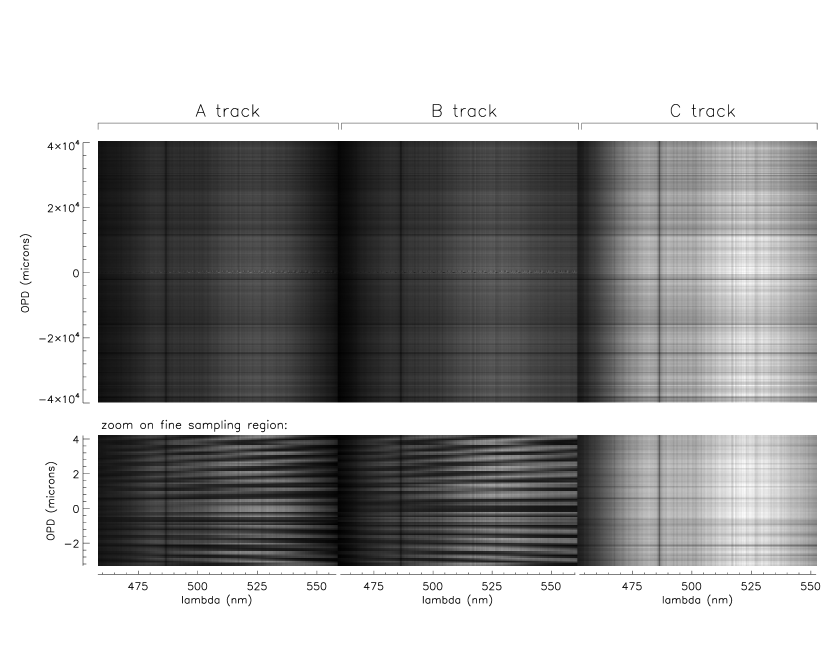
The CCD and shutter are controlled by a PCI board in the “fringe” computer. The board activates the shutter using a TTL pulse, then reads out three subrasters from the CCD, each of which contains one of the dispersed spectra of the A, B, and C beams. The subrasters are each binned vertically, so that the CCD output consists of three “tracks,” which we also label A, B, and C. Each track is comprised of 2048 channels, corresponding to the columns on the CCD chip. At each delay position during an observation (or “scan”) of a stellar target, we read out values. Given delay line positions, our 2-d interferogram data file contains total pixels. In Figure 5, we show a typical interferogram image covering a delay range of mm, centered on the central fringe, and evenly sampled every (except for the more finely-sampled region around the central fringe). In principle, since the interferogram is symmetric around the central fringe, we only need to sample the positive or negative half of the delay range to derive a spectrum, but as discussed in Brault (1985), there are significant advantages to measuring both halves of an interferogram. Also, since radial velocity information is not distributed uniformly throughout delay space (see Erskine (2003) for a detailed discussion), we might achieve better RV results by concentrating our delay measurements on specific regions of delay space. However, since our ultimate goal is to build a general-purpose precision spectrometer, not just a velocimeter, we have adopted a uniform delay sampling. We plan to explore the optimization of the delay sampling function for specific astrophysical measurements (RV, chemical abundances, stellar rotation, etc.) in future publications.
As described in §2.1, the central fringe of the fringe packet occurs when there is zero optical path difference between the two delay lines. At this position, all wavelengths interfere which results in maximum signal in the A track, and minimum signal in the complementary B track. We regularly achieve a peak fringe contrast of 75% at this central location. Proper reconstruction of channel spectra from the narrowband interferograms requires that we know the location of this central fringe location to an accuracy of a few nm. All data acquisition scans therefore contain a “fine sampling region” (FSR), within which the fringe packets are sampled every 100 nm, allowing a sinusoid fit for each channel. The delay position at which all channels simultaneously reach a maximum is therefore the central fringe, and the zero point reference for the relative delay positions measured via the metrology system.
3.3 Computer Control Loop
The main function of the computer control loop is to synchronize the data streams from the fringe and metrology systems without the use of a real-time computer operating system. The key to the synchronization is the shutter TTL pulse, which is in the “on” state as long as the shutter is open. For an interferogram consisting of delays, there are an equal number of shutter openings and closings, which we can see in the shutter signal collected by the “metrology” computer DAQ card. Combining the shutter signal and metrology LIA phase angle data, we can solve for the optical path change from one delay step to the next, and evaluate the fluctuation in delay (due to vibrations, change of index of refraction of air, etc.) during each CCD exposure. In this manner, an unambiguous path difference can be assigned to each fringe integration, and referenced to the central fringe location.
3.4 Postprocessing
The first step in postprocessing the fringe data is to obtain the central wavelength of each spectral channel in the A and B tracks. This is accomplished by observing an incandescent white light source at the beginning of each observing night, which provides a high-SNR template for the spectral bandpass of each channel. A 2-d interferogram is collected from the white light source, using a similar delay pattern as for stellar observations, but with finer sampling in order to reduce ambiguity due to Fourier aliases. The white light narrowband interferograms are initially transformed into spectra using a fast Lomb-Scargle periodogram algorithm (Lomb 1976; Scargle 1982), but once the bandpass solutions are roughly known, a more refined bandpass is calculated using the FROID algorithm (described below).
The metrology data must then be adjusted to account for atmospheric dispersion effects. Since the delay lines are not evacuated, light suffers a residual optical path difference due to the change in the index of refraction of air with wavelength, . Furthermore, the shape of the curve is a function of the air’s temperature, pressure, and relative humidity. Temperature within the instrument is kept fixed, but pressure can vary significantly over hour timescales, so these drifts must be factored out. Humidity is also seen to change on a seasonal basis. We adopt Ciddor’s formula (Ciddor 1996) to describe . Using this equation, the delay values for each channel can be corrected according to:
| (2) |
where is the optical path difference uncorrected (corrected) for the chromatic nature of , and 0.63281641 m is the effective wavelength of the HeNe laser, which sets the fringe period of the metrology data. (The base HeNe wavelength at STP is 0.63281646 m, but the AOMs blueshift the laser beams by 40.0055 MHz.) Atmospheric temperature, pressure, and humidity corrections can yield wavelength calibration offsets equivalent to radial velocity shifts of hundreds of meters per second, so this correction procedure is critical for achieving the highest possible RV accuracy. We note that variations in the 11 kHz modulation frequency have a negligible effect on the final velocity calibration so long as LIA can lock on to the modulation. Also, the frequency fluctuation in the laser will result in small velocity variations ( 0.3 m/s) which we are currently not capable of measuring.
In addition to the dispersion correction, the interferograms need to be corrected for the effects of atmospheric scintillation, telescope guiding errors, and changing atmospheric transparency. This is a crucial step, because intensity fluctuations of the input signal might otherwise masquerade as interferometric fringing signals (c.f. C track in Figure 5). In theory, because the A and B interferograms are complementary (), we should be able to use their sum as a normalizing factor, and distinguish flux variations from fringes. This approach requires that the A and B spectral channels be precisely aligned, and the system throughput as a function of for both A and B must be well-characterized. In practice, it is easier and more reliable to use the unfringed C track to evaluate the photometric variations, and normalize each channel of the the A and B interferograms using the closest spectral channels in C, in case the flux variations are not perfectly gray.
With dispersion-adjusted and flux-corrected interferograms in hand, and with a priori knowledge of the central wavelength and bandpass of each channel from the white light data, we reconstruct the high-resolution spectrum for each channel using the Fourier Reconstruction of Optical Interferogram Data (FROID) algorithm, which we have developed in conjunction with the dFTS instrument. The goal of this algorithm is to infer the narrowband channel spectrum whose interferogram produces the best least-squares fit to the data interferogram. FROID has proven to be considerably more robust than traditional Fourier algorithms when dealing with unevenly-sampled interferogram data, and is faster as well. The mathematical underpinnings and implementation of FROID are discussed in detail in Appendix B.
The individual channel spectra are then flux-weighted (using the white light spectral bandpasses as a template) and coadded, yielding a high-resolution, broadband spectrum for the observed target. We show sample FROID-derived spectra for an iodine absorption cell and assorted stars in the following sections.
4 Performance Evaluation with Calibration Light Sources
To demonstrate that high-resolution spectra can be reliably extracted from the dFTS interferograms, and to evaluate the short-term and long-term wavelength stability of the instrument, we have undertaken observations of two calibration light sources: a molecular iodine absorption cell and a thorium-argon emission line lamp. All calibration measurements were taken with the dFTS in situ at the Clay Center Observatory, not in a laboratory setting, so that we can test the instrument performance under realistic observing conditions. In other words, the lamp light is transported to the guider box at the telescope and then into the dFTS through the same light path and under the same environmental conditions as the starlight. The results of these experiments show that systematic errors in the dFTS wavelength scale are on the order of a few m/s. This result illustrates the suitability of the instrument for precision stellar velocimetry.
4.1 Iodine absorption spectra
As noted previously, the rich absorption spectrum of molecular iodine serves as a wavelength reference for many of the traditional planet-hunting programs. We use it to illustrate the spectral resolving capabilities of the dFTS instrument and FROID algorithm. We sent light from a 100W incandescent bulb through an iodine vapor cell and focused it upon an optical fiber, which we coupled into the dFTS fiber feed at the telescope. The iodine cell was kept at a stabilized temperature of C inside a small oven. We acquired eight interferogram scans in close succession, using delay sampling similar to that used for stellar targets. The interferograms were then turned into broadband spectra using the FROID reduction pipeline. Figure 6 shows a broad region of one such spectrum, with the molecular band heads and closely spaced absorption lines. Figure 7 zooms in on a smaller spectral range, so that individual lines can be discerned, and overplots the eight separate spectra, with vertical offset for clarity. The close agreement in the line shapes and positions shows that the FROID algorithm accurately reconstructs high-resolution spectra from the sparsely-sampled interferogram data.
4.2 Thorium-argon emission-line measurements
For accurate velocimetry of stars at the m/s level, we must be sure that the wavelength scale of our instrument remains constant over extended timescales. The frequency of the HeNe laser used in our metrology system is supposed to remain constant within 0.5 MHz with respect to 473 THz (equivalent to an RMS scatter 0.3 m/s), but we cannot take this specification on faith. We must also worry about small drifts in the alignment between the metrology and starlight beams within the interferometer, which could change the relative path lengths and thus introduce systematic errors in our wavelength scale.
Interferogram observations of emission-line lamps provide a straightforward means of evaluating the stability of the dFTS. We have made time-series observations of the rich line spectrum of a Spectral Instruments thorium-argon discharge tube, driven by a stabilized APH 1000M Kepco power supply. Thorium-argon spectra are often used as wavelength references in traditional dispersive spectrographs, and therefore can be relied upon to serve as a fixed reference source for these tests of the dFTS. We observe our lamp source at least three times during each night that we are collecting stellar data, as well as collecting more extensive calibration time series on cloudy nights.
To reduce the thorium-argon scans, we select several dozen of the strongest emission lines, extract and normalize interferograms for each of them, and fit them with model interferograms comprising one to four line components. (This approach is effectively a simplified version of the FROID algorithm, optimized for the emission-line case.) By tracking the change in the best-fit line wavelength for each line over a sequence of scans, we compute an RV curve for each line, and then coadd these curves, weighted by the mean strength of each line, to get a final RV curve. The A and B tracks of the instrument are reduced separately as a consistency check, and to separate random and systematic error sources; RV variation due to photon Poisson noise, for instance, will affect A and B tracks independently, while drifts in the reference laser wavelength or changes in alignment between the laser and thorium-argon beams within the interferometer will show up as correlated RV changes.
Figure 8 plots the RV values for 20 consecutive thorium-argon scans spread out over 15 hours. A and B tracks are analyzed and plotted separately. The independent time series of RVA and RVB exhibit rms scatter of 2.76 m/s and 2.74 m/s, respectively, while the mean time series RVRVRV has an rms scatter of 2.29 m/s. The rms scatter of the difference RVRVB is 3.06 m/s, so assuming Gaussian noise distributions, we can decompose the error signal into a systematic component with rms 1.70 m/s and a random component with rms 2.16 m/s. Hints of the systematic error signal can be seen by eye as correlations between the A and B RV curves in the figure.
Figure 9 illustrates the RV stability of the instrument over a longer baseline of approximately 6 months. These RV points have been calibrated on a night-by-night basis, using odd-numbered thorium-argon observations as a reference for the even-numbered observations, as we would do for interleaved stellar and thorium-argon observations. This additional calibration is necessary to compensate for week-to-week changes in alignment between the beams within the interferometer, which induce m/s shifts in the uncalibrated wavelength scale. The rms scatter of the mean velocity RVAB is 3.62 m/s. As before, we can decompose the separate A and B RV data into systematic and random contributions. For the long-term data set, we find rms(systematic) m/s and rms(random) m/s.
We are looking forward to improving the performance of the dFTS, procuring a brighter lamp source, and improving the quality of the wavelength calibration reduction software to push the wavelength calibration to a higher level of precision. In this way, we will be in a better position to comment on the factors limiting the accuracy of the velocities emerging from a dFTS.
5 Stellar Radial Velocity Results
Initial stellar observations were made on the grounds of the US Naval Observatory, using a Celestron 11-inch telescope to feed a long fiber leading inside to our optics laboratory, where the dFTS prototype was located. We observed Arcturus ( Boo, KIII, ) on the nights of May 22 and June 20, 2002. The acquired interferograms show good fringe contrast, and the observed spectrum is a good match to the model spectrum (Kurucz 1994). By cross-correlating against this template spectrum, we derive a best-fit topocentric radial velocity (RV) for each observation. The minima (Figure 10) are relatively sharp, and RV values within each night are closely grouped together. The May and June observations give significantly different mean topocentric RV values, because of the change in the Earth’s velocity vector over one month, and the RV trend within each night (Figure 11) shows variation due to Earth’s rotation.
In October 2003, we moved the dFTS instrument to the Clay Center Observatory at the Dexter-Southfield School in Brookline, Massachusetts. Their 25-inch DFM telescope regularly achieves excellent image quality, with stellar FWHMs under 1 arcsec, due to an extensive dome venting system and vibrational isolation from the building atop which the observatory is located. This imaging performance is thus well-suited for maximizing throughput of the fiber feed system, which brings starlight from the telescope down to an instrument room located underneath the dome. After a protracted commissioning period, we started regular stellar observations in July of 2005, with a particular focus on spectroscopic binaries and exoplanet systems. The parameters for our primary targets are listed in Table 1, and radial velocity results are detailed below.
We used two different analysis pathways to measure stellar radial velocities from our interferometric observations. The first pathway uses the traditional technique of spectral cross-correlation. We derived high-resolution spectra from our interferogram data using the FROID algorithm, as described previously, and then performed a dual cross-correlation, simultaneously comparing the A-track and B-track spectra for a given stellar observation to a template spectrum appropriate for the star’s spectral type. Initial templates were drawn from the synthetic spectrum library of Munari et al. (2005), and subsequent templates were constructed by zero-shifting, co-adding, and smoothing all the observed spectra of a star. The best-fit topocentric velocities were shifted into the barycentric frame using the IRAF bcvcorr task. We estimated internal error bars for each RV measurement by measuring the width of the minimum at the level , which corresponds to a error interval for the measured quantity.
As an alternative to the cross-correlation approach, we also developed an analysis algorithm which directly compares the observed interferogram data to synthetic interferograms derived from a template spectrum. We scan through a range of template RVs, generating a different interferogram for each RV value, and then measuring the quality-of-fit between model and observed interferograms via , to find the RV value that gives the best agreement. In essence, we are performing the spectral cross-correlation without leaving Fourier space. This synthetic interferogram fitting (SIF) algorithm returns similar RV values to the traditional spectral cross-correlation, and provides a largely independent verification of our FROID results.
5.1 Procyon
Procyon ( Canis Minoris, HR 2943) is the brightest of our primary stellar targets, at . Although it is a binary system, the orbital period is approximately 40 years, so over short timespans, the primary serves as a velocity standard, allowing us to check the RV stability of the instrument on a high-SNR stellar target. Figure 12 shows the derived barycentric radial velocity of Procyon over a two-week interval. The RV values deviate from their mean with an rms of 38.4 m/s. Using SNR scaling arguments, we find that most of this RV scatter can be attributed photon noise. To verify this conclusion, we undertook a series of simulations, using a synthetic spectrum of a F5V star, broadening it to match Procyon’s linewidth, and then constructing a series of 16 artificial interferograms with the same delay sampling grid and mean flux level as the actual observations. We added Poisson noise and CCD read noise to the simulated observations, and then analyzed these interferograms in the same fashion used for the actual data. The resulting RV values exhibited an RMS scatter of 34.9 m/s from the actual velocity, so it appears that photon noise is the dominant contributor to the error budget for these observations. Future observations with a more efficient dFTS on a larger telescope should therefore achieve proportionately better RV accuracy.
Shifting all of our observations to a common RV and coadding the spectra, we also find that our absorption line profile shapes and depths closely match those from the McDonald Observatory spectral atlas of Procyon (Allende Prieto et al. 2002). Figure 13 illustrates this comparison over a small subset of the full instrument bandpass.
5.2 Andromedae and Geminorum
To test whether the dFTS system can accurately detect RV variations in a stellar target, we observed an assortment of spectroscopic binaries, including Andromedae (HR 8961). The RV results are plotted in Figure 14. Because And is nearly 30 times dimmer than Procyon, the RV errors are correspondingly larger due to photon noise statistics, but we still clearly detect the sinusoidal velocity variation due to the unseen stellar companion, and our best-fit orbital solution ( days, m/s) closely matches the last published orbit (Walker 1944) with days and m/s. The rms scatter of our RV points from the curve is 435 m/s, a factor of 2 larger than the mean internal error bar, perhaps indicating that stellar variability or convective motions are contributing additional RV noise.
We also observed Geminorum (HR 2973). This star rotates somewhat faster than typical for its spectral type, perhaps due to tidal spin-up by its unseen companion, and its photospheric absorption lines are therefore wider, which broadens the peak of the cross-correlation and yields greater RV uncertainty. The measured RV points (Figure 15) still agree well with the model RV curve, with an rms of 463 m/s. As with And, the rms scatter is larger than the internal error estimates. We derive days and km/s, as compared to Duemmler, Ilyin, & Tuominen (1997), who find days and km/s. Our period measurements are not as precise because of the limited timespan of our observations, but the uncertainty in velocity amplitude is small, demonstrating the precision of the dFTS.
5.3 Pegasi
The star Pegasi (HR 8315) is actually a triple system, with two equally bright components in a 12 year orbit, and an unseen component orbiting one of the bright stars with a 6 day period. We observed this multiple system over a range of dates spanning several orbital periods, and then employed a simple 2-dimensional cross-correlation algorithm (similar to that described by Mazeh & Zucker 1994) to extract independent RV solutions for both bright components. The RV data for the sharp-lined SB1 component are presented in Figure 16, and once again, we find excellent agreement between our observations and the previously-determined ephemeris. Our points scatter around the curve with an RMS of 990 m/s, which compares quite favorably to the 30 m/s scatter achieved by Konacki (2005) on the same target using the Keck I telescope (with the light-gathering area of the Clay Center telescope).
5.4 Bootis
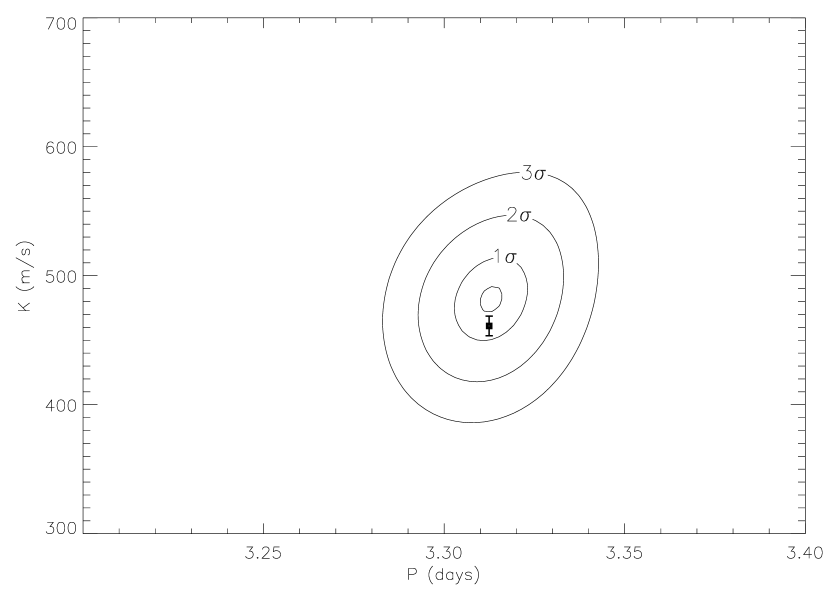
We also observed three known exoplanet host stars, in an effort to detect the “wobble” in stellar RV induced by the unseen planetary companions. We clearly detect the short-period RV variation in Bootis, as shown in Figure 17, and derive days, m/s, nearly identical to the orbital parameters reported in Butler et al. (2006). Via fitting of sinusoidal orbits to our RV points, we construct a map in the parameter space, showing the range of potential orbital solutions (Figure 18). The literature solution lies well within our error contour. This result demonstrates that even on a small telescope, the prototype dFTS can measure stellar RVs with sufficient accuracy to find exoplanets.
We also observed Andromedae (a 3-planet system) and Draconis (a highly elliptical 1-planet system), and made tentative planet detections in both cases. For And, our RV data fit a weakly-constrained sinusoid with period and velocity amplitude similar to the published parameters for planet ‘b,’ although there are other regions of the parameter space with minima nearly as deep as the best-fit solution. We consider this orbital fit to be a detection of the planet. In the case of Dra, we started observations just shortly after the periastron passage in mid-2005, so we unfortunately missed the large anticipated “zigzag” in velocity. Subsequent observations over the following year, however, do show a monotonic change in stellar RV, as expected from the orbital predictions of Frink et al. (2002).
5.5 Performance analysis
The photon efficiency of the dFTS instrument is low compared to modern dispersive spectrographs. Based on count rates from stellar observations, we estimate that the total system throughput, including atmosphere, telescope, fiber feed, instrument optics, and CCD quantum efficiency, is 0.7%. Given the prototype nature of dFTS, our optics were not optimally coated, so we take a significant hit from the optical surfaces that a photon encounters before reaching the final focal plane. The Canon 135 mm f/2 camera lens is particularly bad in this regard — we measure a throughput of 4–12%, depending on wavelength. Future versions of the dFTS will be able to achieve much higher photon throughput, by utilizing antireflection-coated lenses and high-reflectivity dielectric mirrors, minimizing the number of fold mirrors, and replacing a photographic SLR lens with a custom camera lens.
Another metric for evaluating the performance of an instrument is its efficiency at turning detected photons into radial velocity information. The RV precision on a given stellar target depends not only on the spectrograph’s performance and the photon flux, but also on the spectral type and linewidth of the star itself. A greater number of absorption lines, greater line depth, and sharper lines all increase the accuracy of the RV determination. In Figure 19, we show how measured RV precision varies with stellar spectral type, using the rms scatter (RV) from each star’s best-fit orbit as a diagnostic. In addition to the primary stellar targets discussed previously, we include several other late-type stars which we also observed with dFTS. The (RV) values for these additional stars were estimated from the internal error bars from cross-correlation and SIF analysis, because there were not enough RV measurements to calculate a reliable rms, or, in the case of Arcturus, because stellar pulsations cause RV “jitter” well above the measurement accuracy of a single observation. The dashed lines in the plot indicate the expected trend of RV precision with photon counts, assuming Poisson noise is the dominant noise, (i.e. . Our stars do not lie neatly along one of these lines. Instead, we see a strong dependence on spectral type (which determines how many strong absorption lines are found within our instrument’s bandpass) and linewidth (which affects the ability to accurately centroid a given spectral line). The cooler, later-type stars with narrower linewidths yield lower values, while those with broader or fewer lines are towards the top of the plot. Among stars with similar spectral types and linewidths, we see that the relationship is generally followed — compare, for instance, Boo, And, and Procyon. By improving the photon throughput of the instrument, and using larger-aperture telescopes, we therefore expect to achieve stellar RV accuracies closer to the 1 m/s level.
6 Conclusions
We have presented the concept, design, theory, and operation of the dFTS instrumentation. Our results indicate that the dFTS is a competitive instrument for Doppler velocimetry for stellar binaries and exoplanet detection, as well as providing high-quality, high-resolution spectra for general stellar astrophysics.
The key to acquiring broadband optical spectra with reasonably high sensitivity is the chromatic dispersion of the interference fringes with a grating. This process creates a multiplexing sensitivity gain equal to the resolving power of the grating. By calibrating the optical path within the interferometer with a metrology laser as the metric, the dFTS is free to operate at wavelengths not possible with spectrometers calibrated with iodine absorption cells. Our use of a blue-violet bandpass has resulted in an improved ability to convert photons into Doppler velocities as compared to the more commonly used red bandpass. In addition, the spectrum from the dFTS is pure; it is free of the absorption lines from calibration sources, it faithfully reproduces all temporal frequencies due to symmetric and regular sampling of the fringe packet, and it can be corrected for the instrumental line spread function with a high degree of precision. (In fact, one of the inspirations for the dFTS concept was the publication of a technique for removing instrumental profiles from echelle spectra (Butler et al. 1996; Valenti, Butler, & Marcy 1995).) At first glance, the long term performance of the dFTS is stable at the few m/s level. Further investigations, which include a refined metrology algorithm to remove the cyclic bias inherent to heterodyne metrology systems, are required before we can comment further on the achievable systematic error floor.
Our prototype instrument contains several conveniences and shortcuts which are suboptimal, particularly as regards the system throughput and photon efficiency. As a result, the stellar RV results from our commissioning observations are limited primarily by photon noise statistics, and performance would benefit greatly from better photon efficiency. To this end, we are currently constructing dFTS2, which is an improved version of the prototype dFTS described in this paper. Not only has the photon efficiency of dFTS2 been increased by reducing reflections and optimizing coatings, but the resolving power of the grating has been boosted with an image slicer, resulting in further sensitivity increases. The optical design of dFTS2 will achieve resolving powers of with a 1 arcsec “slit size” on telescopes as large as 3.5 meters, and yet the instrument enclosure displaces less than 2 cubic meters, significantly smaller than an echelle spectrograph with equivalent spectral resolving capability. Given the advantages of combining high spectral resolution and accuracy with small size and low cost, dFTS instruments may, with further development, prove to be broadly useful instruments for a wide variety of astronomical research topics.
Appendix A The sensitivity advantage of spectral multiplexing
Consider a telescope collecting a stellar flux of photons s-1 m (we have expressed using units of wavenumber instead of wavelength). An interferogram with measurements at delays is obtained with a mean level of photons per lag for a given spectral channel, where is the bandwidth of the channel, is the central wavenumber of the bandpass, is the resolving power of the grating, and is the integration time at each delay. The spectral resolving power implied by the maximum optical path difference is given by:
| (A1) |
where is the spacing in wavenumber between adjacent spectral intensities and is the total range of optical delay.
In the following analysis, we consider the data from a single spectral channel. Since the integral of the spectral intensities over the spectral bandwidth is equal to the intensity, , at the peak of the central fringe of the interferogram, the mean spectral intensity (i.e. the mean signal level of the spectrum) is just divided by the spectral bandwidth, . Assuming that the fringe contrast is 100%, then is just equal to the mean level of the interferogram, and the mean spectral intensity is:
| (A2) |
On average, the noise level in the interferogram is determined according to Poisson statistics:
| (A3) |
Rayleigh’s Theorem states that the total noise power in the spectral and lag domains is equal:
| (A4) |
where is the average spectral noise power per pixel, and is the average noise power in the interferogram per pixel. The above expression is an approximation based on the simplification of the integral expression, and is strictly-speaking true only when the spectrum/interferogram is flat. We combine Equations (2), (3), (4) and (5) to compute the signal-to-noise ratio in the spectrum:
| (A5) |
Not surprisingly, the number of samples in the interferogram (), is directly proportional to the number of independent spectral values, , across one channel:
| (A6) |
and Equation (6) becomes:
| (A7) |
The constant is of order unity. For the case of the conventional FTS, = 1. Equation (8) demonstrates that is directly proportional to for a constant integration time (), source brightness (), observing wavenumber (), and spectral resolving power (). Sensitivity is gained with greater multiplexing.
Appendix B The FROID algorithm
We begin with two significant departures from conventional approaches to spectral reconstruction from FTS data. The first is that we solve the inverse problem by taking advantage of our knowledge about the forward problem. Given a model spectrum, , we solve the forward problem by obtaining the interferogram, , that would result from that model spectrum. The inverse problem is then solved by modifying the model spectrum until the model interferogram obtained from the forward problem best matches the observed data, . This approach is the opposite of the standard strategy of solving the inverse problem by deconvolving the impulse response from . The advantages of this procedure are numerous, including an improved ability to correct for the deleterious effects of finite and realistic sampling, a more honest way to treat noise statistics, and a more Bayesian treatment which will afford the ability to incorporate prior information (Bretthorst 1988). However, solving the forward problem generally places higher demands on computer processing, resulting in longer runtimes as compared to deconvolution algorithms.
The second deviation from conventional methodology is that we choose a continuous model spectrum rather than a spectrum that is defined only at discrete points. Conventional methods apply Fourier Transforms to discretely sampled data and return discretely sampled transforms. As we show below, conventional Fourier Transforms introduce substantial artifacts in spectra reconstructed from a sparsely sampled interferogram. This situation is analogous to that seen in direct Fourier inversion of sparse aperture data from imaging spatial interferometers, where distinguishing sidelobe structure from real source structure is problematic.
We present two approaches to estimating spectra from sparsely sampled interferograms. In the first method (hereafter, Method # 1), we allow only the spectral intensities to vary and assume that the position of the central fringe is exactly known. The second method (hereafter, Method # 2) also permits variation of the lag corresponding to the central fringe in the interferogram.
B.1 Method # 1: Variation of the Spectral Intensities
Use of this algorithm assumes that the location of the central fringe is known, and that the interferogram has been shifted in delay so as to force the zero optical path difference to occur at the exact maximum of the central fringe. We begin with an initial model at a set of spectral intensities, , where spans a wavenumber range defined by the edges of a single narrowband channel and is the ratio of the desired resolving power of the FTS to the resolving power of the grating. All spectral intensities outside this range are not free parameters, and are set to zero. The algorithm is robust in the sense that the final result is very insensitive to the quality of the initial guess of the spectral intensities.
We then approximate the spectrum between and with a linear interpolation between and . This linear-piecewise model of the spectrum results in an interferogram, the value of which at each of the lags is given by
| (B1) |
where:
| (B2) |
The integral can be solved analytically, so Equation (A1) becomes:
| (B3) |
where
| (B4) | |||||
| (B5) |
The constants and are defined by the sampling in the lag and spectral spaces and need not be recalculated for each iteration. The mean-square difference between the model interferogram and the data interferogram is given by:
| (B6) |
We now desire the model spectrum which yields a model interferogram that best matches the data interferogram. We can write this condition as a set of equations minimizing :
| (B7) |
To complete the statement of the problem we need to calculate the derivatives, which are analytic:
| (B8) | |||||
| (B9) | |||||
| (B10) |
B.2 Method # 2: Variation of the Spectral Intensities and Central Lag
The interferogram is symmetric about the zero optical path difference since the spectrum itself is real. As a result, one would think that determining the zero optical path difference would be trivial. However, localizing the central lag is significantly complicated by sparse sampling, and the inferred position is generally dependent on the noise level, sampling of the interferogram, and finally, the detailed shape of the spectrum. In this paper, we assume that the spectrum is unknown, a priori. Additional information can be incorporated to improve the convergence of the algorithm, depending on the application.
In Method # 2, we allow the central lag as well as the spectrum to vary. As expected, this process provides more information than Method # 1, at the cost of reduced numerical stability: a noiselike initial guess for the spectrum and, more importantly, a random guess for the central lag, are not always sufficient to properly reconstruct the spectrum and central lag.
We proceed exactly as above, except that we explicitly write an expression for as a function of , the lag corresponding to the zero optical path difference in the interferogram [i.e., ]:
| (B11) |
The derivatives of with respect to are the same as in Method # 1, except that . The additional derivative that is relevant to the solution of this problem is given by:
| (B12) |
where:
| (B13) |
and:
| (B14) |
| (B15) | |||||
and we have used the definition . In this implementation, and (analogous to and in Method # 1) are functions of the sampling in the lag and spectral domains, as well as .
References
- Aldenius, Johansson, & Murphy (2006) Aldenius, M., Johansson, S., & Murphy, M.T. 2006, MNRAS, 370, 444.
- Allende Prieto et al. (2002) Allende Prieto, C., Asplund, M., López, R.J.G., & Lambert, D.L. 2002, ApJ, 567, 544.
- Baranne et al. (1996) Baranne, A., Queloz, D., Mayor, M., Adrianzyk, G., Knispel, G., Kohler, D., Lacroix, D., Meunier, J.-P., Rimbaud, G., & Vin, A. 1996, A&AS, 119, 373.
- Brault (1985) Brault, J.W. 1985, in High Resolution in Astronomy, 15th Advanced Course of the Swiss Society of Astrophysics and Astronomy, eds. A. Benz, M. Huber and M. Mayor, (Geneva Observatory: Sauverny), p. 3.
- Bretthorst (1988) Bretthorst, G.L. 1988, Bayesian Spectrum Analysis and Parameter Estimation, Springer-Verlag, p. 3.
- Butler et al. (1996) Butler, R.P., Marcy, G.W., Williams, E., McCarthy, C., Dosanjh, P., & Vogt, S.S. 1996, PASP, 108, 500.
- Butler et al. (2006) Butler, R.P., Wright, J.T., Marcy, G.W., Fischer, D.A., Vogt, S.S., Tinney, C.G., Jones, H.R.A., Carter, B.D., Johnson, J.A., McCarthy, C., & Penny, A.J. 2006, ApJ, 646, 505.
- Ciddor (1996) Ciddor, P.E. 1996, Appl. Optics, 35, 1566.
- Cooper et al (2001) Cooper, B., Potter, A., Killen, R., & Morgan, T. 2001, JGR, 106, 32803.
- Duemmler et al (1997) Duemmler, R., Ilyin, I.V., Tuominen, I. 1997, A&AS, 123, 209.
- Erskine (2003) Erskine, D.J. 2003, PASP, 115, 255.
- Erskine et al (2003) Erskine, D.J., Edelstein, J., Feuerstein, W.M., & Welsh, B. 2003, ApJ, 592, L103.
- Fawzy, Youssef, & Engvold (1998) Fawzy, D.E., Youssef, N.H., & Engvold, O. 1998, A&AS, 129, 435.
- Frink et al (2002) Frink, S., Mitchell, D.S, Quirrenbach, A., Fischer, D.A., Marcy, G.W., Butler, R.P. 2002, ApJ, 576, 478.
- Ge et al. (2006) Ge, J., van Eyken, J., Mahadevan, S., DeWitt, C., Kane, S.R., Cohen, R., Vanden Heuvel, A., Fleming, S.W., Guo, P., Henry, G.W., Schneider, D.P., Ramsey, L.W., Wittenmyer, R.A., Endl, M., Cochran, W.D., Ford, E.B., Martín, E.L., Israelian, G., Valenti, J., Montes, D. 2006, ApJ, 648, 683.
- Jennings et al (1986) Jennings, D.E, Deming, D., Weidemann, G.R., & Keady, J.J. 1986, ApJ, 310, L39.
- Kerber et al (2006) Kerber, F., Nave, G., Sansonetti, C.J., Bristow, P., Rosa, A., Käufl, H.-U., & Rosa, M.R. 2006, SPIE, 6269, 83.
- Konacki (2005) Konacki, M. 2005, ApJ, 626, 431.
- Krasnopolsky, Maillard, & Owen (2004) Krasnopolsky, V.A., Maillard, J.P. & Owen, T.C. 2004, DPS 36 1127.
- Kurucz (1994) Kurucz, R. 1994, IAU Colloquium 146: Molecules in the Stellar Environment, Copenhagen, 24-29 May 1993, (ed. by U.G. Jorgensen), Berlin: Springer-Verlag, pp. 282-295.
- Lomb (1976) Lomb, N. 1976, Ap&SS, 39, 447.
- Lovis et al. (2006) Lovis, C., Pepe, F., Bouchy, F., Lo Curto, G., Mayor, M., Pasquini, L., Queloz, D., Rupprecht, G., Udry, S., Zucker, S. 2006, SPIE, 6269, 23.
- Marcy & Butler (1998) Marcy, G.W., & Butler, R.P. 1998, ARA&A, 36, 57.
- Mazeh & Zucker (1994) Mazeh, T. & Zucker, S. 1994, Ap&SS, 212, 349.
- Michelson (1891) Michelson, A.A. 1891, Phil. Mag., 31, 256.
- Michelson (1892) Michelson, A.A. 1892, Phil. Mag., 34, 280.
- Mosser, Maillard, & Bouchy (2003) Mosser, B., Maillard, J.-P., & Bouchy, F. 2003, PASP, 115, 990.
- Munari et al (2005) Munari U., Sordo R., Castelli F. & Zwitter T. 2005, A&A, 442, 1127
- Pourbaix et al (2004) Pourbaix, D., Tokovinin, A.A., Batten, A.H., Fekel, F.C., Hartkopf, W.I., Levato, H., Morrell, N.I., Torres, G., & Udry, S. 2004, A&A, 424, 727-732.
- Ridgway (1984) Ridgway, S.T., & Brault, J.W. 1984, ARA&A, 22, 291.
- Scargle (1982) Scargle, J. 1982, ApJ, 263, 835.
- Valenti (1995) Valenti, J.A., Butler, R.P., & Marcy, G.W. 1995, PASP, 107, 966.
- Walker (1944) Walker, E.C. 1944, JRASC, 38, 249.
- Ying et al (2005) Ying, Y., Lu, H., Fu, X., Liu, Y., Xu, H., Yu, H. 2005, SPIE 5996, 433.
| spectral | ||||||
|---|---|---|---|---|---|---|
| star name | binarity | orbital period | (km/s) | type | ||
| Procyon | 0.3 | visual double | 40 years | F5 iv–v | 25 | |
| And | 3.9 | SB1 | 20.52 days | 6.6 | G8 iii | 20 |
| Gem | 4.3 | SB1 | 19.61 days | 34.2 | K1 iii | 13 |
| Peg | 4.2 | triple | 5.97 days | 42.0 | F5 iv | 18 |
| Boo | 4.5 | 1 planet | 3.31 days | 0.461 | F6 iv | 28 |
Note. — Orbit parameters from Pourbaix et al. (2004) and Butler et al. (2006)