A very bright, highly magnified Lyman-break galaxy at .
Abstract
We report the discovery using Hubble Space Telescope imaging and Keck spectroscopy of a very bright, highly magnified () Lyman Break Galaxy (LBG) at in the field of the massive cluster MACS J2135.20102. The system comprises two high-surface brightness arcs with a maximum extent of , bracketing a central object which we identify as a massive early-type galaxy at . We construct a lens model which reproduces the main features of the system using a combination of a galaxy-scale lens and the foreground cluster. We show that the morphological, spectral and photometric properties of the arcs are consistent with them arising from the lensing of a single LBG. The most important feature of this system is that the lensing magnification results in an apparent magnitude of , making this one of the brightest LBGs known. Such a high magnification provides the opportunity of obtaining very high signal to noise (and potentially spatially resolved) spectroscopy of a high redshift galaxy to study its physical properties. We present initial imaging and spectroscopy demonstrating the basic properties of the system and discuss the opportunities for future observations.
Subject headings:
cosmology: observations — galaxies: individual (LBG J213512.73010143) — galaxies: evolution — galaxies: formation1. Introduction
Some of the most compelling science drivers from the extragalactic research field for the construction of Extremely Large Telescopes (ELT) involve investigating the internal dynamics of the gas and stars, and the chemical abundances of these components, in faint high-redshift galaxies (Hook 2005). This requires a combination of high spatial-resolution and high signal-to-noise spectroscopy which only the largest telescopes can provide. These observations will yield insights into the physical properties of star-formation in the early Universe. Yet some of these scientific questions can be tackled with the current generation of 10-m-class telescopes, when aided by the natural magnification provided by a gravitational lens. Such lens-aided studies are already providing some of our most sensitive views of the distant Universe, with lensing surveys for faint sources out to the highest redshifts (Kneib et al. 2004b) and across a range of wavebands (e.g. Ellis et al. 2001; Smail et al. 2002; Metcalfe et al. 2003; Santos et al. 2004; Kneib et al. 2004a).
In terms of our understanding of the internal properties of high redshift galaxies, the studies of the gravitationally lensed Lyman break galaxy (LBG) cB58 by Pettini et al. (2000, 2002) have demonstrated that high-signal-to-noise spectra of typical LBGs can be obtained with 10-m telescopes, if they are highly magnified as a result of being serendipitously positioned behind a suitable foreground gravitational lens. cB58 has an apparent magnitude of and represents a magnified image of an LBG at . The studies of this object have yielded a wealth of information on the metallicity and energetics of the interstellar medium in a young star-forming galaxy (Pettini et al. 2002). The only drawback with these studies is the difficulty in drawing wide-ranging conclusions from a single object, and hence the urgent need to find other examples of similarly highly magnified galaxies. To this end, several deep imaging surveys of clusters have been undertaken to search for highly magnified LBGs using - and -band dropout selection (e.g. Smail, Edge & Ellis 1998; Stern et al. 2004). The difficulty for these surveys is the presence of large numbers of red galaxies in the clusters, whose spectral properties are sufficiently similar to the target population to be a significant source of contamination and so far they have not yet yielded any highly magnified, high-redshift galaxies as bright as cB58. Similarly, attempts to use the wide area coverage of the Sloan Digital Sky Survey (SDSS) to identify rare intrinsically bright or highly magnified LBGs (Bentz et al. 2004), have until recently only uncovered an unusual class of AGN with weak restframe UV emission lines (Ivison et al. 2005). However, Allam et al. (2007) have just announced the discovery of a bright lensed LBG using data from SDSS.
In this letter we present the discovery of a galaxy, LBG J213512.73010143, which appears as two highly-magnified arcs with an apparent magnitude of , making it slightly brighter than cB58. We assume a cosmology with , and km s-1 Mpc-1, giving angular scales of 4.7, 7.3 and 7.8 kpc arcsec-1 at , and respectively. All quoted magnitudes are AB.
2. Observations and Reduction
2.1. HST Imaging
We obtained a 1.2-ks Hubble Space Telescope (HST) ACS F606W image of MACS J2135.20102 on 2006 May 8th, as part of our Snapshot program (GO# 10491, PI: H. Ebeling). This program targets high-luminosity X-ray clusters to both identify bright lensed galaxies and constrain the cluster mass distributions. MACS J2135.20102 is a high-luminosity X-ray cluster at cataloged by Ebeling, Edge & Henry (2001). The ACS exposure comprised three 400 s exposures dithered with a LINE pattern and a 3′′ spacing. The data were reduced using multidrizzle v2.7 to provide an image with 0.05′′ sampling and good cosmetic properties.
![[Uncaptioned image]](/html/astro-ph/0611486/assets/x1.png)
Fig. 1.— An HST ACS F606W image of LBG J213512.73010143 showing the twin arcs (labeled as North, N, and South, S) around a compact source, G1. Arc N has several bright knots with a symmetric appearance, along with a low-surface brightness extension to the west which has a different radius of curvature. Arc S has a bright knot at each end, connected by low-surface brightness emission. The two arcs are not concentric and we mark their centers of curvature by “X”. The pairs of dotted lines indicate the alignment of the spectroscopic slits in our Keck LRIS observations. The inset to the upper-left displays the same field at a higher contrast, while the inset at the lower-left shows a true color SDSS image of the source and we indicate the direction to the cluster center.
A visual inspection of the HST image by two of us (ACE/AMS) identified an unusual object at 21 35 12.730 01 01 42.9 (J2000), lying approximately 75′′ due north of the brightest cluster galaxy (21 35 12.08 01 02 58, J2000). In the HST ACS image, Fig. 1, the object appears as two non-concentric arcs, enclosing a central compact object and is reminiscent of a “Cosmic Eye”. We denote the northern and southern arcs as N and S respectively and the central source as G1. Interestingly, the centers of curvature of N and S do not coincide, lying WSW and NE of G1 respectively (Fig. 1). The radii of curvature are 1.0′′ for N, which is nearly perfectly circular, and 1.5′′ for S, which is more flattened. The faint, western extension of N has a radius of curvature of 1.3′′.
A search of the SDSS DR4 shows that this object is well-detected with a total magnitude of , consistent with the HST measurement of for the light from both arcs, and , and for N, S and G1 respectively. The arcs are unresolved across their width, with apparent FWHM of along their whole lengths: 2.2′′ for N and 2.8′′ for S, yielding axial ratios of and respectively. In contrast, G1 has a FWHM of with an ellipticity of at a P.A. of 105 deg. (i.e. aligned along the major axis of the arcs).
2.2. Keck Spectroscopy and Imaging
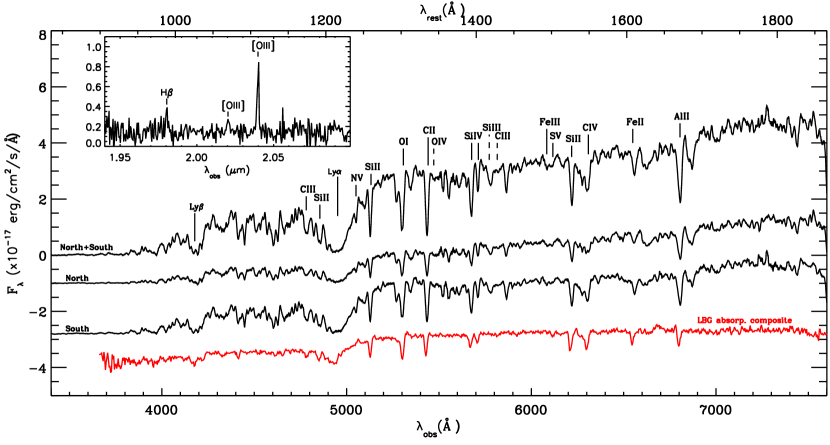
The morphology of this source is strongly suggestive of gravitational lensing, with G1 identified as the primary lens. In addition, the SDSS colors are blue (, and ) but with a red color indicating a spectral break short-ward of the -band and hence a probable high redshift, –4. As such we observed the system as a high priority with the LRIS spectrograph on the Keck I telescope on the night of 2006 June 30 in good transparency and seeing. The system was observed at two position angles (P.A. of 55 and 120 degs, see Fig. 1) to cover both arcs and G1. We employed the 600 l/mm grism in the blue arm, blazed at 4000Å, and the 400 l/mm grating in the red arm, blazed at 8500Å, giving wavelength coverage from the atmospheric cutoff out to Å. The total integration at each P.A. was 3.6 ks. The spectra were reduced with standard iraf and idl routines to yield fluxed, wavelength-calibrated spectra. We show the individual spectra for each arc and the total combined spectrum in Fig. 2. A spectrum was also extracted for G1.
In addition, we obtained a 2.4-ks exposure with NIRSPEC on Keck II on the night of 2006 July 24. This observation, taken at P.A. of 55 deg., covered the entire -band window and detected continuum and a series of narrow emission lines from the eastern component of S (see the inset in Fig. 2). Finally, we obtained a -band image of the system with the NIRC near-infrared imager on Keck I on the night of 2006 July 4. The total exposure time was 1.14 ks as 19 individual 60-s exposures in 0.5′′ seeing. The image detects and resolves both arcs and the central galaxy, G1.
3. Analysis and Discussion
3.1. Source Properties
The LRIS spectra (Fig. 2) show that the two arcs have blue continua with a series of strong absorption features and spectral breaks which unambiguously identify the source redshift at . As Fig. 2 shows, the absorption features in the combined spectrum are similar to those in the subset of the LBG population which exhibit Ly in absorption (Shapley et al. 2003). In particular, we see strong absorption from species in the interstellar medium (ISM) of the galaxy, as well as broad, blueshifted absorption in the Civ 1550 and Oi 1302 lines, both of which are observed in typical LBGs. One distinctive difference is that the Ly absorption line in the arcs is stronger than in typical LBGs and indicates a significant Hi column density of N(Hi ( times higher than cB58, Pettini et al. 2000). We qualitatively compare the spectrum with the predictions from the Starburst99 model (Leitherer et al. 1999, 2002) and the IUE spectra of O/B stars in de Mello et al. (2000). The strength of the Civ 1550 absorption, the lack of an associated red emission wing and the relative weakness of the Siiv 1400 absorption suggest that the luminosity weighted stellar population in the arcs is dominated by early B-type supergiants, indicating either a Myr-old burst of star formation or on-going activity over a similar or slightly longer period, but with a stellar IMF deficient in O-type stars.
Analysis of the spectra for the individual subcomponents of the arcs shows no evidence for velocity offsets between the internal components of N and S, as expected if they are both multiply imaged. We derive redshifts, from fits to individual photospheric absorption lines (Oiv 1343.4, Siiii 1417.2, Ciii 1427.8 and S v 1501.8), for S of and for N of (all errors are bootstrap estimates). We caution that these features are individually weak, but they suggest that there is no significant velocity offset between the two arcs ( km s-1). However, a comparison of the spectra of the two arcs does show some marked differences: the profiles of the Ly, Ly and the stronger ISM lines differ between N and S, and the continuum appears redder in S, indicating that N and S are images of different sources, either two galaxies, or more likely two regions within a single galaxy (consistent with the lens reconstruction).
We also measure the redshifts of the strong ISM lines in the two arcs obtaining and for single Gaussian fits to the lines in S and N respectively, using Siii 1260.4, Oi 1302.2 Cii 1334.5, Siiv 1402.8, Siii 1526.7 and Alii 1670.8. Looking at the stronger ISM lines in the composite spectrum in more detail shows that they comprise at least three separate components: a weak one at and two stronger ones at and . The reddest component has a redshift consistent with the photospheric and nebular emission line estimates (see below) suggesting it arises in gas at the systemic redshift of the system. For the bluer ISM lines, we derive blueshifts of km s-1 for the stronger line and km s-1 for the weaker. These are consistent with outflows of material from the galaxy in the form of a wind and the velocities are comparable to those seen in typical LBGs by Steidel et al. (2007). Turning to the continuum emission we measure a restframe UV spectral slope for the composite spectrum between 1200–2000Å of which implies A or (Calzetti et al. 2000). We also see a sharp decline in flux as we move blue-ward of Ly, with little detectable emission shortward of 930Å in the restframe.
In the near-infrared spectrum available for the eastern component of S we see three narrow emission lines corresponding to H, [Oiii] 4959 and [Oiii]5007, with unresolved restframe FWHM of km s-1 (corrected for the instrumental resolution). These features indicate a redshift for the emission line gas in the system of which we adopt as the systemic redshift for the galaxy.
Finally, the LRIS spectrum of G1 shows a strong continuum break around 6900Å and several features which we identify as Ca H&K, G-band and [Oii] 3727 at . The [Oii] 3727 line has an equivalent width of just 7.5Å, indicating modest star formation activity. Thus the likely lens appears to be an early type spiral behind the cluster, and from the width of the G-band and Ca H&K lines in the spectrum we estimate a central velocity dispersion of km s-1. In addition to this galaxy, we also serendipitously detect a further two galaxies which show [Oii] 3727 at indicating the presence of a structure at this redshift.
Turning to the broadband imaging, we compare the morphology of the arcs as seen in the NIRC -band image to the HST ACS F606W image. This shows no evidence for strong color variations within or between the two arcs, although the difference in resolution in the two bands and the presence of the lens makes this comparison difficult. In addition, we see no evidence for a second lens in the system – with the position of G1 agreeing well between the optical and near-infrared images. We find that the arcs dominate the integrated light from the system from the - to -bands: measuring and for the combined arcs and and for G1. The color of G1 matches that of an early type spiral or S0 at , while the -band magnitude yields , indicating it is a galaxy (consistent with its measured velocity dispersion and the Faber-Jackson relation).
3.2. Lensing Model
To interpret the properties of this system in more detail we have developed a lens model for the system using the semi-linear inversion method of Warren & Dye (2003). The lens model includes not only a mass component for G1, but also a significant external shear from the mass distribution in the foreground cluster at , which is essential to reproduce the non-concentric configuration of the two arcs. The best-fit parameters for the galaxy-scale mass component are in good agreement with the observed light distribution and velocity dispersion of G1 – the mass is centered on G1 with an ellipticity of at a P.A. of deg and a velocity dispersion km s-1. The cluster contributes an additional shear of along a direction tangential to the cluster center, which produces the offset in the centers of curvature of N and S. This lens model suggests a combined magnification for the arcs of . The model forms the arcs N/S from lensing of a single, extended background source with a scale size of kpc. However, to reproduce the faint western extension of N we require a second background source, offset from the primary source by ( kpc). The proximity of these two sources means that they likely represent two star forming knots within a single galaxy. In this regard, we note that if the galaxy wasn’t lensed, it would appear as a single elongated source even in deep ACS imaging. A more detailed description of the mass model for the lensing galaxy is given in Dye et al. (2007).
3.3. Intrinsic Properties
Having determined the magnification of the system we can estimate the intrinsic luminosity of the background galaxy. Firstly we note that the characteristic apparent magnitude of LBGs from Shapley et al. (2001) is . Hence the combined -band magnitude of the arcs N/S corresponds to an apparent luminosity of ! Correcting for the lensing magnification of , the arcs’ intrinsic apparent magnitude translates to , consistent with for the LBG population (c.f. Allam et al. 2007). Similarly, comparing the colors of the arcs, , with typical LBGs from Shapley et al. (2001), which have , we find that the arcs are slightly redder than the typical LBG but are within the 1- scatter for the population.
Finally, to estimate the star formation rate in the galaxy we use the -band continuum magnitudes of the arcs to determine a restframe 1500Å luminosity of ergs s-1 Hz-1, which translates into a star formation rate of 640 M⊙ yr-1, adopting a Salpeter IMF with an upper-mass cut-off of 100 M⊙ (Kennicutt 1998) and without any correction for reddening or magnification. Correcting for the estimated magnification and UV reddening we derive an intrinsic star formation rate of M⊙ yr-1.
4. Conclusions
We report the discovery of a LBG at which is seen as a pair of arcs with an apparent magnitude of , equivalent to . This very bright apparent magnitude results from gravitational lensing by a galaxy at and a cluster at which provide a combined magnification of . Correcting for this magnification we show that LBG J213512.73010143 (the “Cosmic Eye”) is a compact LBG with moderate dust reddening, , and a star formation rate of M⊙ yr-1. We illustrate the wide range of spectral features which can be identified in a modest signal-to-noise, moderate-resolution spectrum of the galaxy and look forward to future observations at higher signal-to-noise and resolution. The importance of this system is the opportunity it provides to obtain restframe UV, mid-infrared and millimeter wavebands observations of a typical LBG at the resolution and signal-to-noise which will only become available for unlensed examples with the commissioning of ELTs, the James Webb Space Telescope (JWST) or the Atacama Large Millimeter Array (ALMA) respectively. Such observations will provide unique information on the elemental abundances, star formation, gas mass and dynamics of this young galaxy, facilitating a range of studies including the calibration of the various indicators proposed to trace the metallicity of gas in distant galaxies. This system can thus act as a path-finder for the science which will be done with ELTs, JWST and ALMA when they are completed.
References
- (1) Allam, S.S., Tucker, D.L., Lin, H., Diehl, H.T., Annis, J., Buckley-Greer, E., Frieman, J.A., 2007, ApJL, submitted (astroph/0611138)
- (2) Bentz, M.C., Osmer, P.S., Weinberg, D.H., 2004, ApJ, 600, L19
- (3) Calzetti, D., Armus, L., Bohlin, R.C., Kinney, A., Koornneef, J., Storchi-Bergmann, T., 2000, ApJ, 533, 682
- (4) Campusano, L.E., Pelló, R., Kneib, J.-P., Le Borgne, J.-F., Fort, B., Ellis, R.S., Mellier, Y., Smail, I., 2001, A&A, 378, 394
- (5) Dye, S., et al., 2007, in prep.
- (6) Ellis, R.S., Santos, M.R., Kneib, J.-P., Kuijken, K., 2001, ApJ, 560, L119
- (7) Ebeling, H., Edge, A.C., Henry, J.P., 2001, ApJ, 553, 668
- (8) Hook, I. M. (Ed.), 2005, ”The Science Case for the European Extremely Large Telescope: The next step in mankind’s quest for the Universe”
- (9) Ivison, R.J.,Smail, I., Bentz, M., Stevens, J.A., Menendez-Delmestre, K., Chapman, S.C., Blain, A.W., 2005, MNRAS, 362, 535
- (10) Kennicutt, R.C., 1998, ARAA, 36, 189.
- (11) Kneib, J-P., van der Werf, P., Kraiberg Knudsen, K., Smail, I., Blain, A.W., Frayer, D., Barnard, V., Ivison, R., 2004a, MNRAS, 349, 1211
- (12) Kneib, J-P., Ellis, R.S., Santos, M.R., Richard, J., 2004b, ApJ, 607, 697
- (13) Leitherer, C., et al., 1999, ApJS, 123, 3.
- (14) Metcalfe, L., Kneib, J.-P., McBreen, B., Altieri, B., Biviano, A., Delaney, M., Elbaz, D., Kessler, M.F., et al., 2003, A&A, 407, 791
- (15) de Mello, D.F., Leitherer, C., Heckman, T.M., 2000, ApJ, 530, 251.
- (16) Pettini, M., Steidel, C.C., Adelberger, K.L., Dickinson, M., Giavalisco, M., 2000, ApJ, 532, 96
- (17) Pettini, M., Rix, S., Steidel, C.C., Adelberger, K.L., Hunt, M.P., Shapley, A.E., 2002, ApJ, 569, 742
- (18) Santos, M.R., Ellis, R.S., Kneib, J.-P., Richard, J., Kuijken, K., 2004, ApJ, 606, 683
- (19) Smail, I., Edge, A.C., Ellis, R.S., 1998, PASA, 15, 267
- (20) Smail, I., Ivison, R.J., Blain, A.W., Kneib, J.-P., 2002, MNRAS, 331, 495
- (21) Shapley, A.E., Steidel, C.C., Adelberger, K.L., Dickinson, M., Giavalisco, M., Pettini, M., 2001, ApJ, 562, 95
- (22) Shapley, A.E., Steidel, C.C., Pettini, M., Adelberger, K.L., 2003, ApJ, 588, 65
- (23) Steidel, C.C., et al., 2007, in prep.
- (24) Stern, D., van Dokkum, P.G., Nugent, P., Sands, D.J., Ellis, R.S., Sullivan, M., Bloom, J.S., Frail, D.A., Kneib, J.P., Koopmans, L.V.E., Treu, T., 2004, ApJ, 612, 690
- (25) Warren, S., Dye, S., 2003, ApJ, 590, 673