The broad band spectrum and variability of NGC 4151 observed by BeppoSAX
Abstract
We present an analysis of all BeppoSAX observations of NGC 4151. This source was observed 5 times from 1996 to 2001 with durations ranging from a day to four days. The intrinsic continuum (described as a cut-off power law), is absorbed at low energies by a complex system: a cold patchy absorber plus a warm uniform screen photoionized by the central continuum. We find that this “dual absorber” is the main driver of the observed variability, up to a factor of eight, at 3 keV. In particular the covering fraction of the cold absorber changes on time scales of the order of a day, supporting its association with the Broad Line Region. The column density of the warm gas varies on a longer time scale (months to year). Some of the small amplitude spectral variability above 10 keV can be explained with an intrinsic variation (with variation of the photon index ). The flux below 1 keV remains constant confirming an extended origin. Its spectrum is reproduced by a combination of a thermal component (with temperature keV) and a power law with the same slope as the intrinsic continuum but with an intensity a few per cent. A Compton reflection component is significantly detected in 1996 (averaged value of , with the solid angle covered by the reflecting medium), with intensity decreasing on time scale of year, and it desappears in 2000 and 2001. The long time scale of variations argues for an association with an optically thick torus at a distance of few light years. An iron line was detected in all spectra. Its energy is consistent with fluorescence by cold iron. We find that the line is variable. Its behaviour is reproduced by a variable component proportional to the level of the reflection flux plus a constant component. The flux of the latter is consistent with the extended line emission observed by Chandra. We conclude that the first component is likely arising from the torus and the second is produced in the extended Narrow Line Region.
Key Words.:
Galaxies: Seyfert; X-rays: galaxies; Galaxies: individual: NGC 41511 Introduction
The Seyfert galaxy NGC 4151 is one of the brightest AGN. It has been considered for years the prototype of its class and, as such, has been extensively studied at all wavelengths (see Ulrich 2000 for a review). In X-rays its spectrum is the most complex observed so far in AGN, being characterized by narrow and broad spectral features from soft to hard X-rays (e.g. Perola et al. (1986); Zdziarski et al. (1996); Zdziarski et al. (2002)). The central X-ray continuum is absorbed below a few keV by a (complex) absorber with column density cm-2 associated with the Broad Line Region (BLR, Reichert, Mushotzky & Holt (1986)). This absorption in NGC 4151 allows to reveal the presence of soft X-ray components below 1 keV, associated with a scattering component and a thermal plasma with a low temperature of keV (Perola et al. (1986); Pounds et al. (1986); Weaver et al. 1994b ) as those observed in type 2 objects (e.g. Antonucci (1993); Matt et al. (1997)).
At higher energies NGC 4151 shows an iron line which remains remarkably constant notwithstanding large variations of the continuum (Perola et al. (1986); Schurch et al. (2003)). Observations by Chandra (Ogle et al. (2000)) have indeed shown that most of the line is produced in the Narrow Line Region (NLR). The iron line site of Seyfert 1 galaxies has often been associated in the past with an accretion disk (e.g. Tanaka et al. (1995); Fabian et al. (2000)). XMM-Newton and Chandra observations have shown that a narrow line component is a common feature in Sy 1s (Reeves et al. 2001; Pounds et al. 2001; Matt et al. 2001; Kaspi et al. 2001). Further insight on the nature of the reprocessing medium should also become available through measurements of the reflection component. Recent INTEGRAL observation (Beckmann et al. (2005)) described the hard X-ray/soft-gamma spectrum of NGC 4151 with a Compton continuum from hot electrons (100 keV) in an optically thick (=1.3) corona plus a reflected component from a cold material subtending a solid angle of .
NGC 4151 has been one of the first Seyfert 1 galaxy with a well established evidence of changes of the spectral index correlated with the luminosity (Perola et al. (1986); Yaqoob et al. (1993)). With the increased bandwidth and sensitivity of present instrumentation, this feature appears to be present in other Seyfert 1 galaxies (e.g. 1H 0419-577, Page et al. 2002; NGC 3783, De Rosa et al. 2002; MCG-6-30-15, Vaughan & Edelson 2001; NGC 5548, Petrucci et al. 2000, Nicastro et al. 2000; NGC 7469, Nandra et al. 2000; IC 4329A, Done et al. 2000; Mkn 509, De Rosa et al. 2004, Zdziarski et al. (2003)). In summary, in the broad X-ray range from 0.1 to 200 keV, NGC 4151 represents a case study of the common properties (absorption/scattering medium) of type 1 and type 2 objects, of AGN environment from light-day to kpc, and of investigation of the properties of the intrinsic continuum.
In this paper we present the results of the complete set of observations by BeppoSAX performed in 1996, 1999, 2000 and 2001. The observations and data reduction are described in Section 2. A model-independent variability study is presented in Section 3. The broad-band spectral analysis is reported in Section 4 and discussed in Section 5. Our conclusions are drawn in Section 6.
2 BeppoSAX observations and data reduction
NGC 4151 was observed by BeppoSAX (Piro, Scarsi & Butler (1995); Boella et al. (1997)) several times: in July 1996, December 1996, January 1999, December 2000 and December 2001. The log of the observations is given in Table 1.
The first observation, part of the Science Verification Phase (SVP), was originally planned to last for about 3 days. However the pointing was interrupted for 1 day and then restarted 2 days after. In the observations in 1996 the three MECS units, the HPGSPC and the PDS were operated. The LECS was always on, with the exception of the second part of the observation in July 1996. From January 1999 onward two MECS units, the LECS and the PDS were operating.
The data of all instruments were reduced using standard
procedures (Fiore, Guainazzi & Grandi (1999)). A BL Lac object is located away from NGC 4151. The count rates are 2 per cent and
20 per cent of that of NGC 4151 for the MECS and LECS respectively. For
the MECS we adopted the standard extraction circle of , in which
the contribution of the BL Lac is negligible ( per cent).
In the extraction of spectra and light curves of LECS we excluded
a circle of of radius centered on the BL Lac object, while
adopting the standard source extraction radius of . We estimate
a residual contribution of the BL Lac of per cent,
comparable to the statistical errors. The PDS spectra filtered
either with fixed or variable rise time thresholds did not show
any significant difference. The latter method is more suited to
sources fainter than NGC 4151, so we have adopted data derived
with the first method.
In Figure 1 we show the light curves of the LECS (0.1–2
keV), MECS (2–10 keV) and PDS (13–100 keV). The MECS (2–10 keV)
counts rate during the July 1996 observation changed by a factor of
two on time scales of one day, from a low state (hereafter J96L)
to a high state (J96H). The intensity during the December 1996
observation was constant (D96), and quite similar
to the J96L state, then low. Also the observation in December 2000 (D00)
was constant. In January 1999 the average flux was at an
intermediate level between the Low and High states defined above.
During the observation the source flux exhibited a slow increase
in the first part of the observation (J99L1), reached a peak
(J99H) and then started to decrease (J99L2). The time scale was
days, with an amplitude of (max to min).
The PDS (13–100 keV) light curve follows the same pattern of
variability of the MECS, but with a reduced amplitude: for example
the ratio high to low states in July 1996 is for the
MECS and for the PDS (Table 1). On the
reverse the LECS (0.1–2 keV) count rate, with the exception of December
2001 (D01), does not show significant variability: the small difference
( per cent, see Table 1) of level between different observations
is consistent with the
effect of grid obscuration of the source (Fiore, Guainazzi & Grandi (1999)), placed in
different positions in the three observations. The different behaviour in
December 2001 will be discussed in Section 4.6.
Considering the substantial amount of spectral variability shown
by this object, we have produced separate spectra for each of the
above mentioned states, in which (2–10 keV) variations are
per cent.
Hereafter errors and upper limits on spectral parameters
correspond to , i.e. 90 per cent confidence level for a
single parameter of interest. Spectral power indexes refer to
photon distribution. In spectral fitting the normalizations of
LECS, HPGSPC and PDS relative to the MECS have been left free to
vary within the current ranges of uncertainty: LECS/MECS: 0.7–1.0;
HPGSPC/MECS=0.95–1.1; PDS/MECS=0.77–0.95.


| Date | LECS (0.1–2 keV) | MECS (2–10 keV) | HPGSPC (8–20 keV) | PDS (13–200 keV) | ||||
|---|---|---|---|---|---|---|---|---|
| cnt rate2 | cnt rate2 | cnt rate2 | cnt rate5 | |||||
| 6-10/7/96 (J96L) | 6 | 56 | 26 | 26 | ||||
| “ (J96H) | - | - | 15 | 7 | 8 | |||
| 4-7/12/96 (D96) | 13 | 48 | 23 | 19 | ||||
| 4-6/1/99 (J99L1) | 14 | 36 | - | - | 16 | |||
| “ (J99H) | 10 | 27 | - | - | 13 | |||
| “ (J99L2) | 10 | 20 | - | - | 9 | |||
| 22-23/12/2000 (D00) | 4 | 19 | - | - | 9 | |||
| 18-21/12/2001 (D01) | 43 | 114 | - | - | 53 | |||
| Note: 1 net exp. time in ks; 2 s-1. For the MECS we indicate the total rate of all MECS unit operating; 3 3 MECS units; 4 2 MECS units; 5 s-1 per half detector | ||||||||
3 Spectral ratios
The spectral ratios derived comparing the spectral states observed during our campaign are presented in Figure 2. This allows us to derive a model-independent description on the spectral variability of the source. We note the following:
-
1.
Below 1 keV the flux remains constant, notwithstanding the large variations showed at E 2 keV. The low energy spectrum is thus to be dominated by constant component(s) (Perola et al. (1986); Pounds et al. (1986); Zdziarski et al. (1996)). This means that some absorber has to suppress any variable intrinsic component at low energies. Around 0.6–0.7 keV the ratio D01/D00 shows evidence of a changing of the opacities of the warm gas. We will discuss this effect in Section 4.2.
-
2.
The 2–10 keV range is characterized by the largest variability, up to a factor of in the 2–3 keV range. The spectrum gets steeper when the flux increases (J96H/J96L, J99H/J99L1, D01/D00, J99H/J96L). This happens both on short (days) and long time scales (years). This behaviour has been attributed to intrinsic spectral variations correlated with the luminosity on time scale as short as few hours (Yaqoob et al. (1993); Perola et al. (1986)), and to variations of the absorber on month-year time scales. Warwick et al. (1995) and Weaver et al. (1994b) instead attributed all variations to changes of absorber structure. We will assess this issue through a broad band spectral fitting (see Section 4.1).
-
3.
Above 10 keV two kind of behaviour are apparent. a) The spectral ratios relative to observations performed within day are all consistent with a constant (J96H/J96L: , J99L2/J99L1: and J99H/J99L1: ). b) The spectral ratios relative to observations performed over time scales of months-years are not (J96H/J99H: , and D01/D00: , and J99H/J96L: ). This is a new result that, as it will be shown in Section 4.3, bears important implications on the origin of the reflection component.
In the next sections we will present a detailed quantitative analysis of these results, through detailed spectral deconvolution.


4 Broad-band (0.1–200 keV) spectral modelling
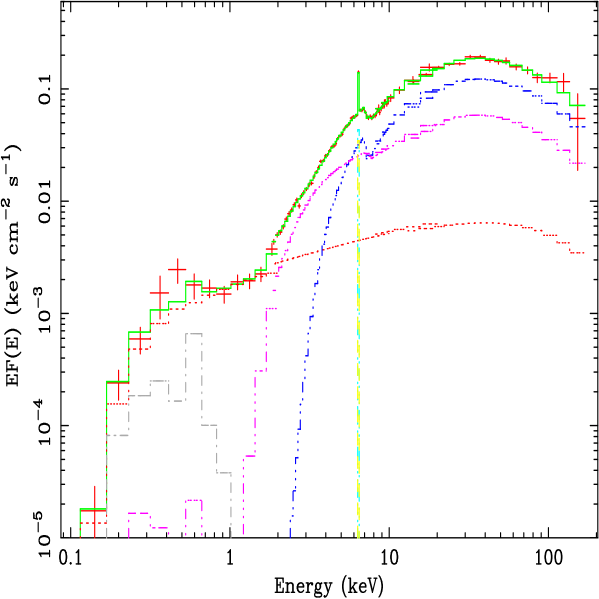
On the basis of previous observations and models developped in previous published work, to fit the BeppoSAX broad-band spectra (with all the instruments in the energy range specified in Table 1), we adopted a spectral template model (baseline model BLM), which includes the following components:
A. The intrinsic continuum is described by a power-law with an e-folding energy .
B. A Compton reflection component (PEXRAV model in XSPEC, Magdziarz & Zdziarski (1995)), with the cosine of inclination angle of the reflector fixed to . We assume elemental abundances from Anders & Grevesse (1989).
C. A narrow iron line modeled with a gaussian profile with the intrinsic width set to 10 eV.
D. The soft X-ray spectrum ( keV) is a combination of a thermal component model (MEKAL) with the temperature fixed to 0.15 keV and a scattering component (i.e. a power-law with the same slope of the intrinsic hard continuum but with a different normalization).
E. The complex absorber is reproduced with a dual absorber model. A fraction of the source is covered by a cold column density . An additional uniform and photoionized gas is responsible for additional absorption of the spectrum at low energies and for a midly ionized Fe edge at 7.3–7.5 keV (FeVII-FeVIII) (ABSORI model in XSPEC Done et al. (1992)).
This photoionized gas is characterized by a temperature = K, a column density and a ionization parameter , where is the source luminosity between 5 eV and 300 keV, is the hydrogen number density of the gas and its distance from the central ionizing source. The Fe abundances in the cold and warm absorbers and in the reflection component are tied together and left free during the fit.
Our model assumes that only the e-folded power-law with reflection (i.e. the intrinsic continuum), is subject to complex absorption. Additional absorption through the Galaxy is applied to all the emission components ( cm-2).
The BLM model is shown in Figure 3. In the upper panel in Figure the spectrum with model of J96L is plotted with all the different spectral components while in the lower panel two spectral states with a flux variation of a factor of 3 (see Table 2) are shown: December 2000 and December 2001. We applied this template to all the BeppoSAX spectra in the different flux level states (see Table 1 and light curves in Figure 1). The best fit parameters and the reduced values are shown in Table 2, while the data/model ratio for each spectrum is plotted in Figure 4. In the case of July 1996 high state (when LECS data are not available) the parameters of the soft components (thermal emission and scattering component) are frozen to those derived for the spectrum in July 1996 low state.
| Period | |||||||||||||||
| J96L | 2.04 | 10.5 | 96.5/77 | ||||||||||||
| J96H | 3.01 | 13 | 76.5/67 | ||||||||||||
| D96 | 2.01 | 11 | 64.1/77 | ||||||||||||
| J99L1 | 2.72 | 13 | 61.7/72 | ||||||||||||
| J99H | 3.38 | 16.5 | 85.7/72 | ||||||||||||
| J99L2 | 2.44 | 13 | 73.0/72 | ||||||||||||
| D00 | 1.01 | 5.9 | 71.2/72 | ||||||||||||
| D01 | 2.66 | 14 | 71.4/72 | ||||||||||||
| Note: (1) e-folding energy in keV; (2) in keV-1 cm-2 s-1; (3) in cm-2 s-1 at the line; (4) in cm-2; (5) in erg cm s-1; (6) in ; (7) in cm-3 ; (8) in keV-1 cm-2 s-1; ∗ These parameters are frozen to their values of best fit computing the errors. | |||||||||||||||


The broad-band baseline model described above provides a good fit to all the spectra of NGC 4151 (Table 2). In the following sections we discuss the various spectral components and their variability.
4.1 The origin of the spectral variability in the 2–10 keV range and the intrinsic power law
The source has always shown - in all the observations performed so far and including ours - a systematic trend: the spectrum gets softer when the flux increases. The origin of this behaviour is one of the key issue in this source.
The broad band fit (presented in Table 2) shows that the only spectral parameters showing significant changes, which can be related to the 2–10 keV spectral variability, are those of the absorbing media. Indeed, a decrement of the effective absorption (i.e. of and/or ) results in a softer spectrum, as appears when comparing the spectral ratios presented in Section 3 with the best fit parameters in Table 2. For example, the softening observed from J96L to J96H (Figure 2) is reproduced by decreasing the column densities of the two absorbers and the covering fraction (Table 2). On the contrary the intrinsic photon index does not show significant evidence of variation around the average value of . A variation would still be consistent with the errors, but it could not itself account for the large spectral changes observed in this range. While most of the spectral variability observed in the 2–10 keV range is due to variation of the absorbers, a minor effect of intrinsic variations can not be excluded. This is demostrate by fitting the spectra with the intrinsic photon index given by the F2-10keV relation found by Perola et al. (1986): with in erg cm-2 s-1. The results of these fits are reported in Table 3 and show that in all spectra a good is obtained.
| Period | ||||||||||||||
| J96L | 2.04 | 96.4/78 | ||||||||||||
| J96H | 3.01 | 73.2/68 | ||||||||||||
| D96 | 2.01 | 65.6/78 | ||||||||||||
| J99L1 | 2.72 | 61.9/73 | ||||||||||||
| J99H | 3.38 | 86.2/73 | ||||||||||||
| J99L2 | 2.44 | 73.1/73 | ||||||||||||
| D00 | 1.01 | 74.8/73 | ||||||||||||
| D01 | 2.66 | 70.3/73 | ||||||||||||
| Note: (1) e-folding energy in keV; (2) in keV-1 cm-2 s-1; (3) in cm-2 s-1 at the line; (4) in cm-2; (5) in erg cm s-1; (6) in ; (7) in cm-3; (8) in keV-1 cm-2 s-1;∗ These parameters are frozen to their values of best fit computing the errors. | ||||||||||||||
4.2 The complex absorber
With the exception of the 2001 observation, the cold absorber is characterized by cm-2 and , similar to that found by Weaver et al. (1994b), who adopted the same model of this analysis on ASCA data. The model employed for the warm gas with 1–16 erg cm s-1 indicates an iron edge at energy around 7.3–7.6 keV, consistently with other measurements (Yaqoob et al. (1993); Weaver et al. 1994a ; Weaver et al. 1994b ; Schurch et al. (2003)). With the exception of D01, the iron abundance is times greater than the solar value. We will show later how D01 is peculiar in respect to several points.
With regard to the variability of absorbers, we note the following. Due to the fit with such a complex model, the errors on the absorbers parameters are wide. However we note that the column density of the warm absorber appears to show the most significant variations in respect to those of the cold absorber. We have therefore chosen to fix the column density of the cold absorber to the average value cm-2. This is consistent, within the errors, with all the best fit values except D01. In addition we have fixed the spectral index, as from the above discussion, to the value 1.6. The result and all the best fit parameters are reported in Table 4. The is still acceptable. The column density of the warm absorber changes over a time scale of month-years, while it is consistent with being constant over a day time scale. Specifically, in July 1996, cm-2, in D96 to D00 cm-2. On the contrary the covering fraction of the cold absorber shows variability in a day time scale. For example changing from 0.73 to 0.48 in the low and high state of July 1996.
The D01 spectrum appears to be rather peculiar with respect to the other states. We already noted that in this state the iron abundance is about 5 times that solar. In D01 the softening is reproduced with a substantial decrease of the thickness of both absorbers, with cm-2, cm-2. The covering fraction was also very low, . Basically, in the state observed by BeppoSAX in December 2001, most of the bare nuclear continuum came into view (Figure 3, lower panel). The D01 spectrum is peculiar also for the presence of an absorption feature at 9 keV. This state of the source is described and discussed in Piro et al. (2005).
| Period | * | |||||||
|---|---|---|---|---|---|---|---|---|
| J96L | 104/79 | |||||||
| J96H | 73/69 | |||||||
| D96 | 76/79 | |||||||
| J99L1 | 73/74 | |||||||
| J99H | 87/74 | |||||||
| J99L2 | 74/74 | |||||||
| D00 | 71/74 | |||||||
| D01 | 107/74 | |||||||
| Note: (1) keV; (2) in keV-1 cm-2 s-1; (3) in cm-2 s-1 at the line; (4) in cm-2 | ||||||||
4.3 The reflection component
The Compton reflection component is significantly detected in 1996 (both in July and December, with a mean value of the absolute normalization ), it is only marginally detected in 1999 (), while it is consistent with zero in 2000 and 2001 (see Table 4). This result remains true even when the photon index is not fixed (see Table 2 and Table 3). Thus we find that the reflection component is variable on time scales of years, while there is not strong evidence of variability on the (intra) day time scales that characterize the direct continuum. We can actually exclude variations correlated with those of the intrinsic continuum on such short time scales.
4.4 High-energy spectral variability
In Section 4.2 we have concluded that the spectral variability observed in the 2–10 keV range is dominated by variations of the absorber. At higher energies, although the effect of absorption is negligible, the assessment is also not straightforward due to the presence of the reflection component. For example, a constant absolute reflection component, added to a steep (constant slope) variable continuum (Schurch & Warwick (2002)), may also qualitatively mimic the correlation. It is then particulary relevant to discuss the high energy spectra in 2000 and 2001 when the reflection intensity is consistent with zero and then any intrinsic spectral variation can be observed without ambiguity. Between 10 keV and 200 keV the spectral ratio D01/D00 is not consistent with a constant ( per 15 degree of freedom), but shows a decreasing trend that can be reproduced with a change of the intrinsic slope between the two states of about (with the assumption of a constant high energy cut-off). This result is that expected on the basis of the correlation , where is changing by a factor of three between D00 and D01.


4.5 The iron line
We recall that, in our modelling, we have adopted a narrow gaussian profile for the line without any further component, following the results of Chandra and XMM-Newton (Ogle et al. (2000); Schurch et al. (2003)). Because the issue of the existence and origin of broad components in Seyfert galaxies is still under debate, it is relevant to underline how this is dependent upon a good modelling of the continuum, available thanks to the BeppoSAX broad-band data. In Figure 5 we show the residuals when the continuum is modelled by a simple uniform absorbed power law and the line shows evidence of a “red wing”. However, when the continuum is properly described with a dual absorber, the “red wing” – which is in fact due to the covered component – disappears.
The flux of the iron line in our spectra shows evidence of variability ( for a constant, chance probability P=0.0065), but these variations are not correlated with the intensity of the intrinsic continuum (correlation coefficient r=0.099). Interestingly the flux of the line is lower in D00 and D01 when the reflection component disappears. To explore this issue we plot in Figure 6 the line reflection intensity. A linear fit, plotted in the figure, is acceptable (, P=0.253) with , is in ph cm-2 s-1and in . This fit shows that when the reflection component is null, the line flux does not go to zero, identifying the presence of a constant line component in addition to the one that correlates with the reflection. While it is not statistically significant, it is nonetheless interesting to note that for large value of the reflection normalization, the line appears to saturate. This point will be discussed later.

4.6 The soft components
In the soft X-ray band the spectrum is well described by the combination of a power law continuum and a thermal plasma with =0.15 keV (see Table 2). In Table 5 we report the flux of these two components in the 0.1–1 keV range. The total flux in this range is is dominated ( 80 per cent) by a constant power law with , the remaining being attributed to the thermal component. We have computed the expected flux of the variable absorbed continuum in this energy range, finding that it is at most 1.5 per cent of the total. The only exception is the soft spectrum D01 where there is a contribution of the intrinsic continuum in 0.1–1 keV due to the effect of low absorption (see Table 2).
| Period | |||
|---|---|---|---|
| J96L | 6.6 | 1.4 | 5.1 |
| D96 | 6.6 | 1.2 | 5.4 |
| J99L1 | 6.7 | 2.3 | 4.4 |
| J99H | 6.8 | 3.0 | 3.8 |
| J99L2 | 5.4 | 0.6 | 4.8 |
| D00 | 4.7 | 0.7 | 4.0 |
| D01 | 8.1 | 1.6 | 5.5 |
| Note: Flux corrected for Galactic absorption, in erg cm-2 s-1. The J96H state in not reported because the missing of soft X-ray data from LECS (see Section 2). | |||
5 Discussion
5.1 The primary emission from the innermost region
The intrinsic continuum of NGC 4151 is well described by a power law with an exponential cut-off. The values of the high energy cut-off we found in the different flux level states are all consistent with the values observed in the Sy 1s by BeppoSAX (Perola et al. (2002)). This, together with the measure of the Compton reflection features that perfectly match with the averaged values observed in Sy 1s (Nandra & Pounds (1994)), suggests that NGC 4151 is an intrinsically average Seyfert 1 galaxy (Zdziarski et al. (2002)). The phenomenological model we employed to fit the intrinsic continuum (i.e. power-law with high energy cut-off), is a good description of a two-phase model involving a hot corona emitting medium-hard X-rays by Comptonization and a cold optically thick layer (the disk) that provides the soft photons to Comptonization (Haardt & Maraschi (1991); Haardt, Maraschi & Ghisellini (1997)). While the dual absorber is the main driver of the observed variability in 2–10 keV, we find small amplitude of intrinsic variations above 10 keV, that can be due to a variation of , according to the the correlation (Perola et al. 1986). Assuming a distance of 13 Mpc for the source, and a black hole mass of 4 we find that the ratio L/LE between the unabsorbed luminosity and the Eddington luminosity is in the range 0.002-0.006 in the lowest (D00) and highest (J99H) state respectively. The accretion is taking place in a sub Eddington regime.
5.2 The narrow iron line and the reprocessing region: NLR and molecular torus
The energy of the narrow line as determined from the average of all BeppoSAX observations is keV, i.e. consistent with fluorescence by cold iron. During our observations, the line flux shows evidence of variations (see Table 4). We find that the flux of the line is dependent upon the normalization of the reflection component, and that it attains a non-zero value ( ph cm-2 s-1) when the reflection is absent (in Figure 6 we plot the flux of the iron line as a function of the reflection amplitude). This suggests that the line is made up by two components. We first discuss the origin of the component at zero reflection. Our result indicates that this component is consistent with being constant, thus suggesting an extended origin. In addition, it should be produced by an optically thin gas. The flux we derive for this component is remarkably similar to the spatially resolved line emission region observed by Chandra (Ogle et al. (2000), ph cm-2 s-1). This region is coincident with the NLR, also in agreement with our conclusion of an optically thin gas.
The equivalent width of iron line in the case of an optically thin medium illuminated by an isotropic continuum is given by (e.g Inoue (1989); Piro (1993)):
| (1) |
where is the net solid angle covered by the medium (equal to the angular extension of the region multiplied by ). We can estimate the column density of the NLR , by adopting the typical values derived from optical observations of the size kpc, density () and filling factor (; e.g. Robinson et al. (1994)). By substituting these values in eq.(1) we derive an eV that is 2 orders of magnitude lower than observed (100-200 eV see Table 2). One possibility is that the ionizing flux is emitted anisotropically. Penston et al. (1990) showed that the ionizing flux needed to produce the observed optical and UV line emission had to be about 10 times stronger than that observed. Explanations for this excess include an anisotropic radiation field. But even in such a case, the expected would be lower of the observed value by a factor of 10. The presence of a system of clouds with higher density () can provide a more appealing explanation. In this hypothesis the column density of NLR would be cm-2, then from eq. 1 we get an equivalent width 200-300 eV, that is good agreement with the values we found. Spectral diagnostics of narrow lines in a sample of Seyfert nuclei that includes NGC 4151, reveals the presence of low density () and high () density clouds (Stasińska (1984)). Moreover, imaging of the NLR of NGC 4151 with HST shows the presence of regions whose density is likely to be enhanced by the shock compression of the ejected radio material (Winge et al. (1997)).
Let us now discuss the line component that is correlated with the reflection normalization, characterized by ph cm-2 s-1(see Figure 6). The line produced by reprocessing by a cold thick medium has an intensity ph cm-2 s-1where is a function depending on the geometry, and is equal to (substantially independent on the inclination angle) for simple configurations like a planar disk (Matt, Perola & Piro (1991)) describes the non-linear dependence of the line upon the iron abundance. For , the case of NGC 4151, it is (Piro (1993)), and the line flux should be ph cm-2 s-1, remarkably similar to the observed one for . Values of less than unity are expected in a geometrically and optically thick torus, where the reprocessing takes place mostly in the inner wall, i.e. in a cylindrical or conical geometry. This is due to the “secondary illumination” effect, produced by photons emerging from the wall at angles that intercepts the wall again. This effect enhances the efficiency of reprocessing and does it more for the photons of the reprocessed continuum than for those in the line, because a 6.4 keV photon has a high probability to be absorbed. For example, if the disk is in a conical configuration with an opening angle of , (Matt, Perola & Piro (1991)).
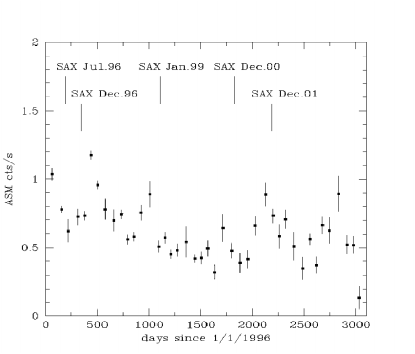
We now discuss the origin of the variability of the reflection component and the associated iron line. This could be due either to a variation of the illuminating continuum or to a change of the geometry of the reprocessing region. We recall that the intensity of the reflection decreases on a time scale of years by a factor of two or more from 1996 to 2000-2001 (see Table 4). The size of the reprocessing region is therefore to be of the order of light-years. The intensity of the reflection component thus traces the level of the illuminating continuum averaged and delayed over a time scale of year. We have therefore looked into the historical light curve of NGC 4151, to search for evidence of long time scale variability. In Figure 7 we report the light curve as observed by the ASM aboard of RXTE. Each point is the average flux over 2 months. The source shows a systematic decrease in its intensity by almost a factor of two from 1996 to 2000, consistent with the observed reflection variability.
The most obvious candidate for the reprocessing region is a thick torus whose inner walls are at light years away from the central source. Taking then into account the line and reprocessing intensities we estimate111A precise determination of the geometry of the reprocessor goes however beyond the scope of this paper. It would require detailed computations, that should take into account the non-linear effect of secondary illumination, the solid angle subtended by the inner surface of the torus towards the X-ray source and their exposed area towards the observer. that the distance of the inner region of the torus should be times its height. The ionizing continuum would therefore emerge from the torus within a cone of opening angle of , in agreement with the estimation based on the extended Narrow Line Region made by (Pedlar et al. (1983); Robinson et al. (1994)). Finally we note that the variability of the reprocessing component could alternatively be explained by a change of the height of the torus.
5.3 The X-ray absorbers and the BLR
BeppoSAX observations of NGC 4151 show the presence of a complex absorber system. In particular the intrinsic continuum is absorbed by a cold gas that partially obscure the central source and by a second uniform warmer gas. Our analysis shows evidence of variations in the status of the cold absorber on time scales of the order of the day and of the warm gas on longer time scale. Variations of the covered component can be produced if the cold medium is made up of clouds passing in the line of sight towards the central source (Reichert, Mushotzky & Holt (1986)). If we identify these clouds with the BLR, from the typical velocity of km s-1, we derive that the size of the central source cm. This would correspond, for Schwarzschild radii, to a black hole mass of , consistent with independent estimations (Clavel et al. (1987); Wandel, Peterson & Malkan (1999)). If the cloud velocity is due to the orbital motion, we derive that the distance of the clouds is a few light days, consistent with the size of the inner BLR in NGC 4151 (Clavel et al. (1987)).
In our fit we have associated the warm stage with a uniform screen covering the source. In doing so we are guided by the arguments put forward by Warwick et al. (1995) to solve the discrepancy between the X-ray and UV measurements of absorption. Upper limits on UV extinction (Kriss et al. (1992)) correspond to a column of assuming a standard gas-to-dust ratio. This compares to X-ray columns of . In our case, the level of photoionization is such that a substantial fraction of light elements as H, He and C are ionized (e.g. Krolik & Kallman (1984)), and therefore their absorption which is predominant in the UV range is reduced to a level compatible with UV measurements. We therefore associate the uniform absorber to the warm medium, while the patchy absorber is in a cold (neutral) stage.
Let us now characterize this warm medium we associated to the UV line absorbing system (Kriss et al. (1992)). From the relationship erg cm s-1, with erg s-1 and the lower limit on the density derived by UV observations, we obtain that the size of this region should be cm. This is consistent with the upper limit derived from the X-ray variability (cm) and the requirement that the medium be external to the BLR (cm). In conclusion, our data are fully consistent with the scenario in which the ionized X-ray absorber coincides with the system responsible of UV absorption lines. This system is composed by many clumps of dense material covering the broad line region, and produced by an outflow of the broad-line clouds (Kriss et al. (1992)).
The substantial decrease of the warm and cold absorbing gas in D01 together with the evidence, in the same spectrum, of an absorption feature at 8.5-9 keV suggests the presence of a multi-phase ionized absorber. This topic is widely discussed in Piro et al. (2005).
5.4 Low energy diffuse components: scattering and thermal
The low energy emission in NGC 4151 remains constant on time scales of the order of years, indicating an extended emission. We reproduced the soft X-ray spectrum with two components. One, dominated by emission lines, which is well fitted by a thermal plasma with keV with abundances comparable to solar. This is in agreement with Chandra observations (Ogle et al. (2000)) that demonstrated that most of the soft X-ray flux is extended and dominated by lines from a photoionized and collisionally ionized plasma. The other component is a power law with a normalization per cent (see Table 3) of that of the hard power law, which is likely to be produced by electron scattering of the central continuum, as in the case of Seyfert 2 galaxies (Antonucci (1993); Matt et al. (1997)). The fraction of this component in respect to the continuum is strongly dependent from the intrinsic flux. We expect the scatterd fraction increase when the source flux decreases if the nuclear continuum is scattered into our line of sight. Weaver et al. (1994a) in ASCA observation of NGC 4151 found a fraction scattered of 3–4 per cent for the high state and 5–6 per cent for the low state. In our BeppoSAX observations the upper value of the ratio A 10 per cent is obtained in the D00 spectrum when the continuum level was lower in respect to the other states.
6 Conclusions
In this paper we presented the broad-band (0.1–200 keV) BeppoSAX spectrum of NGC 4151. The source was observed 5 times from 1996 to 2001 with durations ranging from a day to four days. We find that the spectrum is complex characterized by several components. The continuum emission is well reproduced by a cut-off power law.
At energies less than 5 keV the continuum is strongly obscured by a dual absorber: a cold component, that we associated with the BLR clouds orbiting around a central source with a black hole with a mass of , characterized by cm-2, a covering fraction =0.3–0.7 and variable on time scales of days to years, and a second warmer uniform screen (with cm-2, variable on time scales of months-years), photoionized by the continuum emission and that we argue to be coincident with the UV absorbing region.
The low energies spectrum is reproduced by a combination of a two components, which are not absorbed by the cold and warm gas: a thermal one and a power law with the same slope of the intrinsic continuum but with the intensity which is a few per cent.
During our observations the source shows strong time variability energy dependent in time scales ranging from hours to years. In 0.1–2 keV it did not show any variability, while in 2–10 keV the variation was up to a factor of eight at 3 keV and three at 10 keV. In the PDS energy range (13–200 keV) the larger amplitude of variation was of a factor of three. We found that in 2–10 keV most of the spectral variability can be attributed to a variation of the absorbers. Instrinsic spectral changes can explain some of the smaller amplitude spectral variability above 10 keV.
We detected a Compton reflection component at high energy and the iron line at 6.4 keV. The intensity of the reflection component is significantly different from zero in 1996 while it disappears in 1999 and later (2000–2001). The size of this region, implied by the variability argument, as well as its optical thickness argue for an association with a geometrically and optically thick torus similar to that of Seyfert 2 galaxies. The study of the historical light curve of NGC 4151 suggests that the reflection component traces the level of the illuminating continuum averaged and delayed over a time scale of year. We found that the iron line flux is well described by two components: one is correlated with the reflection intensity and is associated with the torus, the other is constant ph cm-2 s-1(in very good agreement with Chandra measurement). This component has to be produced in a diffuse optically thin gas, as confirmed by Chandra observations that have shown that about 70 per cent of the line is extended over a size of kpc coincident with the extended NLR.
Acknowledgements.
The authors wish to thank the referee A. Zdziarski for constructive criticisms which have greatly improved the paper. A.D.R. acknowledge financial contributin from ASI-INAF I/023/05/0.References
- Anders & Grevesse (1989) Anders, E., & Grevesse, N. 1989, GeCoA, 53, 197
- Antonucci (1993) Antonucci, R.R. 1993, ARA&A, 31, 473
- Beckmann et al. (2005) Beckmann, V., Shrader, C.R., Gehrels, N.,et al. 2005, ApJ, 634, 939
- Boella et al. (1997) Boella, G., Butler, R.C., Perola, G.C., Piro, L., Scarsi, L., Bleeker, J.A.M. 1997, A&AS, 122, 299
- Clavel et al. (1987) Clavel, J., Altamore, A., Boksenberg, A., et al. 1987 ApJ, 321, 251
- De Rosa et al. (2002) De Rosa, A., Piro, L., Fiore, F. 2002a, A&A, 387, 838
- De Rosa et al. (2004) De Rosa, A., Piro, L., Matt, G., Perola, G.C. 2004, A&A, 413, 895
- Done et al. (1992) Done, C., Mulchaey, J.S., Mushotzky, R.F., Arnaud, K.A. 1992, ApJ 395, 275
- Done et al. (2000) Done, C., Madejski, G.M., Zycki, P.T. 2000, ApJ, 536, 213
- Fabian et al. (2000) Fabian, A.C., Iwasawa, K., Reynolds, C.S., Young, A.J. 2000, PASP, 112, 1145
- Fiore, Guainazzi & Grandi (1999) Fiore, F., Guainazzi, M., & Grandi, P. 1999, Cookbook for BeppoSAX NFI Spectral Analysis
- Haardt & Maraschi (1991) Haardt, F., & Maraschi, L. 1991, ApJ, 380, L51
- Haardt, Maraschi & Ghisellini (1997) Haardt, F., Maraschi, L., & Ghisellini, G. 1997, ApJ, 476, 620
- Kaspi et al. (2001) Kaspi, S., Brandt, W.N., Netzer, H., et al. 2001, ApJ, 554, 216
- Holt et al. (1980) Holt, S.S., et al. 1980, ApJ, 241, L13
- Inoue (1989) Inoue, H. 1989, proc. of 23rd ESLAB symposium in X-ray astronomy, Bologna, Sep.13-20 1989, p.783 (ESA SP-296)
- Krolik & Kallman (1984) Krolik, J.H., & Kallman, T.R., 1984, ApJ, 286, 366
- Kriss et al. (1992) Kriss, G.A., Davidsen, A.F., Blair, William P.,et al. 1992, ApJ, 392, 485.
- Matt, Perola & Piro (1991) Matt, G., Perola, G.C., & Piro, L. 1991, A&A, 247, 25
- Matt et al. (1997) Matt, G., Guainazzi, M., Frontera, F., et al. 1997, A&A, 325, L13
- Matt et al. (2001) Matt, G., Guainazzi, M., Perola, G.C., et al. 2001, A&A, 377, L31
- Magdziarz & Zdziarski (1995) Magdziarz, P., & Zdziarski, A.A. 1995, MNRAS, 273, 837
- Nandra & Pounds (1994) Nandra, K., Pounds, K.A. 1994, MNRAS, 268, 405
- Nandra et al. (2000) Nandra, K., Le, T., George, I., et al. 2000, ApJ, 544, 734
- Nicastro et al. (2000) Nicastro, F., Piro, L., De Rosa, A., et al. 2000, ApJ, 536, 718
- Ogle et al. (2000) Ogle, P.M., Marshall, H.L., Lee, J.C., & Canizares, C.R. 2000 ApJ, 545, L81
- Page et al. (2002) Page, K., Pounds, K., Reeves, J., O’Brien, P.T. 2002, MNRAS, 330, L1
- Pedlar et al. (1983) Pedlar, A., Kukula, M.J., Longley, D.P.T., et al. 1993, MNRAS, 263, 471
- Penston et al. (1990) Penston, M.V., Robinson, A., Alloin, D., et al. 1990, A&A, 236, 53
- Perola et al. (1986) Perola, G.C., Piro, L., Altamore, A., et al. 1986, ApJ, 306, 508
- Perola et al. (2002) Perola, G.C., Matt, G., Cappi, M., Fiore, F., Guainazzi, M., Maraschi, L., Petrucci, P.O., Piro, L. 2002, A&A, 389, 802
- Petrucci et al. (2000) Petrucci, P.O., Haardt, F., Maraschi, L., et al. 2000, ApJ, 540, 131
- Piro (1993) Piro, L. 1993, proc of UV and X-ray spectroscopy of astrophysical and laboratory plasmas, Berkeley Feb.3-5 1992, E.H. Silver & S. M. Kahn ed.s, p. 448 (Cambridge Univ. Press)
- Piro, Scarsi & Butler (1995) Piro, L., Scarsi, L., & Butler, R.C. 1995, Proc. of SPIE, 2517, 169
- Piro et al. (2005) Piro, L., De Rosa, A., Matt, G. and Perola, G.C. 2005, A&AL, 441, L13
- Pounds et al. (1986) Pounds, K.A., Warwick, R.S., Culhane,J.L., de Korte, P. 1986, MNRAS 218, 685
- Pounds et al. (2001) Pounds, K., Reeves, J., O’Brien, P., et al. 2001, ApJ, 559, 181
- Reeves et al. (2001) Reeves, J.N., Turner, M.J.L., Pounds,K.A., et al. 2001, 365, L134
- Reichert, Mushotzky & Holt (1986) Reichert, G.A., Mushotzky, R.F., & Holt, S.S. 1986 , ApJ, 303, 87
- Robinson et al. (1994) Robinson, A., Vila-Vilaro, B., Axon, D.J., et al. 1994, A&A, 291, 351
- Schurch & Warwick (2002) Schurch, N.J., & Warwick, R.S. 2002, MNRAS, 334, 811
- Schurch et al. (2003) Schurch, N.J., Warwick, R.S., Griffiths, R.E., Sembay, S. 2003, MNRAS, 345, 423
- Stasińska (1984) Stasińska, G. 1984, A&A,135, 341
- Svensson (1994) Svensson, R. 1994, ApJS, 92, 585
- Tanaka et al. (1995) Tanaka, Y., Nandra, K., Fabian, A.C., et al. 1995, Nature, 375, 659
- Ulrich (2000) Ulrich, M.-H., 2000, A&A Rev, 10, 135
- Vaughan & Edelson (2001) Vaughan, S., & Edelson, R. 2001, ApJ, 548, 694
- Wandel, Peterson & Malkan (1999) Wandel, A., Peterson, B.M., & Malkan, M.A. 1999, ApJ, 526, 579
- Warwick, Done & Smith (1995) Warwick, R.S., Done, C., & Smith, D.A. 1995, MNRAS , 275, 100
- (50) Weaver, K., Mushotzky, R.F., Arnaud, K.A., et al. 1994a, ApJ, 423, 621
- (51) Weaver, K., Yaqoob, T.,0 Holt, S.S., et al. 1994b, ApJ, 436, L27
- Winge et al. (1997) Winge, C., Axon, D.J., Macchetto, F.D., & Capetti, A. 1997, ApJ487, L121
- Yaqoob et al. (1991) Yaqoob, T., & Warwick, R.S. 1991, MNRAS, 248, 773
- Yaqoob et al. (1993) Yaqoob, T., Warwick, R.S., Makino, F., et al. 1993, MNRAS, 262, 435
- Yaqoob et al. (2001) Yaqoob, T., George, I.M., Nandra, K., et al. 2001, ApJ, 546, 759
- Zdziarski et al. (1996) Zdziarski, A.A., Johnson, W.N., & Magdziarz, P. 1996, MNRAS 283, 193
- Zdziarski et al. (2002) Zdziarski, A.A., Leighly, K.M., Matsuoka, M., Cappi, M., Mihara, T. 2002, ApJ, 573, 505
- Zdziarski et al. (2003) Zdziarski, A.A., Lubiński, P., Gilfanov, M., Revnivtsev, M. 2003, MNRAS, 342, 355