Deep Mid-Infrared Silicate Absorption as a Diagnostic of Obscuring Geometry Toward Galactic Nuclei
Abstract
The silicate cross section peak near 10m produces emission and absorption features in the spectra of dusty galactic nuclei observed with the Spitzer Space Telescope. Especially in ultraluminous infrared galaxies, the observed absorption feature can be extremely deep, as IRAS 08572+3915 illustrates. A foreground screen of obscuration cannot reproduce this observed feature, even at large optical depth. Instead, the deep absorption requires a nuclear source to be deeply embedded in a smooth distribution of material that is both geometrically and optically thick. In contrast, a clumpy medium can produce only shallow absorption or emission, which are characteristic of optically-identified active galactic nuclei. In general, the geometry of the dusty region and the total optical depth, rather than the grain composition or heating spectrum, determine the silicate feature’s observable properties. The apparent optical depth calculated from the ratio of line to continuum emission generally fails to accurately measure the true optical depth. The obscuring geometry, not the nature of the embedded source, also determines the far-IR spectral shape.
1 Introduction
The observable spectra of the nuclei of galaxies depend on both the underlying emission sources and the subsequent obscuration and reprocessing of their light by material along the line of sight. Dust is common in these nuclear regions, so its spectral signature is often observed at mid-infrared (mid-IR) wavelengths. In particular, the silicate cross section peak near 10m produces a spectral feature that is observed frequently in absorption (Roche et al., 1991; Spoon et al., 2002, 2004; Weedman et al., 2005) and sometimes in emission (Hao et al., 2005; Siebenmorgen et al., 2005; Sturm et al., 2005). Hao et al. (2006) examine local active galactic nuclei (AGNs) and ultraluminous infrared galaxies (ULIRGs) with the striking result that the average spectra of various classes of galaxies show marked differences in the 10m silicate feature (their Fig. 1). We seek a physical explanation for the differences among these families. Moreover, the underlying origin of the distinct classes must also account for the most extreme example, the deep absorption of the ULIRG IRAS 08572+3915.
2 Observations with the Spitzer Space Telescope
Hao et al. (2006) present a local sample of AGNs and ULIRGs observed with the low-resolution modules of the Infrared Spectrograph (Houck et al., 2004) aboard the Spitzer Space Telescope (Werner et al., 2004). They divide the sample into four classes: ULIRGs based on IR luminosity, and quasars, Seyfert 1 galaxies, and Seyfert 2 galaxies based on optical criteria. Although some galaxies belong to more than one group, the average spectra of the groups are very different. The silicate feature emerges clearly in emission in the quasar spectrum, while it appears in absorption in all other cases. The absorption is deepest in the ULIRG spectrum and shallowest in the Seyfert 1 spectrum. We illustrate the significant differences with example spectra from the four classes (Figure 1).
We quantify the silicate feature, defining the “feature strength”
| (1) |
in terms of the the observed () and underlying continuum () flux evaluated at wavelength . To determine the continuum well, we fit each spectrum over the rest wavelength intervals 5.0–7.0m, 14.0–14.5m, and 25.0–40.0m. We perform a linear fit to each of these three segments, measuring vs. , then fit a spline to connect them. We apply this approach directly to the continuum-dominated spectra, which include most of the quasars. In other cases, however, we modify the procedure to accomodate spectral features, such as high-ionization emission lines, polycyclic aromatic hydrocarbon (PAH) emission, and ice absorption, excluding these regions from the continuum fits. For example, we shift the lower bound of the long-wavelength bandpass to 26.5m to avoid [O IV] in many of the Seyfert galaxies. When PAH emission is strong, the short-wavelength bandpass is reduced to a continuum measurement at 5.5m, and in ice-dominated spectra, we use continuum measurements at 5.2 and 5.6m. (See Spoon et al. 2006b for detailed examples of the continuum fits.)
We measure the strength at the extremum of the continuum-subtracted spectrum. Positive values of indicate emission, while negative values of indicate absorption. In absorption, this definition of feature strength corresponds to the apparent optical depth, i.e., attenuation by a factor of , with conventionally evaluated at (e.g. Pier & Krolik, 1993; Granato & Danese, 1994). The four classes show characteristic differences in strength, with , -0.18, -0.54, and -1.5 in the average spectra of the quasars, Seyfert 1 galaxies, Seyfert 2 galaxies, and ULIRGs, respectively. The most extreme example, IRAS 08572+3915, has (Spoon et al., 2006a). While the ULIRGs exhibit a range of , including a few cases of silicate emission where AGNs are identified optically, the ULIRGs are generally deeply absorbed, with in 67% and in 30% of this archival sample (Hao et al., 2006). Moreover, all galaxies having are ULIRGs.
3 Computation of the Spectral Energy Distribution
A purely absorbing foreground screen cannot produce a deep silicate feature because the dust emission of an optically thick screen is much greater than the transmitted external radiation. Denote by the Planck function. Dust emission at wavelength from a region with optical depth is if the temperature is constant. Because the dust intensity is when the source is optically thick and when it is optically thin, uniform temperature dust will never produce an absorption feature under any circumstances. A temperature gradient is essential for an absorption feature. Deep absorption requires dust geometry conducive to large gradients.
Consider a cloud illuminated from outside by a radiative source. If the cloud’s dimensions are much smaller than the distance to the source, then the heating flux is constant across the cloud’s volume. Without radiative transfer effects, the dust temperature is uniform throughout the cloud. In contrast, arranging the same dust in a geometrically thick shell around the same heating source produces a large temperature gradient because of the spatial dilution of the flux with radial distance. Radiative transfer in optically thick dust affects both geometries similarly: the external radiation is absorbed within a short distance from the illuminated face. This creates a large temperature differential close to the surface but only a modest gradient in the deeper layers. We can therefore expect the absorption feature to have only limited depth in the case of externally illuminated clouds. A deep feature requires the radiation source to be deeply embedded in dust that is thick both optically and geometrically.
To verify this conclusion, we performed exact radiative transfer calculations with the code DUSTY (Ivezić, Nenkova, & Elitzur, 1999). The slab geometry serves as a proxy for an externally illuminated cloud, and a spherical shell represents deeply embedding dust. We consider a range of total optical depths, described in terms of the optical depth at 5500Å, . The SED of the underlying source spectrum is a broken power law, characteristic of an AGN. In fact, as Rowan-Robinson (1980) and Ivezić & Elitzur (1997) demonstrate for similar problems, the resulting mid-IR spectral shape is insensitive to the heating spectrum. The mid-IR spectrum is ultimately a product of the dust, and IR colors indicate its geometry (Ivezić & Elitzur, 2000).
The model dust is that of the Galaxy, composed of 53% silicate and 47% graphite. We use the absorption and scattering cross sections of Draine (2003) and the grain size distribution of Mathis, Rumpl, & Nordsieck (1977). Changing the silicate fraction does not alter any of the general trends we report. Crystalline silicates, however, produce sharper features in the resulting SED, and we do not consider them further.
In both the geometrically thin slab and spherical shell cases, the inner edge of the obscuring region is located where dust sublimates. Assuming K, this inner radius pc, where is the luminosity of the central source in units of . While our concern here is the nuclei of galaxies, the results are equally applicable to other situations, such as dust-embedded stars. The total optical depth completely describes the slab. For the spherical shell we consider variations of the geometric thickness and the density distribution.
4 Model Results
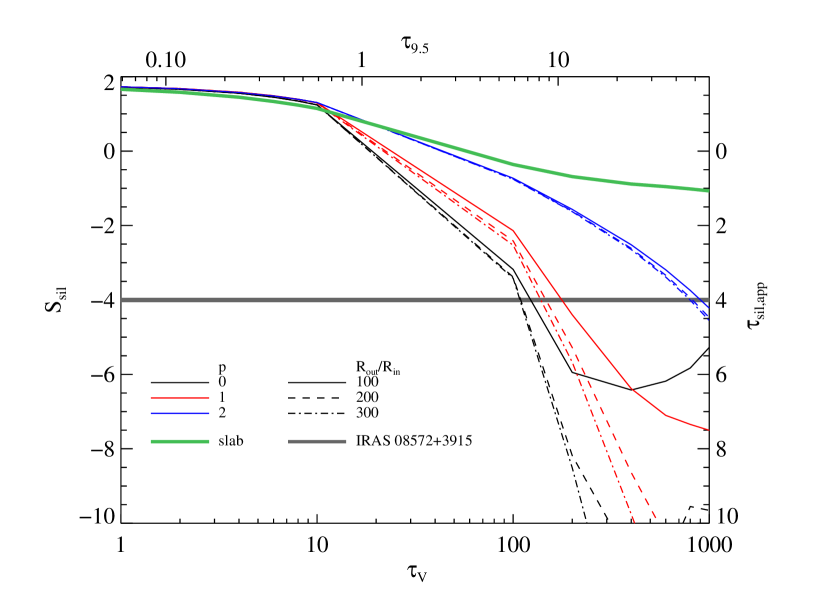
Figure 2 summarizes the model results, showing the 10m feature strength, , vs. for the slab and several spherical shell models. In the slab, the deepest absorption approaches at . With the adopted extinction curve, , so the actual optical depth while the apparent optical depth is only 1.1. The depth of the feature does not provide an accurate measurement of the total optical depth along the line of sight, and the slab geometry cannot produce the large observed apparent optical depths.
The spherical shell results depend on the total shell thickness and the density profile, as well as the total optical depth. We considered shell thickness, , ranging from 1.5 to 1000. Very thin shells are similar to the slab solutions, so we plot only representative thick shells, with outer radius –. The radial density distribution is a power law, proportional to . Thick spherical shells can produce extremely deep silicate features, with the magnitude of the feature strength increasing with decreasing and increasing . Even with the spherical geometry, the apparent optical depth systematically underpredicts the actual line-of-sight optical depth.
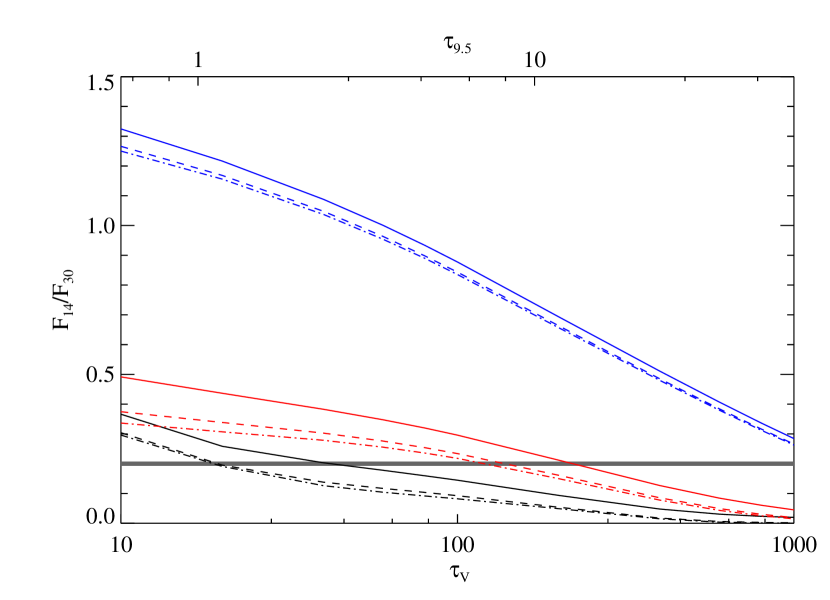
Several combinations of optical depth and shell geometry can produce the large strength we observe in IRAS 08572+3915. A flux ratio helps to distinguish among them. We compare at 14 and 30m, where the continuum dominates the observed flux. As Figures 2 and 3 together illustrate, models with , moderate thickness ( a few hundred ), and moderately large optical depth ( a few hundred) agree with both the observed mid-IR color and the large magnitude of IRAS 08572+3915. None of the or 2 solutions fits both the feature depth and the 14/30m flux ratio. However, the solutions at lower optical depth () are consistent with the average values of both and flux ratio measured in the ULIRGs.
The observed flux densities separately indicate the intrinsic luminosity of the buried source. Comparing the observations of IRAS 08572+3915 with the simulated SED of the preferred solution, in which , , and , the 14 and 30m measurements yield and 1.1, respectively. Both values are comparable to the luminosity derived from the IRAS fluxes, , at a distance of 250 Mpc. We also calculate the mass of the obscuring shell, adopting a standard gas-to-dust ratio . We find , where depends on the radial profile. In terms of shell thickness, , for , for , and for . Thus, in IRAS 08572+3915, .
5 Discussion and Conclusions
The strength of the absorption feature is a function of the temperature contrast in the dusty material. The extremely deep features we observe in many ULIRGs require a steep temperature gradient. We can broadly account for the differences among the spherical models in terms of the temperature distribution of the dust. In the limit of a thin shell (), the result approaches the slab solution. The geometric dilution of the heating is also reduced when the material is very concentrated (i.e., is large). In general, the apparent optical depth increases with true optical depth. For a given radial density profile, the larger spheres typically exhibit deeper features because the temperature range over them is large. The exceptions to these general trends are a consequence of the details of radiative transfer through the material, and the results are sensitive to both temperature variation and optical depth. For example, any shell will become heated well throughout at sufficiently large optical depth, reducing the temperature gradient and feature strength. The onset of this effect depends on shell thickness and ; it is apparent in the = 100 solutions for , and to a lesser extent for . We find the deepest absorption in the or 1 models with moderate size.
We checked the effect of the chemical composition of the dust, varying the silicate fraction from 20 to 80%. The general trends of with geometry and optical depth remain the same in these additional simulations. Increasing the silicate abundance does not produce a deeper feature; only the scaling of strength relative to total optical depth changes with chemical composition because the ratio of to total optical depth changes.
The slab temperature profile is similar to that of any externally heated cloud whose dimensions are much smaller than its distance to the source. The dark and bright faces of the slab are distinct: the silicate feature appears in absorption only from the dark side, while viewing the bright side always results in an emission feature, independent of the cloud’s total optical depth. The spectrum of a clumpy medium mixes the contributions of many individual clouds, each of which presents to the observer either its dark or bright side (Nenkova, Ivezić, & Elitzur, 2002). Only a contrived cloud configuration can produce a very deep absorption feature. In a single slab, the feature is deepest when the temperature on the illuminated face is around 200–400 K and the slab is viewed from its dark side along the line of sight to the source. Unlike dust sublimation, there is no reason to single out the distance corresponding to this particular temperature for the location of all clouds. Similarly, there is no reason for the observer to be in a preferred direction, one that views the dark sides exclusively. In contrast, only the dark side of a closed shell can be observed. However, once the shell is fragmented into clouds, it offers some direct views of portions of its illuminated inner surface. The emission from the bright faces fills the absorption trough, reducing the depth of the feature.
The true distribution of obscuring material is most likely inhomogeneous, consisting of both dense clouds and a smooth intercloud medium, but the relative importance of these two components differs between the ULIRGs and other galaxies. The lack of deep absorption implies that the cloud-dominated medium is most relevant to the AGNs. Indeed, at high spatial resolution, where the AGN is isolated, the silicate absorption is never deep (Roche et al., 2006), and complete models of obscuration by clouds can reproduce the feature in detail (Mason et al., 2006). Individual Seyfert galaxies observed with Spitzer may show deep absorption when the larger (up to 20-kpc scale) galactic contribution becomes comparable to that of the AGN. Nonetheless, the absence of extreme absorption in the composite spectra of both Seyfert 1 and Seyfert 2 galaxies (Hao et al., 2006) indicates that clouds dominate the obscuration of their AGNs.
The deep silicate absorption that is characteristic of many ULIRGs requires a central source embedded in obscuring material that is thick both optically and geometrically. Imanishi & Maloney (2003) noted similarly that only centrally-concentrated buried sources can produce deep 3m dust absorption features. While the medium may be inhomogeneous, the smooth component of the distribution must dominate the 10m spectral region. Otherwise, emission from bright cloud faces would fill in the absorption trough, reducing the magnitude of . Given the scaling of the shell size with luminosity, the observed deep absorption features therefore indicate obscuration on scales of a few 100 pc. AGNs may be present in these galaxies, but they must be deeply buried. The distinction of these ULIRGs is the continuous geometry of the covering medium, not the optical depth along the line of sight or the average covering fraction. Indeed, many Seyfert 2 galaxies have large column densities along the lines of sight to their nuclei, but they offer clear views of their narrow line regions and some illuminated cloud faces.
The geometry of the obscuration determines the emergent SED across the entire IR bandpass. Our simulations demonstrate that the far-IR spectral shapes change significantly with the geometric variations, despite having the same heating source. In general, the geometries that produce the deepest silicate absorption also have the reddest far-IR spectra, yet even modest optical depths () can have the peak of at wavelengths greater than 60m. Clumpy and smooth distributions produce different far-IR signatures (Nenkova et al., 2002). In a normal AGN, a clumpy medium (the torus) obscures the central engine, and the resulting far-IR flux ratios successfully separate AGNs from star-forming galaxies (de Grijp et al., 1987). However, the nature of the heating source is erased by dust reprocessing. The only qualification is that the source provide UV photons to heat the dust, which both starburst and AGN spectra do. When an AGN is embedded in a thick, smooth, dusty blanket, its peak flux density shifts to longer wavelengths. Far-IR flux ratios cannot be used to identify the powerful sources of radiation in the deeply-embedded ULIRGs.
Because of the extreme obscuration, the emergent near-IR emission of the deeply embedded nuclear sources is weak. The observed near-IR emission of ULIRGs is often stronger than the deeply embedded models predict. Even in IRAS 08572+3915, where the SED declines steeply below 8m (Fig. 1), the near-IR emission exceeds the model results. Here the observed 3.7/14m flux ratio is 0.05, but the model embedded source does not account for more than 5% of the observed flux at . In these cases, the component responsible for the observed near-IR emission must be different from the one dominating at mid-IR wavelengths. The additional near-IR sources do not fill in the deep silicate absorption troughs, so their spectra must decline steeply above 5m. The photospheric emission of stars may therefore be the origin of the observed near-IR light. Because different sources dominate the observed flux in different spectral regions, a near- to mid-IR flux ratio is not generally a measurement of a single physical entity.
In summary, we have observed characteristic differences in the mid-IR silicate feature among four classes of galaxies. The underlying physical distinctions of optical depth and obscuring geometry account for these differences. Optically thin regions produce silicate emission, which we observe in the composite quasar spectrum. Modest silicate absorption shows that clumpy obscuration dominates in the Seyfert 1 and Seyfert 2 galaxies. The extremely deep absorption in many ULIRGs, especially that of IRAS 08572+3915, requires their nuclear sources to be deeply embedded in optically and geometrically thick material.
References
- Carico et al. (1988) Carico, D. P., Sanders, D. B., Soifer, B. T., Elias, J. H., Matthews, K., & Neugebauer, G. 1988, AJ, 95, 356
- de Grijp et al. (1987) de Grijp, M. H. K., Lub, J., & Miley, G. K. 1987, A&AS, 70, 95
- Draine (2003) Draine, B. T. 2003, ApJ, 598, 1017
- Glass & Moorwood (1985) Glass, I. S., & Moorwood, A. F. M. 1985, MNRAS, 214, 429
- Granato & Danese (1994) Granato, G. L., & Danese, L. 1994, MNRAS, 268, 235
- Hao et al. (2005) Hao, L., et al. 2005, ApJ, 625, L75
- Hao et al. (2006) Hao, L., Spoon, H. W. W., Weedman, ,D. W., Houck, J. R., & Armus, L. 2006, submitted to ApJ
- Houck et al. (2004) Houck, J. R., et al. 2004, ApJS, 154, 18
- Imanishi & Maloney (2003) Imanishi, M., & Maloney, P. R. 2003, ApJ, 588, 165
- Ivezić & Elitzur (1997) Ivezić, Ž., & Elitzur, M. 1997, MNRAS, 287, 799
- Ivezić & Elitzur (2000) Ivezić, Ž., & Elitzur, M. 2000, ApJ, 534, L93
- Ivezić, Nenkova, & Elitzur (1999) Ivezić, Ž., Nenkova, M. & Elitzur, M., 1999, User Manual for DUSTY, University of Kentucky Internal Report (accessible at http://www.pa.uky.edu/moshe/dusty)
- Mason et al. (2006) Mason, R. E., Geballe, T. R., Packham, C., Levenson, N. A., Elitzur, M., Fisher, R. S., & Perlman, E. 2006, ApJ, 640, 612
- Mathis, Rumpl, & Nordsieck (1977) Mathis, J. S., Rumpl, W., & Nordsieck, K. H. 1977, ApJ, 217, 425
- Nenkova et al. (2002) Nenkova, M., Ivezić, Ž., & Elitzur, M. 2002, ApJ, 570, L9
- Neugebauer et al. (1987) Neugebauer, G., Green, R. F., Matthews, K., Schmidt, M., Soifer, B. T., & Bennett, J. 1987, ApJS, 63, 615
- Pier & Krolik (1993) Pier, E. A., & Krolik, J. H. 1993, ApJ, 418, 673
- Rieke (1978) Rieke, G. H. 1978, ApJ, 226, 550
- Roche et al. (1991) Roche, P. F., Aitken, D. K., & Smith, C. H. 1991, MNRAS, 252, 282
- Roche et al. (2006) Roche, P. F., Packham, C., Telesco, C. M., Radomski, J. T., Alonso-Hererro, A., Aitken‘¡, D. K., Colina, L., & Perlman, E. 2006, MNRAS, 367, 1689
- Rowan-Robinson (1980) Rowan-Robinson, M. 1980, ApJS, 44, 403
- Shi et al. (2006) Shi, Y., et al. 2006, ApJ, in press (astro-ph/0608645)
- Siebenmorgen et al. (2005) Siebenmorgen, R., Haas, M., Krügel, E., & Schulz, B. 2005, A&A, 436, L5
- Spoon et al. (2006a) Spoon, H. W. W., et al. 2006a, ApJ, 638, 759
- Spoon et al. (2002) Spoon, H. W. W., Keane, J. V., Tielens, A. G. G. M., Lutz, D., Moorwood, A. F. M., & Laurent, O. 2002, A&A, 385, 1022
- Spoon et al. (2006b) Spoon, H. W. W., Marshall, J. A., Houck, J. R., Elitzur, M., Hao, L., Armus, L., Brandl, B. R., & Charmandaris, V. 2006b, submitted to ApJ
- Spoon et al. (2004) Spoon, H. W. W., Moorwood, A. F. M., Lutz, D., Tielens, A. G. G. M., Siebenmorgen, R., & Keane, J. V. 2004, A&A, 414, 873
- Sturm et al. (2005) Sturm, E., et al. 2005, ApJ, 629, L21
- Weedman et al. (2005) Weedman, D. W., et al. 2005, ApJ, 633, 706
- Werner et al. (2004) Werner, M. W., et al. 2004, ApJS, 154, 1