Principal Component Analysis as a tool to explore star formation histories
Principal Component Analysis (PCA) is a well-known multivariate technique used to decorrelate a set of vectors. PCA has been extensively applied in the past to the classification of stellar and galaxy spectra (e.g. Madgwick et al. 2002). Here we apply PCA to the optical spectra of early-type galaxies, with the aim of extracting information about their star formation history. We consider two different data sets: 1) a reduced sample of elliptical galaxies in Hickson compact groups and in the field, and 2) a large volume-limited () sample of galaxies from the Sloan Digital Sky Survey. Even though these data sets are very different, the homogeneity of the populations results in a very similar set of principal components. Furthermore, most of the information (in the sense of variance) is stored into the first few components in both samples. The first component (PC1) can be interpreted as an old population and carries over 99% of the variance. The second component (PC2) is related to young stars and we find a correlation with NUV flux from GALEX. Model fits consistently give younger ages for those galaxies with higher values of PC2.
1 Why PCA on early-type galaxy spectra ?
Unravelling the star formation history of massive early-type galaxies is one of the key issues towards a complete theory of galaxy formation. These systems pose a strong constraint on the standard paradigm of hierarchical structure formation, as they are massive enough to have undergone an extended period of assembly, whereas their light is dominated by old populations, revealing an early, short and intense star formation history (e.g. Trager et al. 2000). Recent searches for massive galaxies at high redshift reveal a population of red and massive systems at whose photometry, mass distribution and spatial correlation properties make them plausible candidates for the progenitors of local early-type galaxies (e.g. Labbé et al. 2003; Daddi et al. 2003; van Dokkum et al 2006).
“Traditional” methods to assess the stellar populations in galaxies rely on direct comparisons with models, including a standard maximum likelihood approach to determine the best fit and the uncertainties on the parameters that control the models (Panter, Heavens & Jimenez 2004; Ocvirk et al. 2006). It has been shown (e.g. Ferreras & Yi 2004) that large degeneracies exist in the determination of the age of an old stellar population. Therefore, a model-independent approach is most welcome in this field, and PCA is one such method.
Principal Component Analysis (PCA; e.g. Rencher 2002) is a multivariate analysis tool aimed at looking for linear combinations of the original data so that the new elements (called principal components) are statistically uncorrelated. The methodology reduces to a diagonalisation of the covariance matrix, so that the eigenvectors are the principal components and the eigenvalues give the weight of each one. Usually these components are sorted in decreasing order of their eigenvalues, with the first components carrying most of the information (in the sense of variance).
2 The samples
We have applied PCA to two sets of spectroscopic data from early-type galaxies. The first sample comprises 30 elliptical galaxies located in Compact Groups and in the field (Ferreras et al. 2005), hereafter referred to as HCG/F. The other sample is a volume-limited set () of early-type systems extracted from the Sloan Digital Sky Survey (Bernardi et al. 2005). In both cases the spectra were acquired with the same instrument for all galaxies, a crucial issue when applying PCA. The HCG/F sample comes from observations at the KPNO 2.1m telescope (de la Rosa et al. 2001) whereas the SDSS sample come from the publicly available Data Release 4 (Adelman-McCarthy et al. 2006). In both sets the spectra were de-redshifted and de-reddened (from Galactic extinction) using standard techniques. The spectral range 3800–5000Å was used. The reader is pointed to Ferreras et al. (2005) for details of the Compact Group/Field sample and to Rogers et al. (in preparation) for details of the SDSS sample.
3 The Principal Components
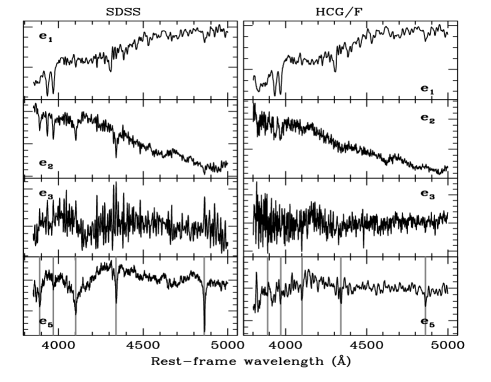
Treating the fluxes in each wavelength bin () as the components of a vector in N-dimensional space, one can construct the covariance matrix for the set of galaxies. The first eigenvectors are shown in figure 1 for both samples. The first and second eigenvectors stand out as representing old and young stellar populations, respectively. The third eigenvector is not so easy to interpret. We find that it is related to velocity dispersion (Ferreras et al. 2005; Rogers et al. in preparation). Finally, it is remarkable to find in both sets that the fifth component features the characteristic Balmer absorption lines typical of A-type stars. This feature is commonly interpreted as a signature of a recent star formation episode.
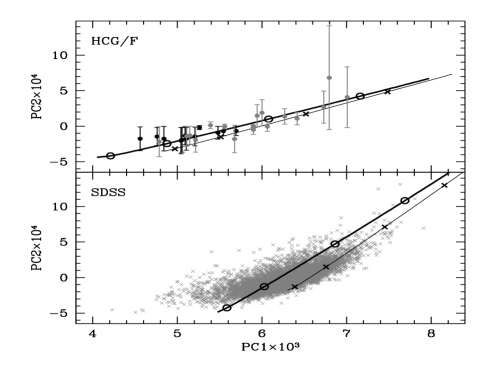
In order to test the “success” of PCA in classifiying the spectra, we project each galaxy on to the eigenvectors. PCA can be thought of as a “rotation” in an N-dimensional space, so that the new axes (the principal components) are optimally aligned towards the directions of maximal variance. Given that most of the weight lies on the few first eigenvectors (in both samples the first three components amount for more than 99% of the information), one only needs to explore these ones. Figure 2 shows the result for the projection on to the first and second components (PC1 and PC2 respectively). Each point represents a galaxy. In the HCG/F sample field (compact group) galaxies are represented as black (grey) circles. The lines are projections of synthetic spectra on to the same principal components. These spectra are composite -models from Bruzual & Charlot (2003), assuming an exponential star formation rate. Various values of the timescale () are explored. The open circles (crosses) represent – from bottom-left – values of Gyr for metallicity (). The observed correlation between PC1 and PC2 in these galaxies shows roughly an age trend, so that galaxies in compact groups feature a wider distribution of ages compared to their counterparts in the field. The SDSS data shows a similar range of values of PC1 and PC2.
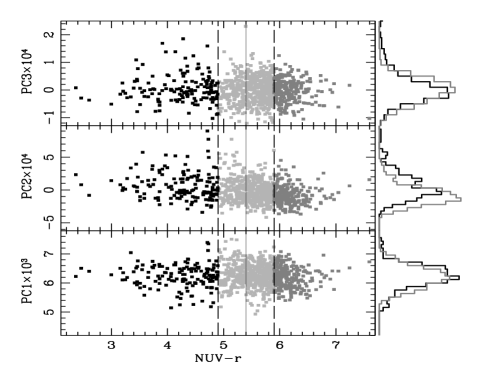
We wanted to explore this point further by cross-matching our SDSS dataset with the recent sample of Schawinski et al. (2006) who measured fluxes from GALEX. We use their NUV passband centered around 2300Å . Their criterion for recent star formation was defined on the NUV, so that colours bluer than 5.4 are characteristic of galaxies with young stellar populations. Figure 3 shows a comparison between NUV colour and our projections on to the first three principal components. Even though a clean correlation is not apparent, the histograms on the right, obtained for a blue and a red subsample, show that only PC2 features a correlation with NUV and thereby with recent star formation. We should emphasize here that the estimated mass fraction in young stars stays – even for the bluest galaxies in this sample – below a few percent. Nevertheless, this small contribution gives a significant flux in the NUV. It is remarkable that our PCA analysis – restricted to 3800-5000Å – can detect these small episodes of star formation !

4 Putting the physics back in
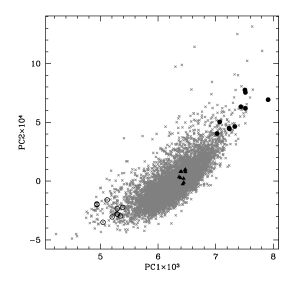
The weakness of PCA ironically lies in its strength. PCA is a model-independent method, which only reclassifies input data according to its covariance. Hence, we cannot give direct physical meaning to the eigenvectors. Nevertheless, one can put the physics a posteriori, by projecting synthetic models on to the principal components as shown above, or we can use the classification suggested by PCA to select specific subsets of galaxies for comparison with models. The use of PC2 as a proxy for recent star formation is further explored by selecting a few galaxies from the PC1 vs. PC2 plane (see left panel of figure 4). These galaxies are extracted from different regions of the diagram. The spectra are compared with -models (exponentially decaying star formation rate at constant metallicity) via a maximum likelihood method, and the results for the average age are shown in the right panel of figure 4. The error bars represent the 5 and 95 percentile of the probability distribution. The correlation with PC2 is evident, confirming our preliminary results. The range of ages is the one expected for massive early-type galaxies (Trager et al. 2000).
5 Conclusions
The work presented here represents a pilot study aimed at exploring PCA as a complement (never a substitute) to model-dependent techniques to learn about the star formation history of galaxies from their unresolved photo-spectroscopic information. We have shown that some of the principal components have a direct connection with physical parameters. Most notably PC2 correlates with the distribution of stellar ages. No space is left in this paper to discuss other interesting components, such as PC3 or PC5, but we refer the reader to our ongoing work on the SDSS sample (Rogers et al. in preparation).
ACKNOWLEDGEMENT: The work presented here combines two independent data sets on which PCA was applied separately. This work would not have been possible without the help of our collaborators Anna Pasquali, Reinaldo de Carvalho, Mariangela Bernardi, Sugata Kaviraj and Sukyoung Yi. The SDSS collaboration is gratefully acknowledged for frequent use of its superb data base.
References
- (1) Adelman-McCarthy, et al. ApJS, 162, 38 (2006).
- (2) M. Bernardi, et al. AJ, 129, 61 (2005).
- (3) G. Bruzual & S. Charlot, MNRAS, 344, 1000 (2003).
- (4) E. Daddi, et al., ApJ, 588, 50 (2003).
- (5) I. G. de la Rosa, R. R. de Carvalho & S. E. Zepf, AJ, 122, 93 (2001).
- (6) I. Ferreras, A. Pasquali, R. R. de Carvalho, I. G. de la Rosa & Lahav, O., MNRAS, 123, 456 (2005).
- (7) I. Ferreras & S. Yi, MNRAS 350, 1322 (2004).
- (8) I. Labbé, et al. AJ, 125, 1107 (2003).
- (9) D. S. Madgwick, et al. MNRAS, 333, 133 (2002).
- (10) P. Ocvirk, et al. MNRAS, 365, 46O (2006).
- (11) B. Panter, A. F. Heavens & R. Jimenez, MNRAS, 343, 1145 (2003).
- (12) A. C. Rencher: Methods of Multivariate Analysis, 2nd edn (Wiley, New York 2002) pp 380–407.
- (13) K. Schawinski, et al., astro-ph/0601036 (2006).
- (14) S. C. Trager, et al. AJ, 120, 165 (2000).
- (15) P. G. van Dokkum, et al., ApJ, 638, L59 (2006).
Index
- Ferreras Principal Component Analysis as a tool to explore star formation histories
- Lahav Principal Component Analysis as a tool to explore star formation histories
- Rogers Principal Component Analysis as a tool to explore star formation histories