Buoyant Bubbles in a Cooling Intracluster Medium I. Hydrodynamic Bubbles
Abstract
Aims. Over the past several years, numerous examples of X-ray cavities coincident with radio sources have been observed in so-called “cool core” clusters of galaxies. Motivated by these observations, we explore the evolution and the effect of cavities on a cooling intracluster medium (ICM) numerically, adding relevant physics step by step.
Methods. In this paper we present a first set of hydrodynamical, high resolution ( effective grid elements), three-dimensional simulations, together with two-dimensional test cases. The simulations follow the evolution of radio cavities, modeled as bubbles filled by relativistic plasma, in the cluster atmosphere while the ICM is subject to cooling.
Results. We find that the bubble rise retards the development of a cooling flow by inducing motions in the ICM which repeatedly displace the material in the core. Even bubbles initially set significantly far from the cluster center affect the cooling flow, although much later than the beginning of the simulation. The effect is, however, modest: the cooling time is increased by at most only 25%. As expected, the overall evolution of pure hydrodynamic bubbles is at odds with observations, showing that some additional physics has to be considered in order to match the data.
Key Words.:
Galaxies: clusters: general – cooling flows – methods: numerical1 Introduction
Approaching the centers of rich clusters of galaxies, one often finds a remarkable increase in the X-ray luminosity together with a marked decrease in the temperature. Under the conditions present in these clusters, the radiative cooling time of the intracluster medium (ICM) becomes shorter than the cluster lifetime and a “cooling flow” is expected to occur, i.e. a subsonic flow of cooling gas toward the cluster center (see Fabian, 1994, for a review). The absence of observations of a reliable repository for the cold gas left some doubts regarding this picture, which were confirmed when a major revision was forced by spectral measurements of the cores of the clusters. High-resolution XMM/Newton (Peterson et al., 2001, 2003; Tamura et al., 2001; Kaastra et al., 2004) spectra and lower resolution ASCA (Makishima et al., 2001) and Chandra (David et al., 2001) spectra show that only a small fraction of the gas is cooling below 1-2 keV, whereas its temperature was expected to be as low as K (0.1 keV). Hence it is now said that these clusters host a “cool core” instead of a cooling flow, and therefore in the rest of the paper we will refer to them as cool core cluster.
Maintaining gas at keV temperatures for a period several times longer than its cooling time requires one or more heating mechanisms. Candidate heating mechanisms include thermal conduction by electrons in the ICM (Narayan & Medvedev, 2001; Zakamska & Narayan, 2003; Voigt & Fabian, 2004), reconnection of magnetic fields (Soker & Sarazin, 1990), turbulent mixing (Kim & Narayan, 2003), and the injection of hot plasma by the active galactic nucleus (AGN) hosted by the central galaxy. In this paper we will focus on this last possibility, but we do not exclude the possibility that more than one mechanism is at work.
Recent observations suggest that almost all cool core clusters host radio sources in their centers (Eilek, 2004). Often these sources are rather faint, and it is not clear if a correlation exists between their radio power and the strength of the expected cooling flow (Voigt & Fabian, 2004; Kaastra et al., 2004; Bîrzan et al., 2004). However, about 71% of the cD galaxies in cool core clusters are radio-loud compared to only 23% of non-cool core cluster cDs (Burns, 1990; Ball et al., 1993), and this suggests a connection between AGN activity and the presence of a cool core, at least in clusters that host a cD.
The shapes of radio sources are determined by the interaction of the jets with their surroundings. The central radio sources in cool core clusters mostly show a disturbed morphology: even when they host a radio-loud core, collimated jets exist only on kpc scales or below. After this the plasma flow continues in a less collimated manner into the ICM, and the lobes take the shape of large plumes or wide tails (see e.g. Eilek, 2004; Jetha et al., 2005). A remarkable exception is Cygnus A, a typical Fanaroff-Riley II (FRII) source, whose jets travel straight for about 100 kpc and terminate in hot spots at the far ends of the lobes (see e.g Barthel & Arnaud, 1996).
The interaction of a single jet or a pair of jets with the ICM has been studied extensively both theoretically (Scheuer, 1974; Blandford & Rees, 1974; Smith et al., 1983; Begelman & Cioffi, 1989; Heinz et al., 1998; Alexander, 2002) and through numerical simulations (see e.g. Clarke et al., 1997; Rizza et al., 2000; Reynolds et al., 2001, 2002; Krause, 2003; Krause & Camenzind, 2003; Zanni et al., 2003, and references therein). These simulations, however, mostly apply only to FRII sources and to the phase of AGN activity. This work suggests that jets inflate a cocoon with radio plasma which encompasses both the jets and the AGN, and as the radio source evolves, this cocoon elongates in the jet’s direction and assumes a cigar-like shape. The long-term evolution of the radio sources has received less attention; on the one hand, it has been argued that they should continue to expand subsonically while the cocoon remains overpressured with respect to the surrounding medium. On the other hand, it was pointed out that the cocoon evolution would instead be driven by buoyancy when its expansion speed became comparable to the rising buoyancy speed (Churazov et al., 2000). A more detailed picture has been revealed by some recent numerical studies (Reynolds et al., 2002; Basson & Alexander, 2003; Omma et al., 2004; Omma & Binney, 2004; Zanni et al., 2005): after the jets are switched off, they show that lateral instabilities bisect the cocoon in its central region, while its remaining parts start to rise in the cluster atmosphere, due to residual momentum and to buoyancy.
Depressions of the X-ray flux coincident with AGN radio lobes have been observed in cool core clusters and also in some groups and galaxies by ROSAT and Chandra telescopes. They are usually interpreted as cavities in the ICM, produced and filled by the radio-emitting plasma injected by the central AGN as described above. A systematic study of these systems is provided by Bîrzan et al. (2004). Usually, cavities occur in pairs, and the cavities in the same pair are in opposite directions and at about the same distance with respect to the cluster center. In general, they also have similar dimensions, measuring up to some tens of kpc across, and are located some tens of kpc away from the cluster center. However, a pair of huge cavities, roughly 200 kpc in diameter, has been detected by McNamara et al. (2005) in MS0735.6+7421.
Cavities are sometimes surrounded by bright rims of denser and cooler gas (see e.g. A2052: Blanton et al., 2001), which presumably has been displaced, uplifted or entrained by the hot plasma during the formation of the cavity or its subsequent motion. In some cases weak shocks are observed surrounding the cavities in clusters (Perseus: Fabian et al., 2006, 2003a; Hydra A: Nulsen et al., 2005b; MS0735.6+7421: McNamara et al., 2005) and in M87 (Forman et al., 2005), but so far strong shocks have been detected only in Centaurus A (Kraft et al., 2003). A weak shock has also been reported around the radio source in Hercules A (Nulsen et al., 2005a), which apparently does not host cavities, and spectral evidence of a shock is reported in A478 (Sanderson et al., 2005). A bow shock in front of radio lobes may have been detected in Cygnus A (Smith et al., 2002; Bałucińska-Church et al., 2005). In the case of a weak shock, it can be assumed that the radio-emitting plasma in the cavities is almost in pressure equilibrium with the surrounding ICM. Thus, due to their low density, the radio lobes will rise by buoyancy in the cluster atmosphere (Gull & Northover, 1973), similarly to the remnants of the cocoon in the models described above.
Chandra X-ray images also show cavities that are not coincident with bright radio lobes, for example in Abell 2597 (McNamara et al., 2001), Perseus (Fabian et al., 2000), and Abell 4059 (Heinz et al., 2002). These structures are referred to as “ghost cavities”. The relativistic electrons in the radio lobes are expected to lose enough energy via synchrotron emission to become invisible in the radio after 50 to 100 Myr. If this interpretation is correct, the ghost cavities are buoyantly rising relics of a radio outburst that ended at least 50 to 100 Myr ago (Soker et al., 2002).
The commonly observed “cold fronts” discovered by Chandra can also provide hints regarding the effect of AGN on the intracluster medium. Cold fronts are sharp discontinuities in X-ray surface brightness marking boundaries between hotter and colder masses of gas in the ICM. The density and temperature jumps inferred for cold fronts through deprojection analysis are consistent with continuous pressure changes across the fronts, showing that the discontinuities are not shocks (Markevitch et al., 2000). While cold fronts are usually explained as remnants of past merger events, they have been observed also in apparently regular clusters such as RXJ 1720.1+2638 (Mazzotta et al., 2001a), Abell 1795 (Markevitch et al., 2001), 2A 0335+096 (Mazzotta et al., 2003), and MS 1455.0+2232 (Mazzotta et al., 2001b). The gas sloshing induced by the motion of a pre-existing cavity may explain these observations (Mazzotta et al., 2003).
The H filaments observed in the core of the Perseus cluster also appear to be related to the upward motion of the cavities. In particular, some filaments seem drawn up in a laminar flow in the wake of a ghost cavity, also tracing well-defined arcs that resemble a circulation flow. This suggests that the medium is not turbulent and has a non-negligible viscosity (Fabian et al., 2003b).
Studies of the heating of the ICM through energy injection by AGN have also been performed using analytical and semi-analytical models (Begelman, 2001; Ruszkowski & Begelman, 2002; Böhringer et al., 2002; Churazov et al., 2002; Kaiser & Binney, 2003; Brüggen, 2003a; Mathews et al., 2003, 2004, 2006; Roychowdhury et al., 2004), which, however, describe these systems in very general terms. This is due to the fact that the dynamics of the hot plasma in the ICM is a very complex problem, owing to its intrinsic three-dimensionality, and to the chaotic interactions between plasma and ICM. While analytical models of buoyant bubbles have been produced (Gull & Northover, 1973; Churazov et al., 2000; Soker et al., 2002; Kaiser et al., 2005), the main tool of investigation consists of numerical simulations. The interaction of the radio sources with the ICM has been simulated so far in different ways. Their formation is often modeled by injecting energy or hot plasma directly into the ICM (Quilis et al., 2001; Brighenti & Mathews, 2002a, b, 2003; Brüggen & Kaiser, 2002; Brüggen et al., 2002, 2005; Brüggen, 2003b; Ruszkowski et al., 2004a, b; Dalla Vecchia et al., 2004; Jones & De Young, 2005; Vernaleo & Reynolds, 2006), rather than reproducing detailed AGN jets as discussed above. This approach enables one to study repeated bursts of activity, whereas jet simulations at high resolution are usually unable to cover long evolutionary times. In a different approach, the phase of buoyancy is reproduced by modelling the radio sources as bubbles of hot plasma (Churazov et al., 2001; Brüggen & Kaiser, 2001; Saxton et al., 2001; Robinson et al., 2004; Reynolds et al., 2005), thus neglecting the phase of formation of cavities, and starting from a configuration in pressure equilibrium similar to observations. A review of simulations of hot plasma in clusters is given in Gardini & Ricker (2004).
We aim to investigate the properties of the ICM, the dynamical evolution of the radio cavities and their impact on the environment, by means of simulations of increasing complexity and realism. In this paper we show the results of a first set of three-dimensional (3D) hydrodynamical simulations in which cavities are modeled as buoyant bubbles in the atmosphere of a cool core cluster, together with two-dimensional (2D) test cases. With respect to previous similar numerical experiments, we achieve a rather high effective numerical resolution (10243 grid elements), and account at the same time for the cooling of the gas. Similar simulations have been performed in three dimensions only by Reynolds et al. (2005), who focus on the effect of ICM viscosity on the bubble evolution and therefore neglect cooling. This work deals both with the dynamics of the bubbles and their effect on the cooling of the ICM. We also stress the reliability and robustness of the results, in order to use them as reference for future simulations.
The paper is organized as follows: in §2 we describe the characteristics of the simulations and of the code. In §3 we describe the evolution of the simulations, while the effects of bubbles on the cool core are discussed in §4. Finally, in §5 we summarize our results and discuss future developments of this work.
2 Characteristics of simulations
We defined the cluster parameters in order to resemble the observed characteristics of Abell 2390, a massive galaxy cluster with a significant cool core. We model the gravitational potential according to the Navarro, Frenk & White (1997) density distribution for dark-matter halos,
| (1) |
and keep it fixed during each run. We set the scale radius to 520 kpc, while the scale density g/cm3 is derived by imposing the requirement that the virial mass () of the cluster be equal to M, after assuming the Hubble parameter and redshift ; the corresponding virial radius is then Mpc.
The initial gas temperature profile is shown in Figure 1; it is constructed as an analytic adaptation of the profile of Abell 2390 proposed by Zakamska & Narayan (2003), which in turn reproduces by eye the temperature profile obtained by deprojection from Chandra observations by Allen et al. (2001). The expression for is
| (2) |
which requires that the temperature rise from keV at the center up to keV at the scale radius. Beyond the scale radius we assume that the gas temperature drops like , as suggested by the results of De Grandi & Molendi (2002). The definition of is
| (3) |
with
| (4) |
and
| (5) |
where the radius kpc encompasses the part of the cluster where .

The gas density profile is obtained by solving the equation of hydrostatic equilibrium with the condition that the gas fraction inside the virial radius be , approaching the cosmic value (see e.g. Spergel et al., 2003). In Figure 2 we show the profile of the cooling time for the initial conditions according to the cooling function of Sutherland & Dopita (1993) used in the code. It is worth noting that the region of the cluster where Gyr spans only 12 kpc. The adiabatic index of the ICM is set to , assuming a monatomic perfect gas. We tested the equilibrium of the initial configuration of the ICM by running a 2D simulation without cooling or bubbles. After Myr, readjustments in the physical quantities (density, pressure, etc.) amounted at most to 1%.

The rising radio lobes are simulated as a pair of spherical bubbles in the ICM, placed symmetrically with respect to the cluster center. Inside the bubbles, we set the gas density and pressure respectively to 1/100 of and the same value as the ICM’s quantities at the same radius; we also impose in the bubble material because the plasma is relativistic. We did not attempt to include the ICM displaced from these cavities during the phase of bubble formation. In the following we will refer to the two gas components which had and respectively as ICM and bubble plasma.
The different characteristics of the 3D runs are summarized in Table 1. The letters CO (cooling only) identify simulations performed without bubbles. In simulations with bubbles, the initials SB (single bubble pair) are followed by the radius kpc of the bubbles and the distance of their centers from the center of the cluster. The increasing computational cost did not permit us to run the simulations for their entire cooling time, but they cover a significant fraction of it, up to Myr. A set of simulations with kpc halted at earlier stages of evolution and has not been included in this analysis. All of these simulations are performed on a Cartesian grid. We also created a number of 2D simulations in cylindrical coordinates to test and extend the 3D results. Because of the symmetry of the system, it can be noted that the same amount of information extracted by a 3D simulation could be obtained through a faster and computationally cheaper 2D counterpart. We noticed, however, that the two bubbles in these 2D runs evolve in a similar but not fully symmetric manner. This is probably due to a greater amplification of rounding errors in this particular system of coordinates with respect to the Cartesian grid. The evolution of the bubbles and their effect on the medium are nonetheless in agreement with the 3D cases until they are available, and this encouraged us to trust the 2D results, at least as checks or hints of the overall evolution of the system. We will not discuss the 2D runs extensively but we will report their results when necessary.
| Name | 111The box size in kpc | 222The maximum resolution in pc | 333The radius of the bubbles in kpc | 444The distance of the center of the bubbles from the center of the cluster in kpc | 555The internal energy of the bubbles in units of erg | 666The time of the final output of the simulation in Myr |
|---|---|---|---|---|---|---|
| CO | 4800 | 4688 | - | - | - | 500 |
| CO2 | 600 | 586 | - | - | - | 250 |
| SB1011 | 600 | 586 | 10 | 11 | 337 | 250 |
| SB1020 | 600 | 586 | 10 | 20 | 281 | 250 |
| SB1030 | 600 | 586 | 10 | 30 | 235 | 250 |
The 3D computational box is centered on the cluster center and in general spans 600 kpc; its dimensions are a good compromise between resolution and the need to avoid spurious boundary effects. Because we chose reflecting boundary conditions to conserve mass and energy, the box size has to be large enough that the cooling flow and the bubbles are unaffected. We achieve a maximum resolution of pc, comparable to the electron mean free path in the cluster core, when magnetic fields are neglected (Sarazin, 1988). The CO model, which uses a box size of 4800 kpc and a resolution of kpc, is a test case for the development of the cooling flow in a larger box.
The cooling function of Sutherland & Dopita (1993) is implemented in the code; we shut off cooling below a temperature of 104 K and assume an ICM metallicity of .
All simulations are performed using FLASH (Fryxell et al., 2000), a parallel Eulerian hydrodynamic code which implements the piecewise-parabolic method (PPM) of Colella & Woodward (1984) on an adaptive mesh. Grid cells are grouped in blocks, which are refined or derefined according to the maximum value of the second derivative of pressure or density (Löhner, 1987). In 3D simulations the volume is divided into blocks at the coarsest level of refinement, and each block contains cells. Up to 6 levels of refinements are allowed, with a factor of two refinement between levels.
FLASH manages mixtures of gases using the method of Colella & Glaz (1985) to handle general equations of state. For the purposes of this work it is worth noting that each fluid element in the simulation is composed of a fraction of both the ICM and the bubble plasma, and that all of the physical quantities, such as density, temperature and pressure, are evaluated on the mixture of the two species. In particular to each cell it is assigned a weighted average adiabatic index as
| (6) |
where is the mass fraction of the th species and its adiabatic index. This left us with two possible problems: on one hand, mixing is not properly treated in these simulations because the diffusion of species is not explicitly accounted for. On the other hand, the temperature in the plasma elements drops quickly as they are polluted by the ICM, but the relativistic value of their adiabatic index does not change. We address the possible effects of these inconsistencies in the following sections.
3 Evolution of simulations
3.1 The development of the cooling flow
The simulations named CO and CO2 in Table 1 allow the ICM to cool, in the absence of bubbles or any source of heating. They reproduce the effect of cooling on the ICM starting from the equilibrium configuration assumed in the initial conditions. The simulations are identical except for the box size and the corresponding resolution.
Figure 3 shows the evolution of temperature , electron density , entropy , and pressure in the central part of the cluster due to cooling. Profiles are obtained for the CO2 (solid lines) and CO (dashed lines) simulations by averaging on density and assuming a bin interval of 3 kpc. The temporal evolution for the CO2 simulation is represented by the line thickness, which decreases with time: profiles are computed at intervals of 50 Myr from the initial conditions up to Myr. The dashed lines represent the profiles of the same quantities in the CO simulation to Myr and Myr; at Myr we also added squares to the dashed line to facilitate visual comparison. The figure shows that the profiles at Myr are practically coincident to the limit of resolution; this implies that the finite size of the box does not induce spurious effects in the CO2 simulation.

As expected, these runs show the establishment of an homogeneous cooling flow which evolves in a runaway manner (White & Sarazin, 1987). Because of the long cooling time, it is not surprising that the temperature of the core drops only to K after the first 250 Myr. Using a 2D simulation with the same resolution as the CO2 case, we checked that the central temperature falls to the minimum value between and 400 Myr. We will use the profiles obtained in the CO2 case as references for the same quantities computed in the presence of bubbles.
3.2 The rise of the bubbles
The rise of spherical bubbles of plasma in a cluster atmosphere has been described in many papers (e.g. Churazov et al., 2000). We observe that the evolution of bubbles in the ICM resembles quite closely the dynamics of powerful explosions in the earth’s atmosphere, or more generally of “thermals”, which are spherical bubbles of hot air in pressure equilibrium with the surrounding colder air. In the latter case, the main difference resides in the fact that thermals are only slightly hotter and less dense than the surrounding air; this produces a rather different behavior, and thermals are able to rise in the atmosphere much higher than their initial diameter, expanding linearly with time (Turner, 1973). Studies of thermals can hence adopt the Boussinesq approximation in computations and perform experiments using liquids. Nevertheless, some of the behavior of thermals, such as their internal motions, presents remarkable similarities with the behavior of plasma bubbles. The behavior of spherical bubbles in water also resembles, for a proper choice of parameters, the behavior of plasma bubbles (e.g. Walters & Davidson, 1963).
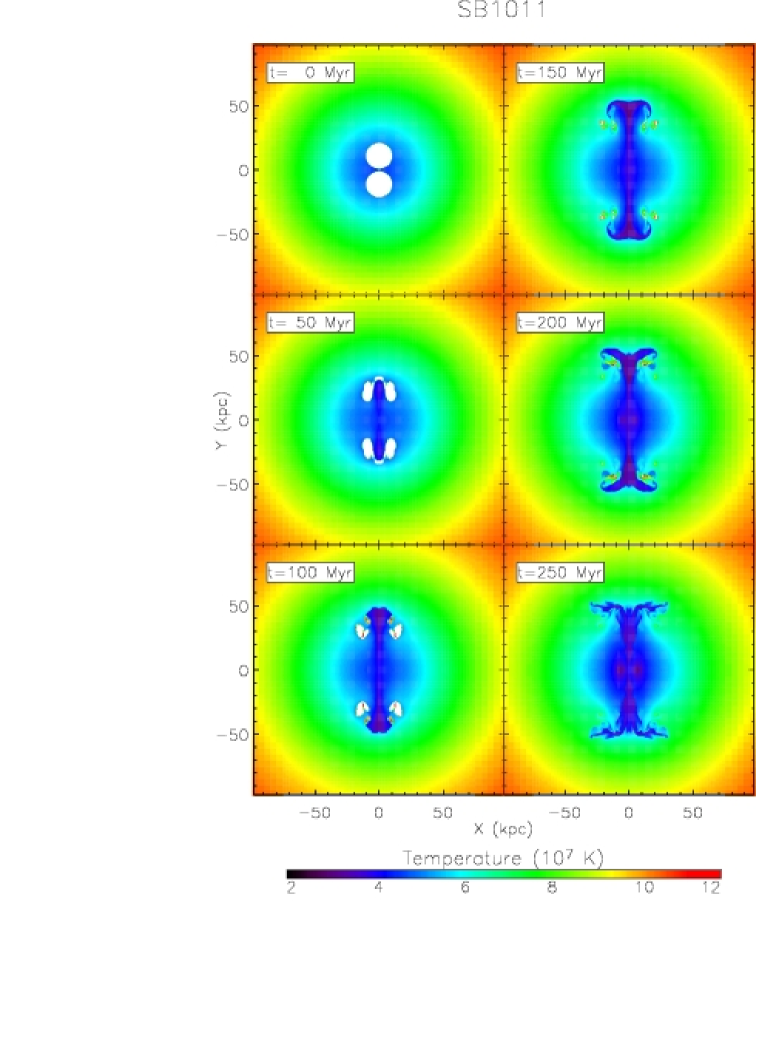
The evolution of the 3D simulations with bubbles is shown in Figures 4 to 9 through maps constructed by cutting the simulations along one of the planes of symmetry which contain the centers of the cluster and the bubbles. We concentrate on the simulation SB1011 as representative of the sample, and will refer to the other 3D simulations only when their behavior is quite different with respect to it.
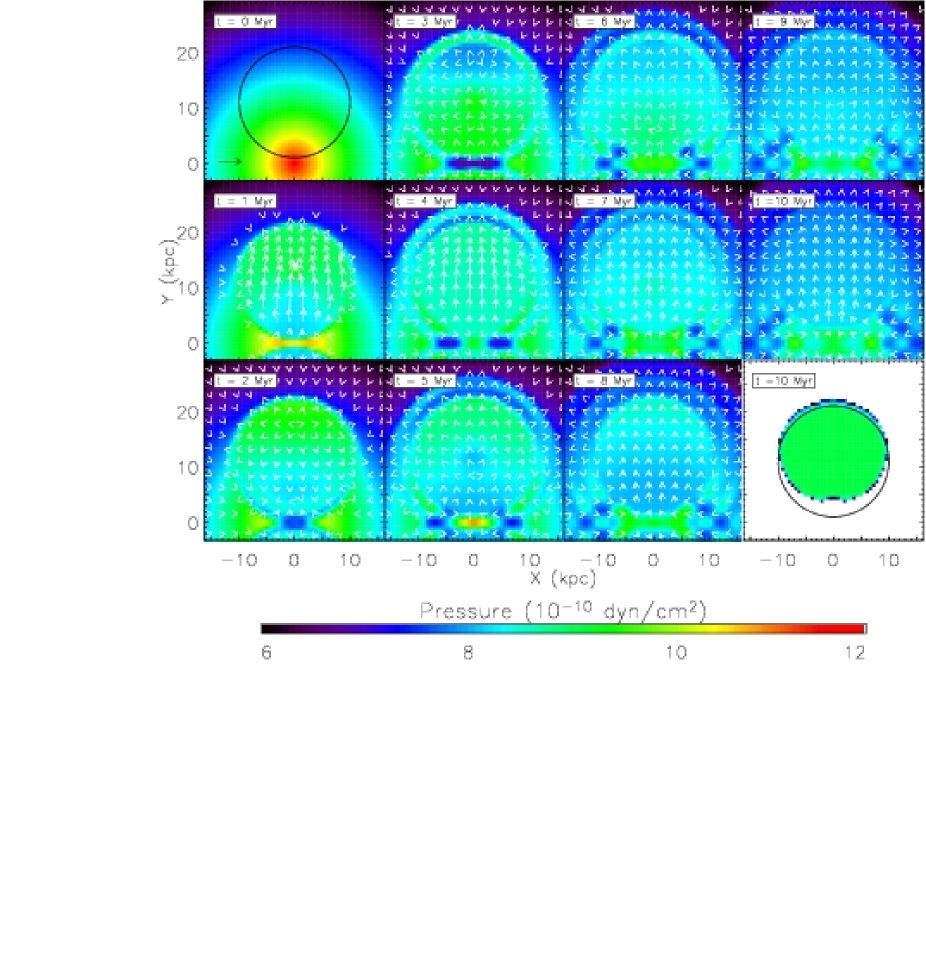
We paid some attention to the first stages of the evolution, namely the starting of the bubble from rest and the generation of sound waves. This phase is usually neglected in the literature as transient and unrealistic (see however Churazov et al., 2002) despite the fact that sound waves are often clearly visible in figures. In Figure 4 we show the evolution of the pressure and velocity fields during the first 10 Myr. The plots show how the bubble plasma oscillates vertically and generates sound waves, while motions are driven into the adjacent ICM at the same time. At the time of the last snapshot, a vortex circulation directed upward along the bubble axis and downward on the bubble surface (Hill, 1894; Batchelor, 1967) is established in the plasma and in the surrounding ICM. This kind of circulation enables the bubble to rise steadily (Turner, 1973).
During the rise that follows the initial transient phenomena, each bubble is affected by instabilities on its surface due to lack of surface tension. In particular it will suffer Rayleigh-Taylor (RT) instabilities on the top and Kelvin-Helmoltz (KH) instabilities on its flanks. In the end, however, it is the vortex circulation itself which mostly affects the bubble. Indeed, in an ideal case a stagnation layer should be established in the ICM below the bubble, but in reality, as the bubble rises, the fall of pressure at its bottom draws the ICM upward, where it is entrained in the vortex circulation, thus acting as an effective RT instability.
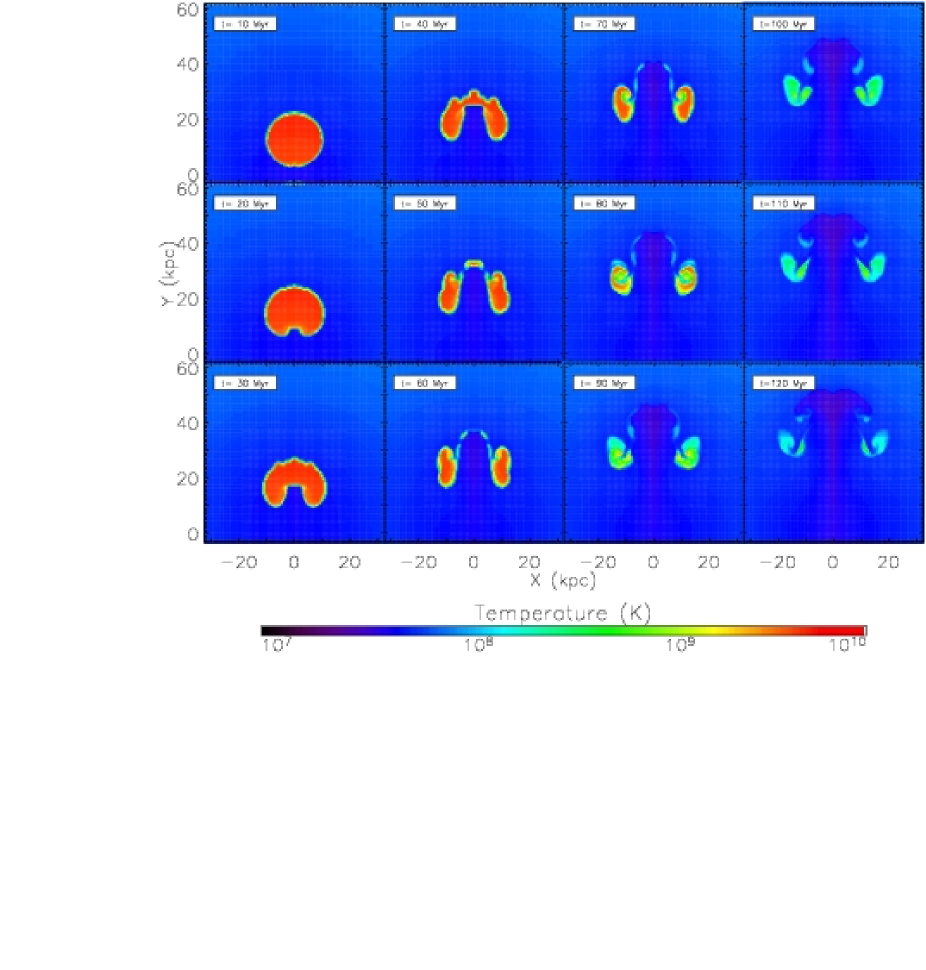
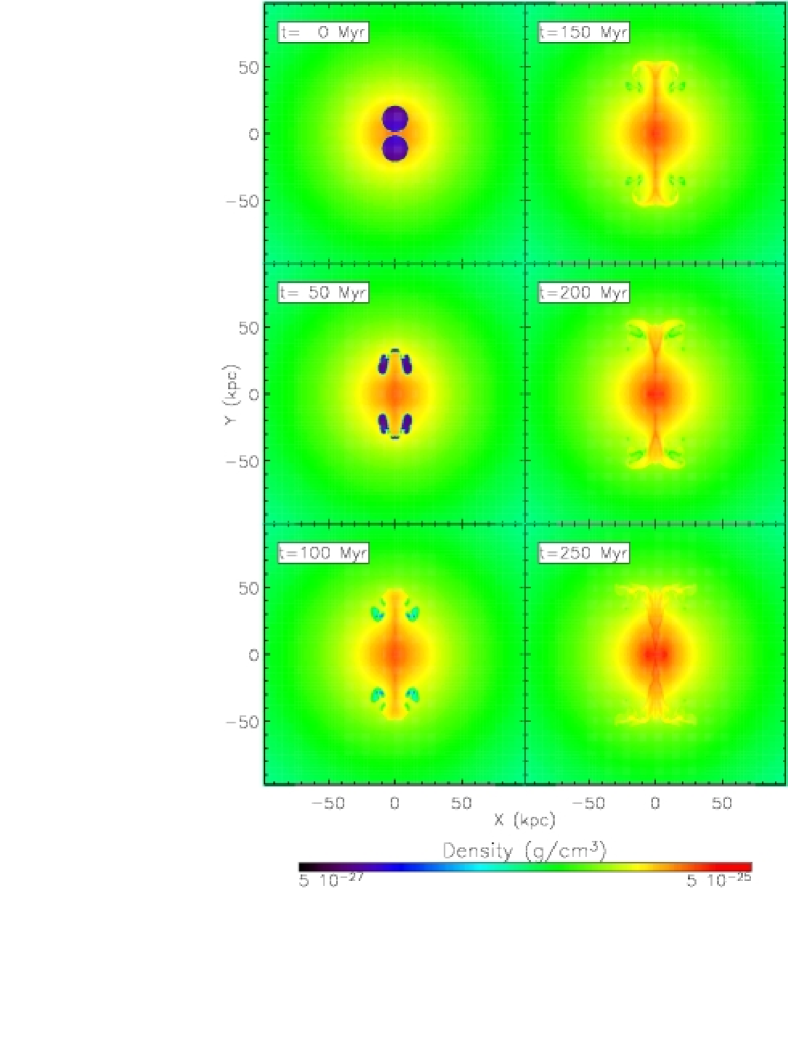
The evolution of the rising bubbles is depicted in Figure 5 with intervals of 10 Myr up to Myr and in Figures 6 to 8 with intervals of 50 Myr up to Myr. As long as the bubble rises, a trunk of denser material is entrained in its wake, which penetrates it from below and gives it a mushroom shape. As expected in the development of RT instabilies, the uplifted material rises faster and eventually bisects the bubble, which then assumes the shape of a rotating torus (or vortex ring). It is worth noting that the ICM entrained by the bubble cools by expansion because of the lower pressure, and at some times it is the coldest material in the cluster. As the evolution goes on, the lower part of the trunk falls back to the cluster center, while the upper part remains at large radii as long as it is driven in the vortex circulation.
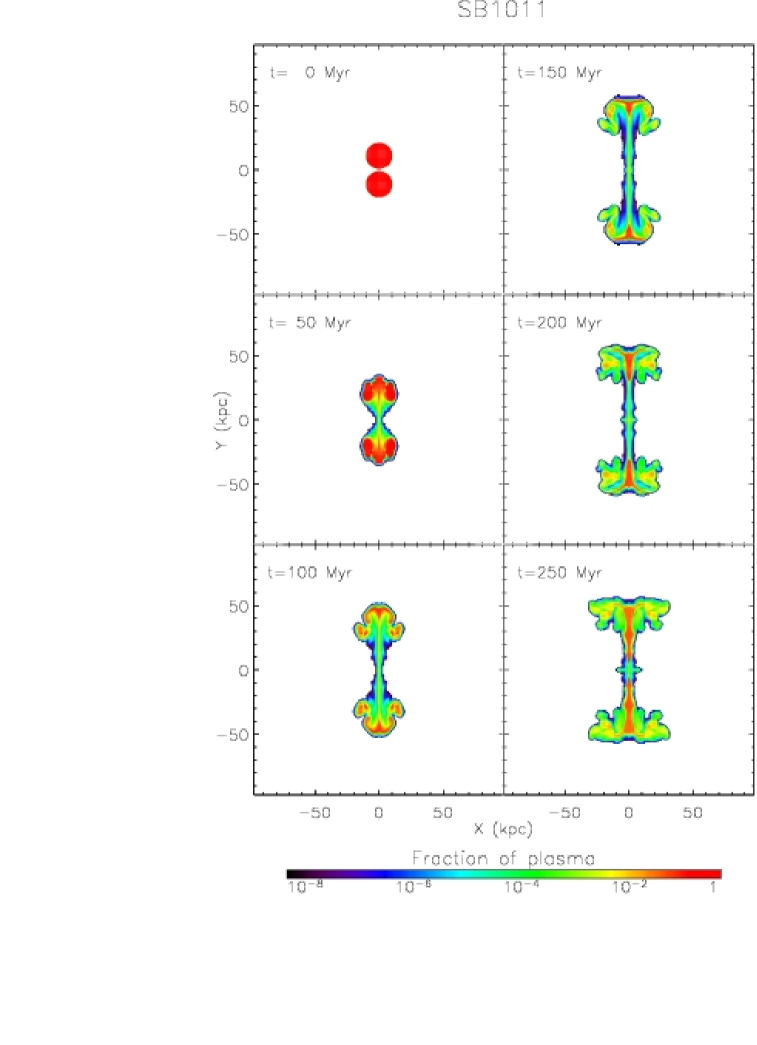

Defining the borders of the bubbles becomes a harder task as the simulation proceeds. Figure 8 shows the fraction of the bubble plasma in the fluid elements. Inspection of these values shows clearly that all of the hot plasma has mixed completely with the ICM after 100 Myr. In particular, the plasma picked up along the bubble axis by the rising ICM cools rapidly to low temperature due to the high density of the entrained ICM and should no longer be treated as relativistic. In the vortex ring, the plasma is also mixed with the ICM, but because of the lower density of the polluting ICM, the mixture still preserves buoyancy and a high temperature.
As stated above, despite its relevance for the evolution of the bubbles and the ICM dynamics, mixing is not properly treated in these simulations because the diffusion of species is not explicitly accounted for. We address this point by checking that the amount of mixing remains stable with respect to increases in resolution. We ran a 2D simulation with the same characteristics as the SB1020 case and compared it with an identical 2D simulation with two additional levels of refinement. We found that both simulations show the same amount of mixing up to Myr, despite the fact that the plasma distribution shows narrower features in the second case, as expected. We consider that the mixing should eventually increase in the 2D simulations due to their enhanced sensitivity to instabilities; hence the fact that the amount of mixing remains the same is a proof of its robustness.
The vortex rings evolve similarly in the different simulations. In all of the models the rings are affected by instabilities at regular distances along their length that act to break the rings into smaller sections. It is worth noting that the positions of the break points along the rings are symmetric with respect to the principal vertical planes of the system, and hence the instabilities do not reflect the axial symmetry of the cluster but the geometry of the computational grid. In the SB1011 simulation, the rings are already broken in the last outputs exactly along the plane of the maps, so that it seems in Figure 6 that only some remnants are slightly hotter than the surrounding medium after Myr. However, this is not the case: the hot material is concentrated outside of the plane of the figure. In the SB1020 and SB1030 simulations, the vortex rings are not yet broken by the end of the run, but instabilities are effectively breaking them outside the plane of the image. In all of the simulations the rings preserve high temperatures despite the fact that the fraction of bubble plasma inside them is less than 10%.
We quantify the evolution of the bubbles in Figure 10, which shows the height of the centroid of the plasma material as a function of time. The dashed lines describe the value of the height of the centroid of all of the plasma, while the solid lines depict the same quantity for the plasma that is hotter than K (the maximum temperature of the ICM inside kpc). The thickness of the lines distinguishes among the different simulations. The three simulations show remarkably similar behavior: the hotter material, which effectively defines the bubbles, rises by kpc in the first 100 Myr, and then decreases its speed until the end of the simulation. The average speed is then km/s for the first 100 Myr, which can be compared to the speed of sound in the ICM, ranging from km/s at the center to km/s at kpc. The differences between the values for the overall plasma and the hottest plasma at the beginning of the simulation are explained by the fact that, due to the finite grid size, a portion of bubble material is mixed with the ICM already in the initial conditions. Initially this material is less affected by buoyancy, and it is driven upward later in the bubble wake. The rising of the trunk of cold gas, the sweeping of the plasma on the bubble axis and the establishment of a cold cap above the ring, are also well represented by the rise of the overall centroid higher than the hot plasma. The succeeding decrease depicts the falling back of the cold material along the trunk.

The centroid of the hot material still seems to rise steadily in the last outputs of our simulations, but inspection of the fraction of plasma that is still hot, depicted in Figure 11, shows that the plasma in the SB1011 simulation is rapidly cooling. In the SB1020 and SB1030 simulations, it instead appears that the fraction of hot plasma is stable around 35% in the final output.

To explore the later stages of the evolution, we turn again to 2D simulations with the same parameters and resolution as the 3D cases. In general, these simulations show that material continues to fall along the trunks down to the cluster center, while the ICM already present there is displaced orthogonally and settles into a torus. The trend then reverses and the material in the torus falls back onto the core, driving back upward the material that has fallen along the trunks. Overall, this resembles a sort of oscillatory motion, but it becomes more turbulent as the simulation proceeds. We halt the simulations when some plasma element cools close to the minimum temperature and the computational time step becomes too short; we can suppose that a runaway cooling similar to the homogeneus cooling flow is established at that time. Vortex rings are preserved until the end of the run, deforming and slowly rising for few kpc more.
4 Effects of bubbles on the cooling
It has been observed that AGNs might heat the ICM and possibly quench cooling flows in any of several different ways. In particular, it has been predicted (e.g. Heinz et al., 1998) and shown by simulations (Zanni et al., 2005; Brüggen et al., 2005) that most of the jets’ energy is transferred to the ICM through the bow shock and the sound waves pushed by the expanding cocoon. These processes deposit energy into the ICM as the jets cross it, affecting the ICM at a distance from the radio source itself and possibly outside the cool core, unless some viscosity or thermal conductivity is present (Ruszkowski et al., 2004a, b; Brüggen et al., 2005; Fabian et al., 2005). On the other hand, energy is still stored in the cavities as thermal energy and in the ICM in potential form during the later phase of evolution by buoyancy. Both these forms of energy are released during the rise of the cavities: the first through work performed by the cavities, which expand in order to reach or maintain pressure equilibrium with the environment (e.g. Begelman, 2001), and the second when the surrounding medium falls in around the cavity to fill the space the bubble previously occupied (e.g. Churazov et al., 2002; Bîrzan et al., 2004). Work and thermal energy exchange also occur when portions of the ICM at different temperatures and pressures come into contact and mix, after being displaced by motions induced by the rise of the cavities (Quilis et al., 2001; Churazov et al., 2002; Dalla Vecchia et al., 2004). This mechanism becomes more effective in heating the cool core as more material is radially displaced.
Despite the presence of bubbles, our simulations show that a cooling flow is established in the central regions of the cluster (Figures 6 and 9). This is even more true as the initial location of the bubbles is moved away from the center. This is hardly surprising, given that bubbles are the outcome of a single burst of energy injection while cooling is continously operating in the ICM. Nonetheless, bubbles affect the ICM and can slow down its cooling effectively; in the following we investigate how and by what amount.
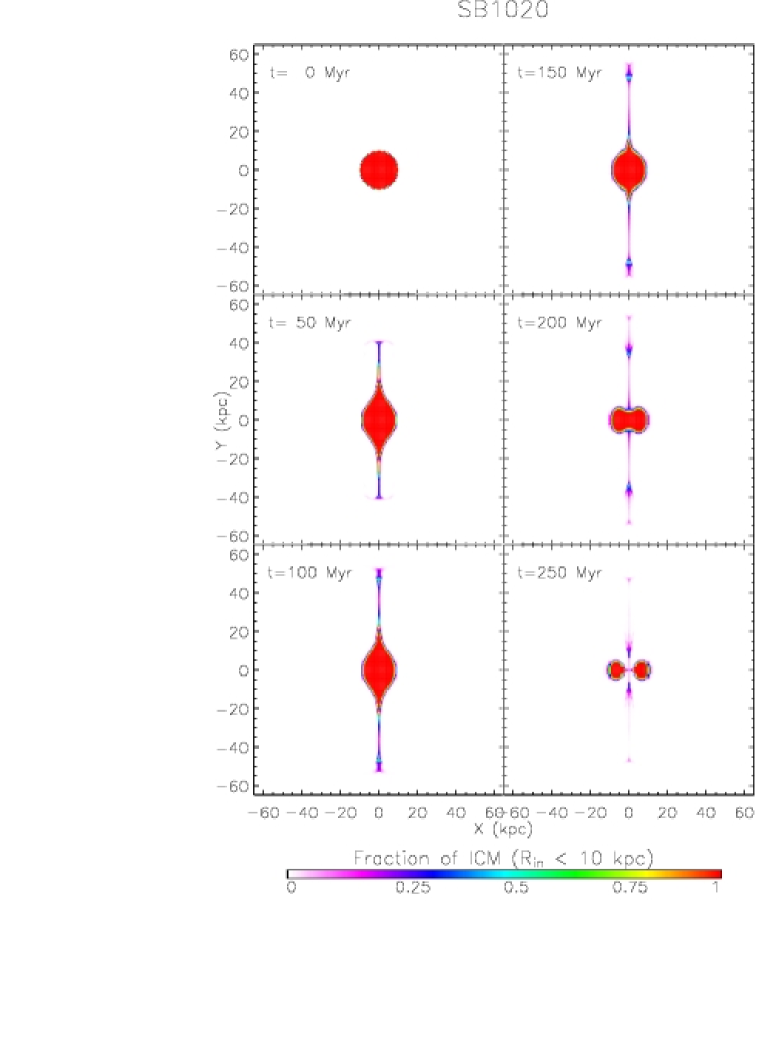
Because of the dependence of gas emissivity upon density (approximately ), cooling is enhanced by deposition and compression of material. Thus, we observe that bubbles affect the cooling firstly by their mere presence, because of the removal from their volumes of some fraction of the cold ICM already stored in the core. Even if this can be regarded as an artifact of our setup, we expect that a similar effect is produced on the ICM by displacement and shock heating during bubble inflation. Later, some amount of thermal energy is directly deposited in the ICM through mixing with the bubble material, while stirring of the ICM due to the bubble rise is expected to reduce the deposition of cooling material to the core. To investigate the effects of the gas motions on the cooling, we performed a new run of the SB1020 case using a tracer fluid to mark the fluid elements initially stored inside kpc; we show in Figure 12 the evolution of their distribution. We observe that in the first stages of evolution, the central material is stretched and uplifted in the bubbles’ wake and expands rather than being compressed. Later on, material indeed falls onto the core, but because of the geometry, it accumulates directly at the center rather than on the cold ICM, which is displaced instead into a torus. A similar analysis was performed also in the SB1011 case; its results are similar to SB1020 up to Myr, when the run halts.
We measure the effects of the bubbles on the cooling by comparing the temperature profiles with the profiles of the CO2 model. This is done in Figure 13, which reports the difference from the initial conditions up to Myr with intervals of 50 Myr. It must be remembered that, as depicted in Figure 3, in the absence of bubbles the gas cools about K during the first 250 Myr of evolution, while the cooling is much faster at later times. Hence, a slight gain in the core temperature can be indicative of a significantly longer evolution of the cooling process. The bubbles in simulation SB1011 have the greatest effect on the cooling, as expected, due to their proximity to the core of the cluster. In this case the temperature is increased with respect to the CO2 simulation in all of the region inside kpc for most of the run. At Myr, the temperature difference reaches K. The most interesting result comes from the SB1020 simulation. In this case the cooling in the center proceeds apparently as in the CO2 case up to Myr. After this time, however, the central temperature drops more slowly, and in the final snapshot K. This is due to the replacement of the cold material in the core by the dense gas falling to the center along the trunks. In the SB1030 simulation the core of the cluster instead appears completely unaffected by the presence of bubbles up to the end of the run at Myr. However, because dense gas is clearly falling along the trunks at that time, a later heating as in SB1020 cannot be excluded. Because of the fraction of plasma entrained in the core (Fig. 8), we wondered if the higher temperature of the infalling material was due to mixing. Therefore we computed the profiles of the fraction of internal energy due to the bubble plasma as shown in Figure 14. At Myr, we found that the internal energy directly deposited in the ICM amounts at most at 2% everywhere except in the shells hosting the vortex rings.


The use of 2D simulations enables us to extend this analysis up to the establishment of runaway cooling when some gas element reaches the mimimum temperature. In the case of the homogeneus cooling flow, we saw that this happens soon after Myr. In SB1011, after a turbulent oscillation, runaway cooling is established in the core at some time after Myr. SB1020 presents an analogous behavior, but because of the later infall, the cooling flow is more rapidly re-established and the runaway phase starts at Myr. In the SB1030 case, the infalling material does not reach the center but rather compresses the material already present in the core; the effect is to enhance the cooling so that the runaway phase begins after Myr.
5 Conclusions
We show the results of a set of 3D simulations of buoyant bubbles in the atmosphere of a cool core cluster. We allow cooling, consider the bubble plasma as relativistic, and achieve high effective resolution. We consider the presented simulations to be a first step in studying the interaction of plasma bubbles with the ICM. We will use these runs as references for future work with different configurations of the system and additional physics.
The dynamics of our bubbles resembles the results described by Saxton et al. (2001) and by Reynolds et al. (2005). Saxton et al. (2001) produce a set of 2D simulations similar to SB1030 for different values of the ratio of the density of plasma versus ICM. They remark upon the robustness of the vortex rings and the fall of entrained material to the core along the trunks; as in SB1030, this material simply deposits onto the core rather than disrupts it. Reynolds et al. (2005) study the evolution of bubbles for different values of the ICM viscosity using 3D simulations. In a reference case without viscosity the bubble evolves similarly to SB1011, deforming in vortex rings with a thin trunk of material entrained in its wake. Each of these studies focuses on the evolution of bubbles, rather than on their impact on the environment, and therefore neglects cooling.
Our simulations do not fully address the problem of the quenching of the cooling flow by AGN, because the phase of activity is neglected and many simplifications are assumed in the setup. We address, however, the direct effect of our bubbles on the cooling and find that it is rather modest. Even in the SB1011 case, runaway cooling is postponed only by about 25% respect to the unperturbed case. Setting the bubbles further away only reduces their effect, or even accelerates the cooling as in SB1030. Larger bubbles will probably have a bigger impact, but the dimensions chosen in our cases are typical (Bîrzan et al., 2004).
Numerically, the results are quite robust with respect to increase in resolution and the adoption of different systems of coordinates. Thus we conclude that our resolution is adequate. Details are different, however, and 2D simulations are much more sensitive to the propagation of rounding errors. For this reason we prefer to trust the 3D cases and use 2D simulations only to extend their results. To a lesser extent, 3D simulations suffer numerical instabilities as well, as revealed by the shredding of vortex rings along the lines of the computational grid. One technique for mitigating grid effects involves just adding some random noise in the initial conditions, as in Jones & De Young (2005). The symmetry of our results, however, testifies to the reliability of the code.
Future work will consider some relevant physics that is not included in the present simulations. In particular, we will consider the magnetic field and the ICM viscosity, which have been shown to be able, for proper values, to stabilize the bubble surface. Using more realistic initial conditions, we will take into better account the activity phase of AGN and its effects on the medium. The introduction of thermal conduction can be relevant in heating the entrained cold gas as it rises to regions of higher temperature, besides directly heating the cluster core. Mixing of hot and cold gas should also be properly treated, as well as the transition of the plasma to the non-relativistic regime. We aim to study also the interaction of pre-existing bubbles with shock waves induced by AGN activity or merger events (Enßlin & Brüggen, 2002; Heinz & Churazov, 2005). Finally, a direct comparison with X-ray observations is possible using tools like X-MAS (Gardini et al., 2004).
Acknowledgements.
The author acknowledges support under a Presidential Early Career Award from the U.S. Department of Energy, Lawrence Livermore National Laboratory (contract B532720) as well as the National Center for Supercomputing Applications. He wishes to thank Paul Ricker for his huge contribution to many aspects of this work. He also wishes to thank Robert Wilhelmson for useful reading suggestions. FLASH was developed at the University of Chicago ASC Flash Center under support provided by Department of Energy grant number B341495.References
- Alexander (2002) Alexander, P., 2002, MNRAS, 335, 610
- Allen et al. (2001) Allen, S. W., Ettori, S., & Fabian, A. C., 2001, MNRAS, 324, 877
- Ball et al. (1993) Ball, R., Burns, J. O., & Loken, C., 1993, AJ, 105, 53
- Bałucińska-Church et al. (2005) Bałucińska-Church, M., Ostrowski, M., Stawarz, Ł., & Church, M. J., 2005, MNRAS, 357, L6
- Barthel & Arnaud (1996) Barthel, P.D., & Arnaud, K. A., 1996, MNRAS, 283, L45
- Basson & Alexander (2003) Basson, J. F., & Alexander, P., 2003, MNRAS, 339, 353
- Batchelor (1967) Batchelor, G. K., 1967, An Introduction to Fluid Dynamics (Cambridge: Cambridge Univ. Press)
- Begelman (2001) Begelman, M. C., 2001, Impact of Active Galactic Nuclei on the Surrounding Medium in ”Gas and Galaxy Evolution”, ASP Conference Proceedings, Vol. 240. Ed. J. E. Hibbard, M. Rupen, and J. H. van Gorkom. San Francisco: Astronomical Society of the Pacific, 363
- Begelman & Cioffi (1989) Begelman, M. C., & Cioffi, D. F., 1989, ApJ, 345, L21
- Bîrzan et al. (2004) Bîrzan, L., Rafferty, D. A., McNamara, B. R., Wise, M. W., & Nulsen, P. E. J., 2004, ApJ, 607, 800
- Blandford & Rees (1974) Blandford, R. D., & Rees, M. J., 1974, MNRAS, 169, 395
- Blanton et al. (2001) Blanton, E., L., Sarazin, C. L., McNamara, B. R., & Wise, M. W., 2001, ApJ, 558, L15
- Böhringer et al. (2002) Böhringer, H., Matsushita, K., Churazov, E., Ikebe, Y., & Chen, Y., 2002, A&A, 382, 804
- Brighenti & Mathews (2002a) Brighenti, F., & Mathews, W. G., 2002a, ApJ, 573, 542
- Brighenti & Mathews (2002b) Brighenti, F., & Mathews, W. G., 2002b, ApJ, 574, L11
- Brighenti & Mathews (2003) Brighenti, F., & Mathews, W. G., 2003, ApJ, 587, 580
- Brüggen & Kaiser (2001) Brüggen, M., & Kaiser, C. R., 2001, MNRAS, 325, 676
- Brüggen & Kaiser (2002) Brüggen, M., & Kaiser, C. R., 2002, Nature, 418, 301
- Brüggen et al. (2002) Brüggen, M., Kaiser, C. R., Churazov, E., & Enßlin T. A., 2002, MNRAS, 331, 545
- Brüggen (2003a) Brüggen, M., 2003a, ApJ, 593, 700
- Brüggen (2003b) Brüggen, M., 2003b, ApJ, 592, 893
- Brüggen et al. (2005) Brüggen, M., Ruszkowski, M., & Hallman, E., 2005, ApJ, 630, 740
- Burns (1990) Burns, J. O., 1990, AJ, 99, 14
- Churazov et al. (2000) Churazov, E., Forman, W., Jones, C. & Böhringer, H., 2000, ApJ, 356, 788
- Churazov et al. (2001) Churazov, E., Brüggen, M., Kaiser, C. R., Böhringer, H., & Forman, W., 2001, ApJ, 554, 261
- Churazov et al. (2002) Churazov, E., Sunyaev, R., Forman, W., & Böhringer, H., 2002, MNRAS, 332, 729
- Clarke et al. (1997) Clarke, D. A., Harris, D. E., & Carilli, C. L., 1997, MNRAS, 284, 981
- Colella & Glaz (1985) Colella, P. & Glaz, H. M., 1985, JCP, 59, 264
- Colella & Woodward (1984) Colella, P. & Woodward, P., 1984, JCP, 54, 174
- David et al. (2001) David, L. P., Nulsen, P. E. J., McNamara, B. R., Forman, W., Jones, C., Ponman, T., Robertson, B., & Wise, M., MNRAS, 2001, ApJ, 557, 546
- Dalla Vecchia et al. (2004) Dalla Vecchia, C., Bower, R. G., Theuns, T., Balogh, M. L., Mazzotta, P., & Frenk, C. S., 2004, MNRAS, 355, 995
- De Grandi & Molendi (2002) De Grandi, S., & Molendi, S., 2002, ApJ, 567, 163
- Eilek (2004) Eilek, J. A., 2004, proceedings of the conference “X-Ray and Radio Connections”, eds. Sjowerman, L. O., & Dyer, K. K.
- Enßlin & Brüggen (2002) Enßlin, T. A., & Brüggen, M., 2002, MNRAS, 331, 1011
- Fabian (1994) Fabian, A. C., 1994, ARA&A, 32, 277
- Fabian et al. (2000) Fabian, A. C., et al. 2000, MNRAS, 318, L65
- Fabian et al. (2003a) Fabian, A. C., Sanders, J. S., Allen, S. W., Crawford, C. S., Iwasawa, K., Johnstone, R. M., Schmidt, R. W., & Taylor, G. B., 2003a, MNRAS, 344, L43
- Fabian et al. (2003b) Fabian, A. C., Sanders, J. S., Crawford, C. S., Conselice, C. J., Gallagher, J. S. III, & Wyse, R. F. G., 2003b, MNRAS, 344, L48
- Fabian et al. (2005) Fabian, A. C., Reynolds, C. S., Taylor, G. B., & Dunn, R. J. H., 2005, MNRAS, 363, 891
- Fabian et al. (2006) Fabian, A. C., Sanders, J. S., Taylor, G. B., Allen, S. W., Crawford, C. S., Johnstone, R. M., & Iwasawa, K., 2006, MNRAS, 366, 417
- Forman et al. (2005) Forman, W., et al., 2005, ApJ, 635, 894
- Fryxell et al. (2000) Fryxell, B., et al. 2000, ApJS, 131, 273
- Gardini & Ricker (2004) Gardini, A., & Ricker, P. M., 2004, MPLA, 19, 2317
- Gardini et al. (2004) Gardini, A., Rasia, E., Mazzotta, P., Tormen, G., De Grandi, S., & Moscardini, L., 2004, MNRAS, 351, 505
- Gull & Northover (1973) Gull, S. F., & Northover, K. J. E., 1973, Nature, 244, 80
- Heinz & Churazov (2005) Heinz, S., & Churazov, E., 2005, ApJ, 634, L141
- Heinz et al. (1998) Heinz, S., Reynolds, C. S., & Begelman, M. C., 1998, ApJ, 501, 126
- Heinz et al. (2002) Heinz, S., Choi, Y., Reynolds, C. S., & Begelman, M. C., 2002, ApJ, 569, L79
- Hill (1894) Hill, M. J. M., 1894, Phil. Trans. Roy. Soc. A, 185
- Jetha et al. (2005) Jetha, N. N., Sakelliou, I., Hardcastle, M. J., Ponman, T. J., & Stevens, I. R., 2005, MNRAS, 358, 1394
- Jones & De Young (2005) Jones, T. W., & De Young, D. S., 2005, ApJ, 624, 586
- Kaastra et al. (2004) Kaastra, J. S., et al. 2004, A&A, 413, 415
- Kaiser & Binney (2003) Kaiser, C. R., & Binney, J., 2003, MNRAS, 338, 837
- Kaiser et al. (2005) Kaiser, C. R., Pavlovski, G., Pope, E. C. D., & Fangohr, H., 2005, MNRAS, 359, 493
- Kim & Narayan (2003) Kim, W.-T., & Narayan, R., 2003, ApJ, 596, L139
- Kraft et al. (2003) Kraft, R. P., Vázquez, S. E., Forman, W. R., Jones, C., Murray, S. S., Hardcastle, M. J., Worrall, D. M., & Churazov, E., 2003, ApJ, 2003, 592, 129
- Krause (2003) Krause, M., 2003, A&A, 398, 113
- Krause & Camenzind (2003) Krause, M., & Camenzind, M., 2003, in Transactions of the HLRS 2003, Springer Lecture Notes, eds. Krause E., Jager W., & Resch, M.
- Löhner (1987) Löhner, R., 1987, Comp. Meth. Appl. Mech. Eng., 61, 323
- Makishima et al. (2001) Makishima, K., et al. 2001, PASJ, 53, 401
- Markevitch et al. (2000) Markevitch, M., et al. 2000, ApJ, 541, 542
- Markevitch et al. (2001) Markevitch, M., Vikhlinin, A., & Mazzotta, P., 2001, ApJ, 562, L153
- Mathews et al. (2003) Mathews, W. G., Brighenti, F., Buote, D. A., & Lewis, A. D., 2003, ApJ, 596, 159
- Mathews et al. (2004) Mathews, W. G., Brighenti, F., & Buote, D. A., 2004, ApJ, 615, 662
- Mathews et al. (2006) Mathews, W. G., Faltenbacher, A., & Brighenti, F., 2006, ApJ, 638, 659
- Mazzotta et al. (2001a) Mazzotta, P., Markevitch, M., Vikhlinin, A., Forman, W. R., David, L. P., & VanSpeybroeck, L., 2001a, ApJ, 555, 205
- Mazzotta et al. (2001b) Mazzotta, P., Markevitch, M., Forman, W. R., Jones, C., Vikhlinin, A., & VanSpeybroeck, L., 2001b, ApJ submitted (astro-ph/0108476)
- Mazzotta et al. (2003) Mazzotta, P., Edge, A. C., & Markevitch, M., 2003, ApJ, 596, 190
- McNamara et al. (2001) McNamara, B. R., et al. 2001, ApJ, 562, L149
- McNamara et al. (2005) McNamara, B. R., Nulsen, P. E. J., Wise, M. W., Rafferty, D. A., Carilli, C., Sarazin, C. L., & Blanton, E. L., 2005, Nature, 433, 45
- Narayan & Medvedev (2001) Narayan, R., & Medvedev, M. K., 2001, ApJ, 562, L129
- Navarro, Frenk & White (1997) Navarro, J. F., Frenk, C. S., & White, S. D. M., 1997, ApJ, 490, 493 (NFW)
- Nulsen et al. (2005a) Nulsen, P. E. J., Hambrick, D. C., McNamara, B. R., Rafferty, D. A., Bîrzan, L., Wise, M. W., & David, L. P., 2005a, ApJ, 625, L9
- Nulsen et al. (2005b) Nulsen, P. E. J., McNamara, B. R., Wise, M. W., & David, L. P., 2005b, ApJ, 636, 628
- Omma et al. (2004) Omma, H., Binney, J., Bryan, G., & Slyz, A., 2004, MNRAS, 348, 1105
- Omma & Binney (2004) Omma, H., & Binney, J., 2004, MNRAS, 350, L13
- Peterson et al. (2001) Peterson, J. R., et al. 2001, A&A, 365, L104
- Peterson et al. (2003) Peterson, J. R., Kahn, S. M., Paerels, F. B., Kaastra, J. S., Tamura, T., Bleeker, J. A. M., Ferrigno, C., & Jernigan, J. G., 2003, ApJ, 590, 207
- Quilis et al. (2001) Quilis, V., Bower, R. G., & Balogh, M. L., 2001, MNRAS, 328, 1091
- Reynolds et al. (2001) Reynolds, C. S., Heinz, S., & Begelman, M. C., 2001, ApJ, 549, L179
- Reynolds et al. (2002) Reynolds, C. S., Heinz, S., & Begelman, M. C., 2002, MNRAS, 332, 271
- Reynolds et al. (2005) Reynolds, C. S., McKernan B., Fabian, A. C., Stone, J. M. & Vernaleo, J. C., 2005, MNRAS, 357, 242
- Rizza et al. (2000) Rizza, E., Loken, C., Bliton, M., Roettiger, K., Burns, J. O., & Owen, F. N., 2000, AJ, 119, 21
- Robinson et al. (2004) Robinson, K., et al. 2004, ApJ, 601, 621
- Roychowdhury et al. (2004) Roychowdhury, S., Ruszkowski, M., Nath, B. B., & Begelman, M. C., 2004 , ApJ, 615, 681
- Ruszkowski & Begelman (2002) Ruszkowski, M., & Begelman, M. C., 2002, ApJ, 581, 223
- Ruszkowski et al. (2004a) Ruszkowski, M., Brüggen, M., & Begelman, M. C., 2004a, ApJ, 611, 158
- Ruszkowski et al. (2004b) Ruszkowski, M., Brüggen, M., & Begelman, M. C., 2004b, ApJ, 615, 675
- Sanderson et al. (2005) Sanderson, A. J. R., Finoguenov, A., & Mohr, J. J., 2005, ApJ, 630, 191
- Sarazin (1988) Sarazin, C. L., 1988, X-ray Emission from Clusters of Galaxies, (Cambridge: Cambridge Univ. Press)
- Saxton et al. (2001) Saxton, C. J., Sutherland, R. S., & Bicknell, G. V., 2001, ApJ, 563, 103
- Scheuer (1974) Scheuer, P. A. G., 1974, MNRAS, 166, 513
- Smith et al. (1983) Smith, M. D., Smarr, L., Norman, M. L., & Wilson, J. R., 1983, ApJ, 264, 432
- Smith et al. (2002) Smith, D. A., Wilson, A. S., Arnaud, K. A., Terashima, Y., & Young, A. J., 2002, ApJ, 565, 195
- Soker & Sarazin (1990) Soker, N., & Sarazin, C. L., 1990, ApJ, 348, 73
- Soker et al. (2002) Soker, N., Blanton, E. L., & Sarazin, C. L., 2002, ApJ, 573, 533
- Spergel et al. (2003) Spergel, D. N., et al. 2003, ApJS, 148, 175
- Sutherland & Dopita (1993) Sutherland, R. S., & Dopita, M. A., 1993, ApJS, 88, 253
- Tamura et al. (2001) Tamura, T., et al. 2001, A&A, 365, L87
- Turner (1973) Turner, J. S., 1973, Buoyancy Effects in Fluids (Cambridge: Cambridge Univ. Press)
- Vernaleo & Reynolds (2006) Vernaleo, J. C., & Reynolds, C. S., 2006, ApJ in press (astro-ph/0511501)
- Voigt & Fabian (2004) Voigt, L. M., & Fabian, A. C., 2004, MNRAS, 347, 1130
- Walters & Davidson (1963) Walters, J. K., & Davidson, J. F., 1963, J. Fluid Mech., 17, 321
- White & Sarazin (1987) White, D. A., & Sarazin, D. L., 1987, ApJ, 320, 32
- Zakamska & Narayan (2003) Zakamska, N. L., & Narayan, R., 2003, ApJ, 582, 162
- Zanni et al. (2003) Zanni, C., Bodo, G., Rossi, P., Massaglia, S., Durbala, A., & Ferrari, A., A&A, 402, 949
- Zanni et al. (2005) Zanni, C., Murante, G., Bodo, G., Massaglia, S., Rossi, P., & Ferrari, A., A&A, 429, 399