Lack of cooling flow clusters at
The goal of this work is to study the incidence rate of “cooling flows” in the high redshift clusters using Chandra observations of objects from a new large, X-ray selected catalog 2006astro.ph.10739B . We find that only a very small fraction of high- objects have cuspy X-ray brightness profiles, which is a characteristic feature of the cooling flow clusters at . The observed lack of cooling flows is most likely a consequence of a higher rate of major mergers at .
1 Introduction
The central regions in a large fraction of low-redshift clusters are clearly affected by radiative cooling 1994ara&a..32..277f . Some estimates put the fraction of such cooling flow clusters to (e.g., 1998MNRAS.298..416P ). A recent by Bauer et al. suggests that the cooling flow fraction remains high to 2005MNRAS.359.1481B . However, this work is based on the ROSAT All-Sky Survey cluster sample, and so it can be strongly affected by Malmquist bias (strongly over-luminous clusters are preferentially selected because of the high flux threshold).
Any evolution in the cooling flow fraction, if detected, must be taken into account in detailed physical models of this phenomenon. We address this important question using a new distant cluster sample, derived from a sensitive survey based on the ROSAT pointed observations 2006astro.ph.10739B . All objects were observed with Chandra, providing a uniform dataset which should be much less affected by selection effects than the previous samples.
2 Definition of the “cooling flow” cluster
First of all, we need to choose a definition of the “cooling flow” cluster that can be efficiently applied to the X-ray data of various statistical quality. The most common definition is based on the estimated central cooling time: cooling flow clusters have (e.g., 1998MNRAS.298..416P ). One could also use the mass deposition rate given by the standard cooling flow model 1994ara&a..32..277f ; cooling flow clusters have yr-1 1998MNRAS.298..416P . These definitions rely on spatially-resolved spectroscopic measurements which is a serious disadvantage for application at high redshifts. The data of sufficient quality to measure are available only for a small number of high- objects. We, therefore, look for a definition based solely on the X-imaging data.
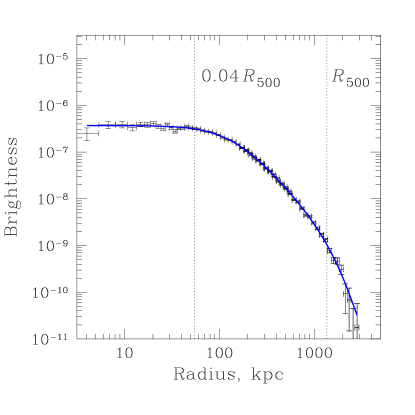
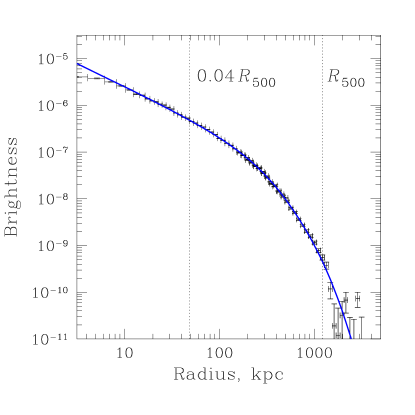
At low redshifts, there is a clear connection between the presence of the cooling flow and the X-ray morphology. Clusters with have X-ray brightness profiles with flat cores while those with have characteristic central cusps in the X-ray brightness distribution (Fig. 1). The central cusp can be characterized by the power-law index of the gas density profile, . For uniformity, the radius at which is measured should be chosen at a fixed fraction of the cluster virial radius. This radius should be sufficiently small so that the effects of cooling are strong. At very small radii, however, the density profiles even in clusters with strong cooling flows can flatten because of the outflows from the central AGN (see many papers in these proceedings). Empirically, a good choice is ,111 is the radius at which the mean enclosed total mass overdensity is 500 relative to the critical density at the object redshift. . and so we define the “cuspiness parameter”, , as
| (1) |
Cuspiness can be measured by fitting a realistic 3-dimensional gas density model to the observed X-ray surface brightness (our procedure is described in 2006ApJ…640..691V ). Examples of the best-fit models are shown by solid lines in Fig. 1. Such modeling is feasible with moderate-exposure Chandra observations of high-redshift clusters. can be estimated using low-scatter cluster mass proxies such as the average temperature (excluding the central cooling region). We use an even better proxy, the recently proposed parameter 2006ApJ…650..128K , which is remarkably insensitive to the cluster dynamical state and easily measured even in high-redshift clusters.
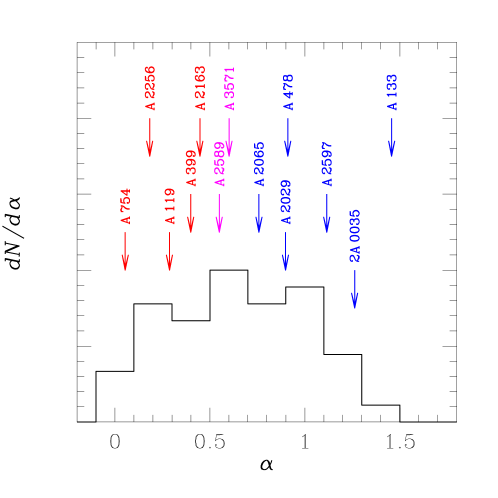
Our low-redshift cluster sample is a flux-limited subsample of 48 objects from the HIFLUGCS catalog 2002ApJ…567..716R , all with the archival Chandra observations. The distribution of the cuspiness parameter for these objects is shown in Fig. 2. Clearly, the value of is closely connected to the more common cooling flow definitions. Clusters with (e.g., A2065, A478, A2029, A2597, 2A 0035, A133) are known to host strong cooling flows. The objects with (e.g., A2163, A399, A119, A2256, A754) are famous non cooling flow clusters. The clusters in the range (e.g., A2589, A3571) host weak cooling flows. Therefore, the cooling flow clusters are those with . Approximately 2/3 of the low-redshift sample (31 of 48 objects) have cuspiness above this value, in line with the previous estimates of the cooling flow incidence rate (e.g. 1998MNRAS.298..416P ).
3 High-redshift cluster sample
Our high-redshift sample is derived from the recently completed 400 deg2 ROSAT PSPC survey (400d; 2006astro.ph.10739B ). This is the largest-area survey based on the ROSAT pointed observations. Clusters are detected as extended X-ray sources in the central of the PSPC FOV and required to have fluxes erg s-1 cm-2. The X-ray sample is fully identified. It includes 266 optically confirmed clusters (95% of the X-ray candidate list). Spectroscopic redshifts are available for all objects.
A subsample of the high- 400d clusters has been observed with Chandra. The exposure times were chosen to yield at least 2000 source counts, which is sufficient to measure the average cluster temperature with a uncertainty and accurately trace the surface brightness profile to . Chandra’s angular resolution corresponds to a linear scale of kpc out to , fully sufficient to measure the cuspiness parameter. In this work, we use 400d clusters at , 20 in total. The typical mass of these objects corresponds to today’s 4 keV clusters.

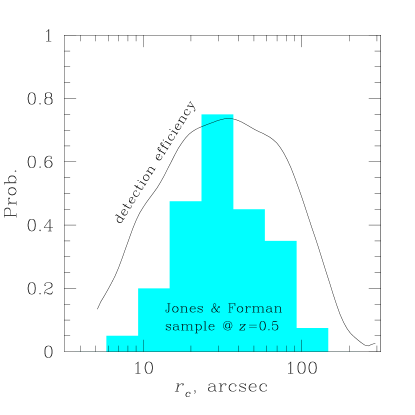
The basic characteristics of the X-ray selection in the 400d survey have been extensively calibrated through exhaustive Monte-Carlo simulations (see 2006astro.ph.10739B for details). The aspect most relevant for the present study is the sensitivity of the detection efficiency to the cluster size and structure. A precise two-dimensional map of the detection efficiency as a function of cluster size and core radius was derived for idealized -model clusters (Fig. 3a). The detection efficiency drops significantly only for and (see Fig. 3b which shows the slice through the detection probability map at erg s-1 cm-2, just above the survey flux limit). The angular size range in which the 400d X-ray detection is sensitive encompasses the entire range of core-radii expected for the high-redshift clusters (c.f. shaded histogram in Fig. 3b). Therefore, the 400d selection will not bias the distribution of core-radii for -model clusters.
The sensitivity of the 400d X-ray detection algorithm to cooling flow clusters with the cuspy X-ray brightness profiles requires a separate study. This issue was addressed by a separate set of Monte-Carlo simulations in which instead of -models, we used the real X-ray images of a complete sample of low- clusters, scaled to different redshifts in the range (see 2006astro.ph.10739B for details). A short summary of the results from these simulations is that there is no significant difference in the detection efficiency for the -model and cooling flow clusters (see, e.g., Fig. 16 in 2006astro.ph.10739B ). For example, Hydra-A () at 222Redshifts here are chosen so that the observed fluxes would correspond to that in Fig. 3b, erg s-1 cm-2. is detected with the probability 0.67; 2A 0335 () at has ; A2029 () at has . These values are near the maximum efficiency for -model clusters of similar flux (Fig. 3b). Therefore, there should be no discrimination in the 400d survey against the objects similar to today’s cooling flow clusters.
4 Observed morphologies and cuspiness parameters of the high-redshift clusters
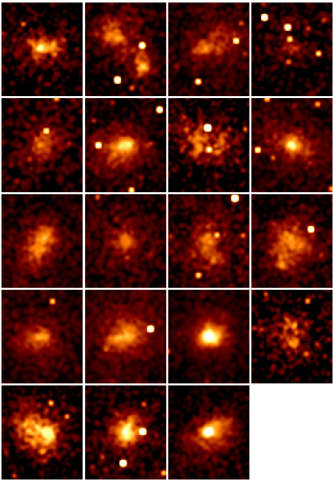
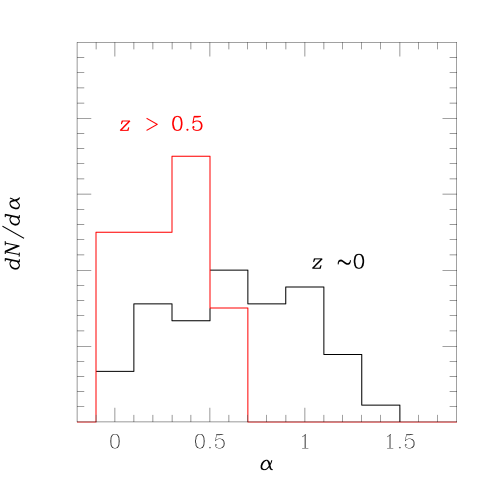
Chandra images of the objects from the 400d sample show a clear evolution of the cluster X-ray morphologies — at least 15 of 20 objects shows signs of an on-going major merger (Fig. 4a); the corresponding fraction in the low-redshift sample is . The same effect is apparent in the distribution of the cuspiness parameter shown in Fig. 4b. Only 3 of 20 high- clusters have (i.e., above the boundary between cooling flow and non cooling clusters, see § 2), while in the low- sample this fraction is 31 of 48 (65%). The are no clusters with (strong cooling flows) in the sample, while the fraction of such clusters at is 46% (22 of 48 objects). The statistical significance of the difference in the distribution corresponds to a random fluctuation probability of only .
Our results provide a tantalizing evidence for a strong evolution in the incidence rate of the cluster cooling flows at . This is apparently related to the higher cluster merging rate, indeed expected at these redshifts in the Dark Energy dominated, cold dark matter cosmological models (e.g., 2001ApJ…546..223G ). The cluster cooling flows thus appear to be a relatively recent phenomenon, which becomes common only in the past of the Hubble time.
References
- [1] R. A. Burenin, A. Vikhlinin, A. Hornstrup, H. Ebeling, H. Quintana, and A. Mescheryakov. ApJS, submitted (astro-ph/0610739), 2006.
- [2] A. C. Fabian. ARA&A, 32:277–318, 1994.
- [3] C. B. Peres, A. C. Fabian, A. C. Edge, S. W. Allen, R. M. Johnstone, and D. A. White. MNRAS, 298:416–432, 1998.
- [4] F. E. Bauer, A. C. Fabian, J. S. Sanders, S. W. Allen, and R. M. Johnstone. MNRAS, 359:1481–1490, 2005.
- [5] A. Vikhlinin, A. Kravtsov, W. Forman, C. Jones, M. Markevitch, S. S. Murray, and L. Van Speybroeck. ApJ, 640:691–709, 2006.
- [6] A. V. Kravtsov, A. Vikhlinin, and D. Nagai. ApJ, 650:128–136, 2006.
- [7] T. H. Reiprich and H. Böhringer. ApJ, 567:716–740, 2002.
- [8] C. Jones and W. Forman. ApJ, 511:65–83, 1999.
- [9] S. Gottlöber, A. Klypin, and A. V. Kravtsov. ApJ, 546:223–233, 2001.