Discovery of Two Galaxies Deeply Embedded in the Great Attractor Wall
Abstract
We report on the discovery of two spiral galaxies located behind the southern Milky Way, within the least explored region of the Great Attractor. They lie at (), where obscuration from Milky Way stars and dust exceeds 13 to 15 mag of visual extinction. The galaxies were the most prominent of a set identified using mid-infrared images of the low-latitude () Spitzer Legacy program GLIMPSE. Follow-up H i radio observations reveal that both galaxies have redshifts that place them squarely in the Norma Wall of galaxies, which appears to extend diagonally across the Galactic Plane from Norma in the south to Centaurus/Vela in the north. We report on the near-infrared, mid-infrared and radio properties of these newly discovered galaxies, and discuss their context in the larger view of the Great Attractor. The work presented here demonstrates that mid-infrared surveys open up a new window to study galaxies in the Zone of Avoidance.
Subject headings:
infrared: galaxies, radio lines: galaxies, superclusters; Great Attractor1. Introduction
Our emerging portrait of the universe is that of an intricate cosmic web of galaxies arrayed in long filaments, sheets and bubbles that intersect to form dense mass concentrations. The key outstanding problem is the distribution and nature of dark matter and dark energy that drives the dynamics of the expanding cosmos. The study of the local Universe, including its peculiar motions and its clustering at the largest size scales, is essential for structure formation in the early Universe and its relation to the formation and subsequent evolution of galaxies. Studying superclusters both near and far is paramount in decoding the mass density of the universe.
We now recognize that the core of one of the most important mass concentrations in the local universe is located behind the southern Milky Way (). The so-called Great Attractor (GA) is pulling on the Milky Way and the Local Group of galaxies, its gravitational influence stretching beyond Virgo and the Local Supercluster of galaxies (Lynden-Bell et al. 1988; Burstein et al. 1990; Kocevski & Ebeling 2006; Erdogdu et al. 2006a,b). The search for the elusive GA covers a very large expanse of sky that is within the Zone of Avoidance (ZoA), where traditional surveys are limited by the foreground Milky Way. It has been attributed to or associated with visible galaxy overdensities in Hydra, Centaurus, Pavo and Indus (e.g. Lahav 1987; Lynden-Bell, Lahav, & Burstein 1989), and most recently with dedicated surveys of the ZoA, in Norma and Vela (e.g., see Kraan-Korteweg & Lahav 2000, Kraan-Korteweg 2005, for reviews).
To date, the most prominent density peak to be discovered in the southern ZoA is the Norma cluster (Abell 3627; Abell, Corwin & Olowin 1989), whose cumulative mass and richness is comparable to the Coma cluster (Kraan-Korteweg et al. 1996; Woudt, Kraan-Korteweg & Fairall 1999). It is located below the southern Galactic equator (325°, °, 4900 km s-1), the limit where optical and near-infrared surveys become heavily incomplete. To the north, emerging on the other side of the darkest region of ZoA are the Cen-Crux and CIZAJ1324.7–5736 clusters, both at similar recessional velocities as Norma (Radburn-Smith et al. 2006). For a velocity range between 4000 and 6000 km s-1, a continuous line of galaxies appear to extend northward from Pavo-Indus up through Norma, bending to lower longitudes and joining with Cen-Crux/CIZAJ1324.7–5736 in the northern Galactic hemisphere (see Fig. 1 in Jarrett 2004 for a 3D view of these large scale structures). This large filamentary structure, named the ”Norma Wall”, runs diagonally behind the southern Milky Way (Kraan-Korteweg et al. 1994; Kraan-Korteweg 2005), severely hampering the construction of sufficiently detailed large-scale flow maps that are needed to identify the full extent, shape and mass of the GA. Despite dedicated multi-wavelength efforts in mapping the GA in the last decade (Kraan-Korteweg 2005), a complete census of the density and total mass is still unrealized.
From above the Earth’s blocking atmosphere, the mid-infrared (MIR) opens a new and promising window for detecting ZoA galaxies. The MIR can penetrate the thick layer of Galactic gas and dust, whilst being sensitive to both stellar photospheric emission of early-type galaxies and interstellar emission from star-forming late-type disk galaxies. The Spitzer Legacy project “Galactic Legacy Infrared Mid-Plane Survey Extraordinaire” (GLIMPSE; Benjamin et al. 2003), surveyed a large fraction of the Milky Way (within °) using the IRAC camera (), passing across the most opaque part of the GA. GLIMPSE provides a readily available data set to test the viability of probing the ZoA with MIR imaging.
Inspection of the GLIMPSE MIR images revealed a number of galaxy candidates peaking through the formidable foreground of Galactic dust, gas and stellar confusion. Intriguingly, a concentration of galaxy candidates appear to be projected against the Norma Wall exactly where the wall supposedly bends from the southern hemisphere to the northern hemisphere. To confirm their extragalactic nature, we have followed-up two of the most promising galaxy candidates using deep near-infrared (NIR) imaging (Sect. 2.2) and radio observations (Sect. 2.3). Both were found to have radial velocities that are consistent with membership in the Norma Wall (Sect. 3.2), thus providing compelling evidence that an extragalactic bridge exists between the southern and northern halves of the Plane. In Section 3 we report on the properties of these ZoA galaxies and in Section 4 discuss their context in the larger view of the GA.
2. Observations & Data Reductions
2.1. Spitzer Mid-Infrared Observations
Active study of the Galactic Plane is now underway with the Spitzer Space Telescope. The heart of the GA has been partially mapped by GLIMPSE using the Spitzer Infrared Array Camera (IRAC), covering the window between . The relatively shallow GLIMPSE images are comprised of two epochs of two second exposures, typically achieving a surface brightness sensitivity of 2.7, 2.2, 6.3 and 5.6 mJy sr-1 for IRAC 3.6, 4.5, 5.8 and 8.0 , respectively. The Spitzer/GLIMPSE data reduction pipeline creates astrometric and photometric absolute-calibrated images that are combined into a single mosaic per band. The composite point source FWHM is 2.5″.
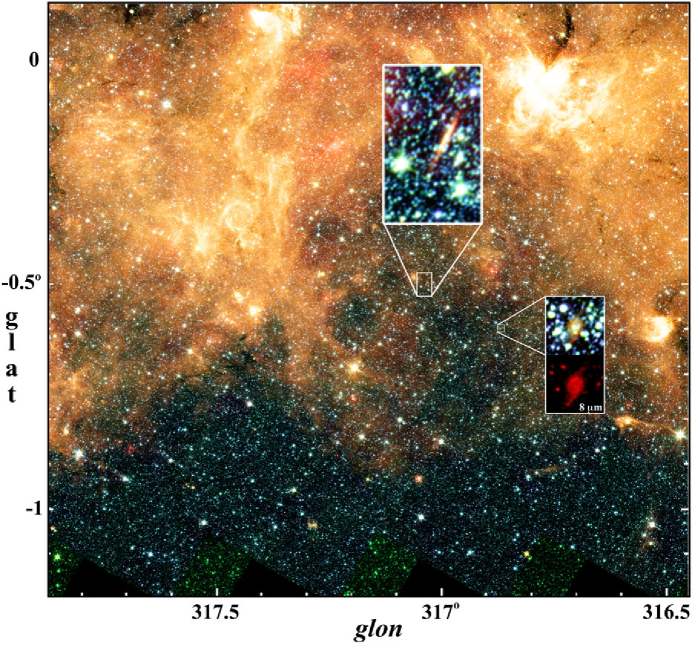
At longer wavelengths, the MIPSGAL survey (Carey et al. 2006) covered the same GLIMPSE footprint of the Milky Way using the Spitzer Multiband Imaging Photometer for Spitzer (MIPS). The diffraction limit at is approximately 6 arcsec, roughly a factor of two larger than the IRAC imaging, adequate for measuring the dust-emitting continuum from the GLIMPSE galaxies. A combined IRAC + MIPS panorama of the GA is shown in Fig. 1, simultaneously illustrating the incredible beauty of the Milky Way and the major challenge we are faced as we look behind the Galactic veil.
Visually scanning the set of GLIMPSE images that crossed the GA, we identified a number of resolved sources to be promising extragalactic candidates for follow-up study. The two most prominent ones (see Fig. 1) lie at (J2000) = , ( = 317.04°, -0.50°) and ( = 316.87°, -0.60°), and are referred to as G 1 and G 2, respectively. These sources were found in relatively low and background regions compared to the very bright H ii emission encircling the bubble-like clearing. The stellar confusion noise and the visual extinction, however, were extremely high, rendering both galaxies near the detection limit of GLIMPSE.
Photometry was extracted from the four IRAC bands and the MIPS image using a set of nested elliptical apertures centered on each galaxy, where the images were first cleaned of contaminating, foreground stars. The background was determined using an annulus that was well outside of the galaxy light, but still local to the galaxy environment and considerably smaller than the scale of the background ISM gradients. For the IRAC measurements, the flux density of each source was aperture corrected using the ”extended source” prescription recommended by the Spitzer Science Center 111http://ssc.spitzer.caltech.edu/irac/calib/ExtSrcCal/. The expected uncertainty in the IRAC photometry (measurement errors plus calibration) is 10%. For the MIPS measurements, the appropriate aperture correction was determined to be 1.1 (see Figure 3.2 of the MIPS data handbook), while another factor of 1.04 was applied to the integrated fluxes to account for the color correction between normal galaxies and the MIPS absolute calibration standard (see Table 3.12 in the MIPS data handbook). The expected uncertainty in the MIPS photometry is 10-15%.
2.2. IRSF Near-Infrared Observations
Near-infrared images of the region were obtained with the sirius camera on the 1.4m Infrared Survey Telescope (IRSF; Nagata & Glass 2000, Nagayama et al. 2003) in South Africa during April 4/5, 2006. The exposures were relatively long, reaching the stellar confusion limit at for much of the region studied. The images were reduced by subtracting median ”sky” images, then combined with astrometric and photometric calibration using 2MASS stars in the field. The resulting mosaics, with 0.9″ FWHM profiles, were deep enough to detect the two GLIMPSE galaxies in all three NIR bands (see Fig. 1 inserts for combined NIR and MIR images). Photometry was extracted using the same set of elliptical apertures and methodology devised for the MIR images. The largest aperture corresponded to an isophotal surface brightness of 20.6 mag/arcsec2.
2.3. ATCA H i Observations
H i synthesis observations were obtained with the Australia Telescope Compact Array (ATCA) in the EW352 configuration on April 19/20, 2006. The pointing position was (J2000) = ( = 317.05°, –0.48°). Since the galaxy redshifts were unknown but a connection with the GA anticipated, we observed with the large bandwidth of 16 MHz centered on 1397 MHz, leading to a velocity coverage ranging from 3500 km s-1 to 6000 km s-1. With 512 channels, the channel width resulted in 6.7 km s-1. The field of view (primary beam FWHM) at 1397 MHz is 34.1′. The total observing time was 12 hours. We observed PKS 0823–500 and PKS 1934–638 for bandpass and flux calibration. The phase calibrator PKS 1338–58 was observed for 3 minutes every 40 minutes.
Data reduction was carried out with the miriad software package using standard procedures. After identifying the velocity range of the H i signal we used the line-free channels to fit and subtract the radio continuum emission. Because of a strong confusing radio source, H ii region PMN J1445–5949, 30′ from the pointing center (Fig. 1, upper right), we used a 3rd order polynomial fit in uvlin to subtract the continuum emission. After Fourier-transformation of the H i channel maps using ‘natural’ weighting, the images were cleaned and restored with a synthesized beam of . The measured r.m.s. noise per 20 km s-1 wide channel is 2 mJy beam-1.
3. Results
3.1. Infrared Emission and Foreground Extinction
The dust-obscured GLIMPSE galaxies are only visible at wavelengths longward of , significantly reddened due to selective extinction. We estimate the Galactic extinction using three independent techniques: dust column density, stellar colors and galaxy colors. (In the next section, 3.2, we estimate the foreground extinction using the radio and photometric properties combined with the Tully-Fisher relation.) The goal is to arrive at a consistent value of the extinction that arises from the edge-on disk of the Milky Way. An accurate extinction correction will enable full characterization of the ZoA galaxies.
Far-infrared emission, as measured by the IRAS and COBE space telescopes, can be used as an effective proxy of the dust column density of the Milky Way. The average dust extinction as inferred from the IRAS/DIRBE far-infrared maps (Schlegel et al. 1998) is and 17.7 mag, for G 1 and G 2 respectively. The accuracy of these estimates is limited by the angular resolution and absolute calibration of the telescopes and detectors, as well as confusion from Milky Way stars that are not associated with the interstellar dust column. Moreover, studies suggest that the FIR-inferred extinctions tend to be overestimated when the dust column density is large (e.g., molecular clouds; see, e.g., Arce & Goodman, 1999; Nagayama et al. 2004; Schröder et al. 2006).
Shifting to the stellar population of the Galactic Plane, field stars can be exploited at shorter wavelengths to infer the extinction by analyzing the red giant branch of the stellar color-magnitude diagram (CMD). Accordingly, 2MASS near-infrared photometry of stars in the direction of the GA is used to construct the CMD; recent examples using this method include Ferraro et al. (2006), Nishiyama et al. (2006), Rocha-Pinto et al. (2006), López-Corredoira et al. (2005), and Salaris & Girardi (2005). The 2MASS JHKs CMD towards (l=317°, b=-0.6°, radius=0.3°) clearly separates into a distinct dwarf and red clump sequence as well as a strong bright red tail of reddened giants. The red clump extends to a distance of 5.50.5 kpc and =81 mag using red clump intrinsic properties K=-1.5 mag and J-K=1.3 mag (Bonatto et al. 2004, Salaris & Girardi 2002; and using =8.8, Draine 2003). This likely corresponds to the Scutum-Crux arm at about that distance and direction; however, the red clump is unlikely to be able to trace the full extent of the disk at 2MASS resolution and sensitivity. The bright giants are the only population that can reliably show the full extent of the Galactic disk at 2MASS sensitivity and resolution. Assuming constant NIR color for that population reveals a red giant branch extending to a dereddened K magnitude of 11.75 mag, and a maximum (95th percentile) extinction =141 mag. So between the FIR emission and the colors of field giants, the foreground extinction is estimated to be 14 - 17 mag in .
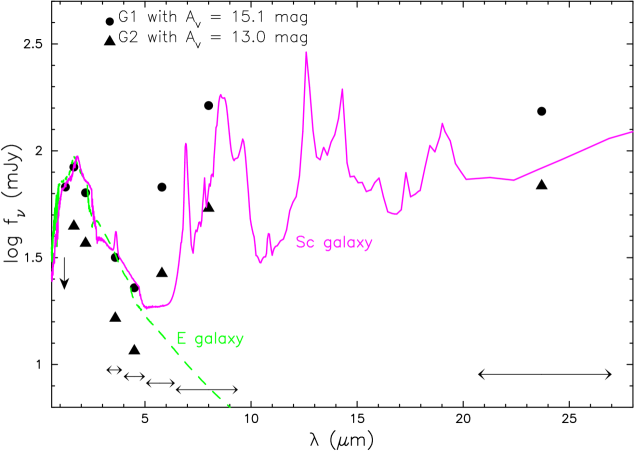
Finally, the galaxy colors themselves can be used to estimate the foreground extinction. For galaxies in the local universe, the NIR window is sensitive to the old stellar population, regardless of Hubble type, whose photospheric light dominates the spectral energy distribution (SED) between 1 and . Consequently, the NIR colors of all types of galaxies are nearly identical (e.g., Jarrett 2000). Comparing the observed NIR colors with the expected colors yields an estimate of the color reddening and hence, line-of-sight extinction. Accordingly, we have constructed the galaxy SEDs from the NIR and MIR measurements, which are directly compared with the expected light distribution of an old galaxy (t = 13 Gyrs) constructed from the GRASIL population synthesis (Silva et al. 1998). The model galaxy is weighted heavily to fit the peak in the SED light between , with lower weighting applied to the window between (where the presence of hot dust continuum and star formation line emission are beginning to become important). Extinction is a free parameter in the fit. The resultant best fit SED corresponds to a total visual extinction (with =8.8) of 15.1 and 13.0 0.2 mag for the respective galaxies. We can estimate the internal extinction contribution using the measured axis ratio and the prescription from Masters, Giovanelli & Haynes (2003): , where b/a is the disk axis ratio. The axis ratios as measured with the deep NIR images (Table 1) suggest an internal visual extinction of mag for G 1, and 0.6 mag for G 2 at visual wavelengths. Hence, the total foreground extinction follows: 13.7 and 12.4 0.2 mag for the respective galaxies. These SED-derived results are in good agreement with the CMD-derived values, and are within of the IRAS/DIRBE values. As noted above, the IRAS/DIRBE values have a larger uncertainty, and potential systematic, in the Galactic Plane. Next, in Section 3.2, we show that the inferred extinction based on the Tully-Fisher luminosity is consistent with the CMD and SED-derived estimates.
Using the SED-derived extinction for each galaxy, G 1 and G 2, corrected infrared photometry is summarized in Table 1, including the aperture parameters used to extract the photometry. Extinction corrections were carried out for the NIR and MIR photometry, except for the 24 results whose photometric measurement uncertainties were larger than the actual extinction correction appropriate to this long wavelength. Formal uncertainties in the measured fluxes ranged between 2–6% in the NIR, and 10–15% for the IRAC and MIPS measurements. The MIR uncertainty is dominated by the absolute calibration and the foreground stellar contamination, both arise from the significant scattering of stellar light across the IRAC focal planes. Due to the heavy foreground contamination from faint stars that we were unable to identify and remove, systematic over-estimation of integrated fluxes cannot be discounted at the 5% level. Fig. 2 shows the extinction-corrected SED for both galaxies. For clarity, we only show the GRASIL model template fit to G 1, but note that G 2 also has a shape that fits the ”old galaxy” template in the NIR portion of the SED. For comparison we also show the MIR model spectrum of a dusty Sc-type galaxy. In the MIR, the galaxy emission significantly deviates from the Rayleigh-Jeans tail due to the presence of strong PAH emission at 6.2 and 7.7 , boosting the IRAC 5.8 and 8.0 bands. The strong PAH lines are consistent with active or ongoing star formation. Thermal dust continuum is also very strong in these galaxies as traced by the 24 light, consistent with a large reservoir of gas to fuel star formation (see below). The combined NIR+MIR images reveal G 1 to be an edge-on disk galaxy with a weak nucleus/bulge, akin to Sc/Sd types, while G 2 has a more face-on spiral orientation with the hint of a large-scale bar structure, possibly of SBbc-type.
3.2. Atomic Hydrogen
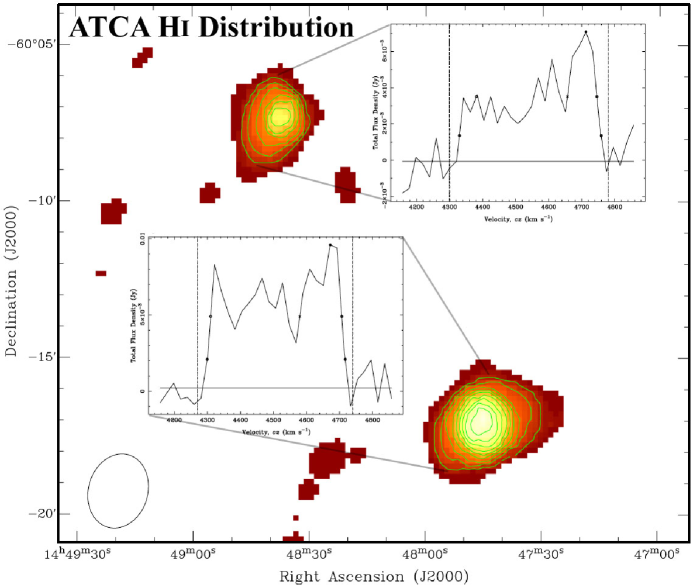
A close-up view of the ATCA H i distribution map that is centered on the GLIMPSE galaxies is presented in Fig. 3. Both galaxies are clearly detected in H i. After primary-beam correction we measure H i flux densities of = 1.1 Jy km s-1 and 5.6 Jy km s-1 for G 1 and G 2, respectively. Both galaxies have systemic velocities around 4500 km s-1 (see insets in Fig. 3) which in the Local Group frame corresponds to km s-1, giving a distance of 61 Mpc (H0= 72 km s-1Mpc-1) or a distance modulus of 33.93 mag. At this distance the H i flux densities correspond to H i masses of M⊙ and M⊙, i.e. typical values for star-forming spiral galaxies. The H i properties are listed in Table 2.
The mean H i velocity fields of both galaxies (not shown) indicate systematic gradients, consistent with regularly rotating disks. Due to the low angular resolution, the position angle () of the disks are difficult to determine. For the galaxy G 1 (top) we measure 140°. Its large velocity width, = 429 km s-1, is consistent with the edge-on orientation seen in the infrared images (Fig. 1). Interestingly, the H i profile is quite lopsided with the red-shifted horn being considerably stronger. This is also reflected in the H i distribution which shows an extension of red-shifted velocity gas towards the south-east. A higher resolution H i peak flux distribution (not shown) also shows the flux maximum shifted towards the south-east of the galaxy. Overall, the H i distribution of G 1 appears slightly less extended than that of G 2. The of the G 2 disk is approximately –70°, compared to –40° as viewed in the infrared. The large velocity width, = 418 km s-1, is surprising given its rather face-on morphology on the infrared images, thus implying that the inclination-corrected linewidth is very large indeed. Finally, like G 1, the H i spectrum of G 2 appears to be asymetric. In the higher resolution H i peak flux distribution, the H i maximum towards the southeastern part of the galaxy (blue-shifted velocities) is much stronger than that seen in the northwest (red-shifted velocities).
With its favorable disk orientation, well determined rotation velocity and near-infrared flux, the absolute magnitude of galaxy G 1 can be estimated using the near-infrared Tully-Fisher (TF) relation. We employ the K-band TF relation constructed by Macri (2001), which correlates with the inclination corrected H i linewidth at the level, calibrated with K-band isophotal integrated fluxes determined at the 21 mag/arcsec2 level:
The observed linewidth is 429 km s-1. The K-band axis ratio of G 1 is 0.25, corresponding to a inclination angle of 81 degrees, assuming an intrinsic axis ratio of 0.2; hence, correction to the linewidth is very small, . Using a corrected linewidth = 434 km s-1, the inferred absolute magnitude using the above TF relation is -23.9 mag, a luminosity that is brighter than for the field disk galaxy population (Kochanek et al. 2001). We note that deriving using other near-infrared TF relations (e.g., Conselice et al. 2005) gives results that are in agreement to better than . The redshift-based distance modulus is 33.9 mag (see above), which implies that the apparent K-band magnitude for G 1 should be about 10.0 mag. The 1.7 mag gap between this inferred apparent magnitude and the actual apparent magnitude, 11.72 mag (see section 3.1), represents the total extinction of Milky Way foreground plus G 1 internal. The resulting total extinction, Av = 15.1 mag, is remarkably close to the extinction deduced from FIR dust emission, colors of field giant stars and of G 1 itself (see section 3.1). The clear implication is that G 1 follows the TF relation that describes disk galaxies whose primary baryonic mass and H i components are intrinsic in origin.
Following the same exercise with G 2 is more problematic due to the relatively face-on disk inclination. The axis ratio implies an inclination that is 60 degree, or a correction that is , leading to an inclination-corrected linewidth of 483 km s-1, and a TF luminosity of -24.4 mag. The inferred apparent K-band brightness is 9.6 mag, which in comparison to the actual K-band integrated brightness, 12.10 mag, implies a total extinction of greater 20 mag at visual wavelengths. This value is much larger than what is inferred using the the FIR, CMD or G 2 SED, which suggests that G 2 does not follow the TF relation, having a disk rotation that is much greater than what is consistent with its K-band flux.
Taken as a whole, the large velocity width of G 2 and the lopsided H i distribution of both G 1 and G 2 (Fig. 3) may be hinting at a tidal distorsion or a large-scale pressurized environment that is radially driving the H i gas from symmetry. Although the Spitzer IRSF and ATCA observations do not directly reveal any massive galaxies in the vicinity, we cannot discount the presence of H i-poor or old-star dominated galaxies along this line-of-sight due to stellar confusion and the powerful nebular emission arising from the Milky Way (see e.g., the northern portion of Fig. 1). In any event, the intriguing H i line profiles merit further investigation.
4. Discussion & Summary
To summarize, we have detected several new galaxy candidates in the GA region using Spitzer MIR imaging from the GLIMPSE and MIPSGAL projects. Two of these sources were followed-up with deep NIR imaging and H i line data: (1) both are relatively luminous star-forming galaxies rich with gas and dust, and (2) based on their H i radial velocities, 4500 km s-1, are located within the nominal confines of the Great Attractor. Previous Xray, optical/NIR and radio surveys of the GA did not detect these ZoA galaxies, and there is reason to believe that many more galaxies await discovery.
The region is extremely confused with gas, dust and stars, limiting the short-wavelength surveys, while Galactic hydrogen emission hampers traditional single-dish blind surveys of nearby galaxies (500 km s-1) and the increase in Galactic radio continuum sources at lowest Galactic latitudes raises the noise level and reduces the effectiveness of 21-cm surveys. Galactic synchrotron blinds searches for extragalactic radio continuum sources, and Xray surveys are ineffective when the HI column density exceeds 30-50 cm-2(Ebeling et al. 2002). Even with the Spitzer MIR imaging, we have found only a handful of galaxies peering through the formidable stellar/dust mask, although our follow-up multi-dish radio observations have proven to be very effective at penetrating the Plane. Based on the TF-derived luminosities, both GLIMPSE galaxies are brighter than typical field disk galaxies, so they may represent the upper tip of the luminosity function for field galaxies. Both have strong IR emission from star formation that does facilitate discrimination from the foreground stars using the NIR-to-MIR colors. The inferred foreground extinction, 13-15 mag, pushes the photometry near the detection limit for disk galaxies located at the distance of the Norma cluster; consequently, most of the region studied is probably too opaque or confused with bright nebular emission to detect most background galaxies using the relatively shallow GLIMPSE data or the larger beam MIPSGAL data. Deeper Spitzer imaging complemented with multi-dish radio H i observations are what is needed to uncover fainter galaxies or sources that are cloaked by foreground stars and dust.
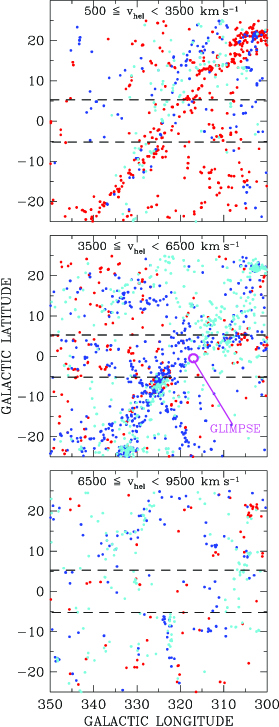
Are the GLIMPSE galaxies tracing a larger concentration of galaxies that bridge the southern and northern hemispheres? Fig. 4 depicts the emerging view of the GA and surrounding region, showing redshift-binned galaxy detections from X-ray, optical, near-infrared and radio surveys. The GLIMPSE galaxies appear in the middle panel. At low redshifts, km s-1(top panel), the less-massive Centaurus Wall appears to extend from the southern to the northern hemispheres at a slight angle with respect to the supergalactic plane. Whereas, at higher redshifts, km s-1, the combined filaments of the Pavo-Indus supercluster (332°, °, 4200 km s-1) and the Norma cluster (325°, °, 4900 km s-1) in the south appear to pass through the GLIMPSE galaxies (317°, °, 4500 km s-1), bending to lower longitudes and higher velocities, joining up with the Cen-Crux cluster (306°, °, 5700–6200 km s-1) and CIZA J1324.7-5736 (307.4°°, 5700 km s-1) to the north.
The emerging portrait seems to be a continuous ”great wall” that stretches from Pavo-Indus in the south (), through Norma and upwards (behind the Plane) toward Centaurus, finally bending over to Vela in the north (), thus extending over 50° to 60° on the sky. This astonishingly large structure is analogous to the Virgo-Coma ”great wall” of galaxies discovered by the pioneering CfA redshift survey of the northern hemisphere (Geller & Huchra 1989). Such an extended mass concentration would surely perturb the Hubble flow of galaxies in the local universe ( km s-1), deserving its ”great” attractor status as surmised from large-scale flow studies of the last two decades (e.g., Kolatt, Dekel & Lahav 1995). And indeed, recent all-sky coverage studies of the galaxy density field using x-ray selected (Kocevski & Ebeling 2006) and near-infrared selected (Erdogdu et al 2006a,b) galaxy samples clearly show the importance of the GA to the local velocity field. The GA is not the only attractor in the local universe, for example the Perseus-Pisces Supercluster is another important contributer to flow field, but it is the primary component within 8,000 km s-1. At higher velocities, the Shapley Concentration at 14,000 km s-1is undoubtedly the most important structure in the local universe (Hudson et al. 2004; Kocevski & Ebeling 2006), although redshift and peculiar velocity studies are highly incomplete at these large distances. The density field studies implicate the GA as the primary perturbing force to the Local Group and the larger Local Supercluster, yet the detailed morphology of the GA remains to be understood. Combined mid-infrared and radio surveys of the ZoA hold great promise in disentangling this cosmic web and delineating the Norma Wall from the foreground Milky Way.
Future work will include similarly targeted observations of new GLIMPSE and MIPSGAL galaxy candidates. Underway is a large area, deep NIR survey with the IRSF, concentrating on the regions of the GA that have 10 mag, complemented by more sensitive interferometric radio H i surveys that are optimized to finding galaxies in the velocity range of the Norma Wall. Finally, we will propose deeper Spitzer MIR imaging to probe the darkest regions of the ZoA.
References
- (1) Abell, G. O., Corwin, H. G. Jr., & Olowin, R. P. 1989, ApJS, 70, 1
- (2) Arce, H. G. & Goodman, A.A. 1999, ApJ, 512, L135.
- Benjamin et al. (2003) Benjamin, R., et al. 2003, PASP, 115, 953
- Bonatto et al. (2004) Bonatto, C., Bica, E., & Girardi, L. 2004, A&A, 415, 571
- Conselice et al. (2005) Conselice, C.J., Bundy, K., Ellis, R.S., Brichmann, J., Vogt, N, & Phillips, A. 2005, ApJ, 628, 160
- Burstein et al. (1990) Burstein, D., Faber, S., & Dressler, A. 1990, ApJ, 354, 18
- Carey (2006) Carey, S. et al 2006, in preparation.
- Draine (2004) Draine, B.T. 2003, ARA&A, 41, 241
- Ebeling et al. (2002) Ebeling, H., Mullis, C., Tully, R.B. 2002, ApJ, 580, 774
- Erdogdu et al. (2006a) Erdogdu, P., Huchra, J., Lahav, O., et al. 2006a, MNRAS, 368, 151
- Erdogdu et al. (2006b) Erdogdu, P., Lahav, O., Huchra, J., Colless, M., & Jarrett, T.H. 2006b, MNRAS, in press.
- Ferraro et al. (2006) Ferraro, F.R., Valenti, E., & Origlia, L. 2006 (astro-ph/0605492)
- Geller & Huchra (1989) Geller, M. & Huchra, J. 1989, Science, 246, 897
- Hudson et al. (2004) Hudson, M.J., Smith, R., Lucey, J., & Branchini, E. 2004, MNRAS, 352, 6
- Jarrett (2000) Jarrett, T.H. 2000, PASP, 112, 1008
- Jarrett (2004) Jarrett, T.H. 2004, PASA, 21, 396
- Kocevski & Ebeling (2006) Kocevski, D.D. & Ebeling, H. 2006, ApJ, in press; (astro-ph/0510106)
- Kochanek et al (2001) Kochanek, C. S., Pahre, M. A., Falco, E. E., Huchra, J. P., Mader, J., Jarrett, T. H., Chester, T., Cutri, R., Schneider, S.E., ApJ, 560, 566
- Kolatt, Dekel & Lahav (1995) Kolatt, T., Dekel, A., & Lahav, O. 1995, MNRAS, 275, 797
- (20) Kraan-Korteweg, R.C. 2005, RvMA, 18, 48 (astro-ph/0502217)
- (21) Kraan-Korteweg, R.C., & Lahav, O. 2000, A&ARv, 10, 211
- (22) Kraan-Korteweg, R.C., Cayatte, V., Balkowski, C., Fairall, A.P., & Henning, P.A., 1994, ASP Conf. Ser. 67, 99
- Kraan-Korteweg et al. (1996) Kraan-Korteweg, R.C., Woudt, P.A., Cayatte, V., Fairall, A.P., Balkowski, C., & Henning, P.A. 1996, Nature, 379, 519
- (24) Lahav, O. 1987, MNRAS, 225, 213
- López-Corredoira et al. (2005) López-Corredoira, M., Cabrera-Lavers, A., & Gerhard, O. E. 2005, A&A, 439, 107
- Lynden-Bell et al. (1988) Lynden-Bell, D., Faber, S.M., Burstein, D., Davies, R.L., Dressler, A., Terlevich, R., & Wegner, G. 1988, ApJ, 326, 19
- (27) Lynden-Bell, D., Lahav, O., & Burstein, D. 1989, MNRAS, 241, 325
- Macri (2001) Macri, L.M. 2001, PhD thesis, Harvard University.
- (29) Masters, K.L., Giovanelli, R. & Haynes, M.P. 2003, AJ, 126, 158.
- Nagata & Glass (2000) Nagata, T., & Glass, I.S. 2000, MNASSA, 59, 110
- (31) Nagayama, T., Nagashima, C., Nakajima, Y., et al. 2003, Proc.SPIE, 4841, 459
- (32) Nagayama, T., Woudt, P.A., Nagashima, C., et al. 2004, MNRAS, 354, 980
- Nishiyama et al. (2006) Nishiyama, S., et al. 2006, ApJ, 647, 1093
- (34) Radburn, D.J., Lucey, J.R., Woudt, P.A., Kraan-Korteweg, R.C., & Watson, F.G. 2006, MNRAS, 369, 117.
- Rocha-Pinto et al. (2006) Rocha-Pinto, H. J., Majewski, S. R., Skrutskie, M. F., Patterson, R. J., Nakanishi, H., Muñoz, R. R., & Sofue, Y. 2006, ApJ, 640, L147
- Salaris & Girardi (2002) Salaris, M., & Girardi, L. 2002, MNRAS, 337, 332
- Salaris & Girardi (2005) Salaris, M., & Girardi, L. 2005, MNRAS, 357, 669
- Schlegel et al. (1998) Schlegel D.J., Finkbeiner D.P., & Davis M. 1998, ApJ, 500, 525
- Silva et al. (1998) Silva, L., Granato, G., Bressan, A., & Danese, L. 1998, ApJ, 509, 103
- (40) Schröder, A., Mamon, G.A., Kraan-Korteweg, R.C., & Woudt, P.A. 2006, A&A, submitted (astro-ph/0607108)
- Woudt & Kraan-Korteweg (2001) Woudt, P.A., & Kraan-Korteweg, R.C. 2001, A&A, 380, 441
- (42) Woudt P.A., Kraan-Korteweg, R.C., & Fairall, A.P. 1999, A&A, 352, 39
| GLIMPSE G 1: 317.04°° | GLIMPSE G 2: 316.87°° | |||||
|---|---|---|---|---|---|---|
| ″, , °, = 15.1 mag | ″, , °, = 13.0 mag | |||||
| integrated flux | flux density | Lν | integrated flux | flux density | Lν | |
| mag | mJy | L⊙ | mag | mJy | L⊙ | |
| 1.25 | 10.800.05 | 76.30.1 | 20.4 | 0.02 | ||
| 1.64 | 10.080.03 | 94.70.3 | 19.8 | 10.670.04 | 55.40.3 | 11.6 |
| 2.15 | 9.910.02 | 72.10.7 | 11.2 | 10.540.02 | 40.50.5 | 6.29 |
| 3.6 | 9.76 | 35.0 | 3.25 | 10.47 | 18.3 | 1.70 |
| 4.5 | 9.68 | 24.1 | 1.79 | 10.38 | 12.7 | 0.94 |
| 5.8 | 8.01 | 71.8 | 4.13 | 8.99 | 29.1 | 1.68 |
| 8.0 | 6.41 | 175.7 | 7.33 | 7.66 | 55.6 | 2.32 |
| 23.7 | 4.20 | 153.2 | 2.13 | 5.07 | 68.5 | 0.95 |
Note. — Except for 24 , all magnitudes and flux densities have been corrected for Milky Way dust extinction and internal extinction. The errors account for the photometry only, not to the applied foreground extinction corrections. IRAC and MIPS measurements have been aperture corrected using the extended source prescription given by the Spitzer Science Center; typical uncertainties are 10%. The redshift-derived distance for both galaxies is 61 Mpc.
| Galaxy Name | H i max position | MK(TF) | |||||
|---|---|---|---|---|---|---|---|
| (J2000) | km s-1 | km s-1 | km s-1 | Jy km s-1 | M⊙ | mag | |
| GLIMPSE G 1 | 4563 | 365 | 429 | 1.1 | 1 | -23.9 | |
| GLIMPSE G 2 | 4508 | 397 | 418 | 5.6 | 5 | -24.4 |