Rapid and correlated variability of blazar S5 0716+71 from radio- to sub-mm bands
Abstract:
The BL Lac object S5 0716+71 was target of a coordinated and global multi-frequency campaign to search for rapid and correlated variability and signatures of the inverse-Compton catastrophe. Here we present first results obtained from a combined analysis of the cm- to sub-mm observations over a period of seven days aiming at a detailed study of the intra- to inter-day variability characteristics and to obtain constraints on the variability brightness temperatures and Doppler factors comparing the radio data with the high energy emission recorded by INTEGRAL. A more detailed description of the whole cm- to sub-mm observations and our analysis/results will be presented in a forthcoming paper. Our analysis reveals the source to be in a particular short-term variability phase when compared to the past with a correlated 4 day time scale amplitude increase of up to 35%, which is systematically more pronounced towards higher frequencies. The obtained frequency dependent variability amplitudes and time lags contradict expectations from interstellar scintillation and strongly suggest a source intrinsic origin of this inter-day variability. A 7-day spectral evolution study indicate time-variable synchrotron self-absorption and expansion of the emission region, consistent with standard models. Assuming relativistic boosting, our different estimates of the Doppler factor yield robust lower limits of ¿ 5-22 using the inverse-Compton limit and ¿ 8-33 using the equipartition argument. Although high, these values are in good agreement with Doppler factors obtained from recent VLBI studies and from the inverse-Compton Doppler factors ¿ 14-16 derived with the X-ray emission seen by INTEGRAL at 3-200 keV.
1 Introduction
Blazars showing the ‘classical’ IntraDay Variability (IDV) of type II in the radio regime ([17], [6]) display flux density variations on time scales of 0.5 –2 days and variability amplitudes ranging from a few up to 30 percent. In order to explain the observed variations, intrinsic (e.g. shock-in-jet) as well as extrinsic models (i.e. interstellar scintillation) are discussed. If the observed intraday variability is interpreted as source intrinsic, the short variability time scales imply ultra-compact emission regions with extremely high photon densities, leading to apparent brightness temperatures, largely exceeding the inverse Compton (IC) limit for incoherent synchrotron radiation of K ([7], [13]) by several orders of magnitude (see also [16]). In order to bring these apparent brightness temperatures down to the IC-limit, rather extreme relativistic Doppler-boosting corrections (with Doppler-factors ) would be required. As such high Doppler-factors (and related bulk Lorentz factors) are not observed in AGN jets, alternate jet (and shock-in-jet) models are discussed, which make use of special, non-spherical geometries and allow for additional relativistic corrections (e.g. [15], [11]). It is also possible that the brightness temperatures are intrinsically high and are caused by some kind of coherent process (e.g. [3]). Further, it is unclear at present, if the IC limit might actually be violated for brief periods of time (e.g. [14]). The quasi-periodic and persistent violation of this limit (on time scales of hours to days) would then imply subsequent Compton catastrophes, each leading to outbursts of inverse Compton scattered radiation via second order scattering, which should be observable in the X-/ -ray bands ([7], [4]). Such efficient cooling flares would then rather quickly restore the local brightness temperature in the source (see also [10]).
In order to search for multi-frequency signatures of such short-term inverse Compton flashes occurring at hard X-ray and soft -ray energies, the proto-typical IDV source S5 0716+71 (z ¿ 0.3) was target of a large multi-frequency campaign performed between October 2003 and May 2004. The core-campaign was centered around a 500-ksec-INTEGRAL111INTErnational Gamma-ray Astrophysics Laboratory pointing of the source between November 10 and 17, 2003. In order to obtain as good as possible time and frequency coverage during the INTEGRAL observations, quasi-simultaneous flux density, polarization and VLBI observations at radio, millimeter, sub-millimeter, infrared and optical wavelengths were organized. An intial description of this large campaign with a first presentation of the results of the INTEGRAL observations and selected radio/optical variability curves was given by [10]. The analysis of the 3 mm and 1.3 mm intensity and polarisation measurements performed with the IRAM 30 m radio-telescope on Pico Veleta (PV) were presented by [1].
In the following we show and discuss first results of our combined analysis of the radio to (sub-) mm total intensity data acquired during the time of the core-campaign (November 10–17, 2003). In particular, we concentrate on the intra- to inter-day variability behavior of S5 0716+71 (herafter 0716+714) as deduced from the dense in time sampled total intensity data obtained with the Effelsberg 100 m (EF) and the IRAM 30 m telescope with special regard to a possible violation of the inverse Compton limit. These data sets are combined with the available (sub-) millimeter data to determine the broad-band variability and spectral characteristics of 0716+714. Further, we discuss the possible origin of the observed variations as well as present Doppler factors calculated through various methods in comparison with the high energy emission observed by INTEGRAL.
A detailed description of all observations and data sets as well as our full analysis and results including polarisation will be presented in a forthcoming paper ([5]).
2 Observations and data analysis
In total, seven radio observatories were involved, covering a frequency range from 1.4 to 666 GHz (corresponding to wavelengths ranging from 21 cm to 0.45 mm). In Table 1, the participating observatories and their frequency coverage are summarized. Here, we will concentrate on the observations performed with EB (4.85, 10.45, 32 GHz) and PV (86 GHz). At each frequency the target source and a sufficient number of secondary calibrators were observed continuously with a dense time sampling of about two flux density measurements per hour, source and frequency. The data reduction was performed following standard procedures for IDV observations with EB (e.g. [8]). A detailed description of the PV observations and data reduction can be found in [1]. Our individual measurement uncertainties typically lie in the range of 0.5–1 % up to 10.45 GHz and are a factor 2–3 higher at 32 GHz. At 86 GHz, a value of 1.2% was reached ([1]).
In order to study the multi-frequency variability characteristics of the source, each data set was investigated by a statistical variability analysis, based on the following steps: (i) a test for the presence of variability (-test), (ii) the measurement of the variability amplitudes and (iii) the determination of the characteristic variability timescales. These methods are described in more detail by [6], [12], [8] and [5]. Further, we performed a detailed cross-correlation (CCF) analysis between all possible frequency combinations as well as constructed (quasi-) simultaneous radio spectra by combining all available total intensity data for each observing day. Finally, lower limits to the Doppler factor were estimated and compared using various methods: (i) as deduced from the variability brightness temperatures, (ii) the equipartition Doppler factor using calculations of the synchrotron and equipartition magnetic field, (iii) as derived using the equipartition brightness temperature and (iv) the IC Doppler factor as calculated from the simultaneous INTEGRAL observations. Our results will be shortly presented and discussed in the following.
| Radio telescope & Institute | Location | [mm] |
|---|---|---|
| WSRT (14x25 m), ASTRON | Westerbork, NL | 210, 180 |
| Effelsberg (100 m), MPIfR | Effelsberg, D | 60, 28, 9 |
| Pico Veleta (30 m), IRAM | Granada, E | 3.5, 1.3 |
| Metsähovi (14 m), MRO | Metsähovi, Finland | 8 |
| Kitt Peak (12 m), ARO | Kitt Peak, AZ, USA | 3 |
| SMTO/HHT (10 m), ARO | Mt. Graham, AZ, USA | 0.87 |
| JCMT (15 m), JAC | Mauna Kea, HI, USA | 0.85, 0.45 |

3 Results and Discussion
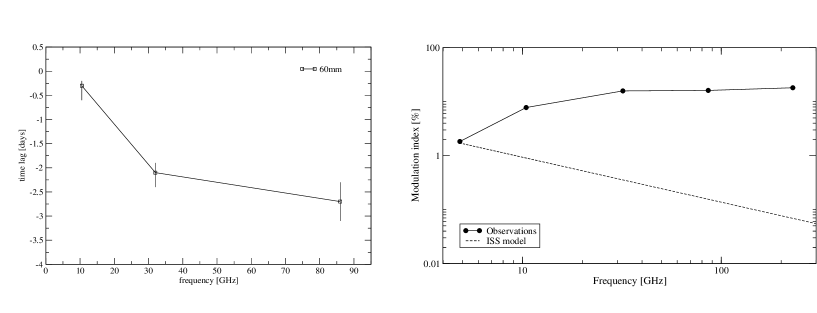
In Fig. 1 we plot the flux density measurements of 0716+714 versus time at 4.85, 10.45 and 32 GHz together with the residual flux density variability of the secondary calibrator 0836+714. In addition, we add from [1] the measurements obtained with the IRAM 30 m-telescope at 86 GHz. A first inspection of the light curves shows 0716+714 to be strongly variable when compared to the stationary secondary calibrator. Further, the source appears to be in a particular short-term variability phase when compared to the usually observed ’classical’, more rapid IDV pattern. At 60 mm 0716+714 shows only few percent low-amplitude variations followed by a slow (2 day) flux density increase after J.D. 2452957.6. The peak-to-peak amplitude variations are %. The light curves obtained at 28, 9 and 3.5 mm wavelengths are dominated by a much stronger monotonic increase of the flux density over a time range of several days. Here, the day time scale amplitude increase reaches up to % at 3 mm. Our CCF analysis confirms that the variability pattern occurs strongly correlated across the observing bands with a trend of increasing time lag towards larger frequency separation. In Fig. 2 (left panel) we plot the time lags for the 3 observing bands ( mm) versus observing frequency. A clear and systematic trend towards higher frequencies is seen which demonstrates that the observed flux density increase occurs first at the higher frequencies and then propagates through the radio spectrum towards lower frequencies. In addition, the variability amplitude is systematically more pronounced towards higher frequencies as seen from Fig. 1 as well as Fig. 2 (right panel). Such ‘canonical’ variability behavior provides strong evidence for a source intrinsic origin of the observed variability. A similar behaviour is seen in AGN and other compact radio sources over longer time intervals (weeks to years) and is commonly explained by synchrotron-cooling and adiabatic expansion of a flaring component or a shock (e.g. [9]). Furthermore, the observed frequency dependence of the variability amplitudes contradicts our calculations for a standard model of interstellar scintillation which further supports an intrinsic interpretation (Fig. 2, right panel). The sudden disappearance of the ‘classical‘, more rapid IDV behavior of 0716+714 in the cm-band is most likely caused by opacity effects and related to the overall flaring (and high radio-to-optical) state of the source during the campaign (see also [10]).
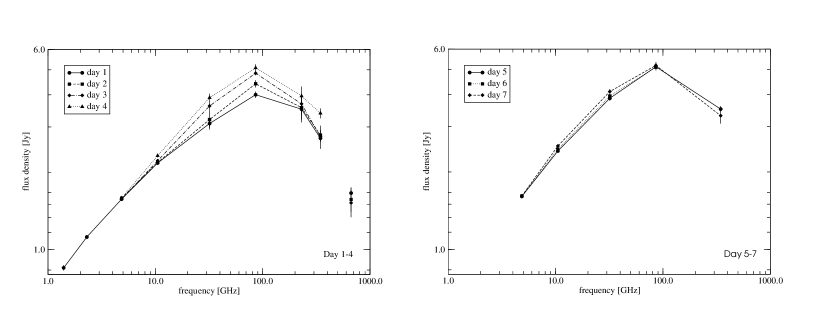
Our 7-day spectral evolution study shows an inverted synchrotron spectrum peaking near 90 GHz, with its spectral peak flux continously increasing during the first 4 days and then remaining nearly constant (see Fig. 3). Slight changes in the daily spectral slopes and the turn-over frequency indicate time-variable synchrotron self-absorption and expansion of the emission region, consistent with standard models. The calculated lower limits to the variability brightness temperatures deduced from the inter-day variations at the different radio-bands exceed the K inverse-Compton limit by two orders of magnitude in the mm-bands and orders of magnitude in the cm-bands. Assuming relativistic boosting, our different estimates of the Doppler factor yield robust lower limits of using the inverse-Compton limit and using the equipartition argument. Although high, these values are in good agreement with Doppler factors obtained from recent VLBI studies ( 20–30, [2]) and from the inverse-Compton Doppler factors 14–16 we derived using the simultaneous upper limits to the source emission in the INTEGRAL 3–200 keV energy range. The only obtained upper limits to the source emission in the soft -ray band (see [10]) imply high Doppler factors in the source as well as the non-detection of a simultaneous strong IC catastrophe during the period of our observations. Since a strong contribution of interstellar scintillation to the observed inter-day variability pattern can be excluded, we thus conclude that relativistic Doppler boosting appears to naturally explain the apparent violation of the theoretical limits as observed here.
References
- [1] I. Agudo, T. P. Krichbaum, H. Ungerechts et al., A&A 456 (2006).
- [2] U. Bach, T. P. Krichbaum, E. Ros et al., A&A 433 (2005).
- [3] G. Benford, ApJL 391 (1992).
- [4] S. D. Bloom & A. P. Marscher, ApJ 461 (1996).
- [5] L. Fuhrmann, T. P. Krichbaum, A. Witzel et al., A&A in prep.
- [6] D. S. Heeschen, T. P. Krichbaum, C. J. Schalinski et al., A&A 94 (1987).
- [7] K. I. Kellermann & I. I. K. Pauliny-Toth, ApJ 155L (1969).
- [8] A. Kraus, T. P. Krichbaum, R. Wegner et al., A&A 401 (2003).
- [9] A. P. Marscher & W. K. Gear, ApJ 298 (1985).
- [10] L. Ostorero, S. J. Wagner, J. Grazia et al., A&A 451 (2006).
- [11] S. J. Qian, A. Quirrenbach, A. Witzel et al., A&A 241 (1991).
- [12] A. Quirrenbach, A. Witzel, T. P. Kirchbaum et al., A&A 258 (1992).
- [13] A. C. S. Readhead, ApJ 426 (1994).
- [14] V. I. Slysh, ApJ 391 (1992).
- [15] M. Spada, M. Salvati, & F. Pacini, ApJ 511 (1999).
- [16] S. J. Wagner & A. Witzel, ARA&A 33 (1995).
- [17] A. Witzel, D. S. Heeschen, C. Schalinski et al., Mitt. der Astr. Gesellschaft Hamburg 65 (1986).