Stellar abundances of early-type galaxies
Abstract
It is currently impossible to determine the abundances of the stellar populations star-by-star in dense stellar systems more distant than a few megaparsecs. Therefore, methods to analyse the composite light of stellar systems are required. I review recent progress in determining the abundances and abundance ratios of early-type galaxies. I begin with ‘direct’ abundance measurements: colour–magnitude diagrams of and planetary nebula in nearby early-type galaxies. I then give an overview of ‘indirect’ abundance measurements: inferences from stellar population models, with an emphasis on cross-checks with ‘direct’ methods. I explore the variations of early-type galaxy abundances as a function of mass, age, and environment in the local Universe. I conclude with a list of continuing difficulties in the modelling that complicate the interpretation of integrated spectra and I look ahead to new methods and new observations.
1 Introduction
The spheroidal components of galaxies – elliptical and lenticular (S0) galaxies and the bulges of spirals – contain at least half of the present-day stellar mass in the local Universe (Schechter & Dressler 1987; Fukugita, Hogan & Peebles 1998). An understanding the formation and evolution of these objects is therefore necessary in order to understand the dominant galaxy types in the local Universe.
The abundances of stars in these objects give us direct handles on their formation and evolution. The gross metallicity of a galaxy tells us about its overall chemical evolution. Abundances of specific elements are much more useful, as these give direct evidence to the nucleosynthetic processes that occurred during the formation of that star (and by extension, of the stellar population and even galaxy). As a example, the ratio is crudely an indicator of the ratio of SNe II, which result from the explosion of massive stars and produce the -elements, to SNe Ia, which result from the explosion of low- to intermediate-mass stars and produce most of the Fe-peak elements. This leads to being commonly used as a tracer of the timescale of star formation, as it will decrease with increasing length of star formation as SNe Ia become more important in the nucleosynthesis in a stellar population (e.g., Worthey, Faber & González 1992; Greggio 1997; Trager et al. 2000b; Thomas et al. 2005; below). This is an oversimplification, of course, as can be seen in papers by Matteucci and Pipino & Matteucci (both in this volume).
Unfortunately, the Universe has made measuring stellar abundances in these objects difficult for us. Spheroids of galaxies are very dense and the crowding makes it impossible to make accurate photometric measurements of individual stars closer than one effective radius away from their centres in all spheroidal objects but our own Galactic Bulge (and in that case, dust presents a formidable barrier), even with the Hubble Space Telescope (HST). Attempting to determine abundances of individual stars from high-resolution spectra, as we do in the Milky Way, is accordingly impossible beyond the Local Group with the current generation of 8–10m ground-based telescopes and the 2.5m HST. The best we can hope for is to measure the colour–magnitude diagrams of the outer regions of these galaxies and infer their abundances from the distribution of stars on the giant branches, attempt to determine abundances from planetary nebulae – which stand out from the crowd as emission-line objects – and finally to infer abundances from the integrated light of the galaxies. Each of these methods will be discussed below.
In the following, I refer to as ‘direct’ methods those techniques that determine abundances from resolved stellar populations. Colour–magnitude diagrams fall into this category, even though abundances of individual stars may be poorly determined, as do abundances from analyses of planetary nebula spectra. I refer to as ‘indirect’ methods those techniques that determine abundances from unresolved stellar populations, in particular analysis of absorption-line strengths. I discuss direct abundance measurements in §2 and indirect abundance measurements in §3. I summarise the results in §4.
To conclude this section, I mention that there are other methods for determining the abundances of early-type galaxies, including the analysis of their globular cluster systems and determinations of the abundances of X-ray emitting gas. However, for reasons of space and of complications in relating these determinations to the stellar population of the host galaxy, I will not discuss them here. For the former, the interested reader can refer to Trager (2004) and Brodie & Strader (2006); for the later, see, e.g., Humphrey & Buote (2006). Finally, Jablonka has covered the subject of bulges of spiral galaxies elsewhere in this volume.
2 Direct abundance measurements
I begin with an overview of determinations of stellar population abundances of nearby galaxies using direct abundance measurements: colour–magnitude diagrams and planetary nebulae.
2.1 Abundances from colour–magnitude diagrams
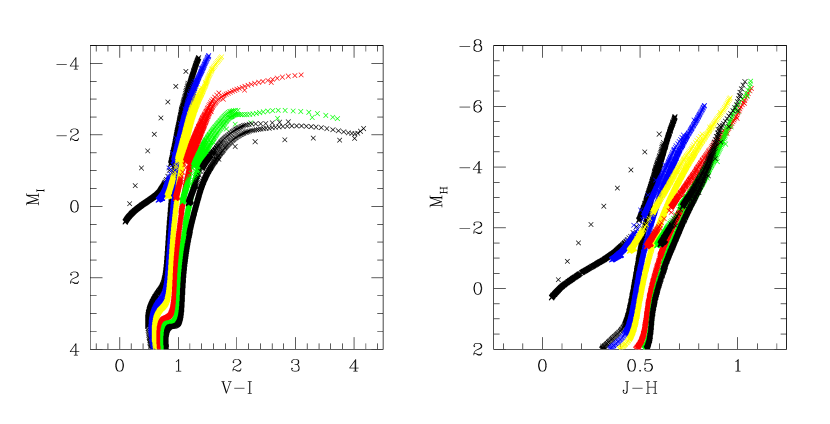
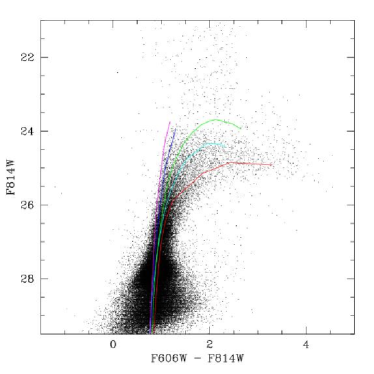
Currently, at least seven (non-dwarf) elliptical and S0 galaxies have observed colour–magnitude diagrams (CMDs): M32 (Grillmair et al. 1996), NGC 5128 (Rejkuba et al. 2005 and references therein), NGC 3379 (Gregg et al. 2004), NGC 3115, NGC 5102, NGC 404 (Schulte-Ladbeck et al. 2003), and Maffei 1 (Davidge & van den Bergh 2001). For all of these galaxies, CMDs have required HST imaging in the optical or near-infrared (NIR), except for Maffei 1, which was observed in the NIR with the CFHT adaptive optics system. However, in only three cases – M32, NGC 3379, NGC 5128 – have the CMDs reached significantly below the tip of the red giant branch (TRGB), required for reasonable abundance measurements (Fig. 1, left). In the other cases, only the asymptotic giant branch was detected (Maffei 1) or only stars less than one magnitude below the tip of the red giant branch were detected. In NGC 3779, although the NICMOS F110W () and F160W () measurements extend to three magnitudes below the tip of the asymptotic giant branch (AGB), the tight spacing of isochrones of different metallicities and the co-mingling of the AGB and RGB over this magnitude range makes precision estimates of stellar abundances very difficult, and only ranges of acceptable metallicities can be inferred rather than accurate metallicity distributions (Fig. 1, right; Gregg et al. 2003).
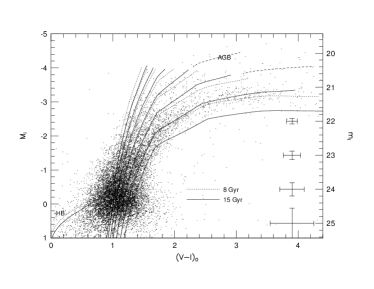
In M32, Grillmair et al. (1996) obtained a CMD at a distance of with WFPC2 on HST. Because M31 is superimposed on M32, the resulting CMD was statistically cleaned of M31 stars by using a nearby M31 disk field. The resulting CMD reaches a depth just below the ‘red clump’, the pile-up of red horizontal branch (helium burning) stars about four magnitudes below the TRGB (Fig. 2, left). There was no evidence of a blue horizontal branch (BHB) in this CMD, although the limiting magnitude in prevented ruling out its presence completely. Their absence has been confirmed in deeper WFPC2 (Worthey et al., in prep.) and ACS/HRC (Lauer et al., in prep.) observations. This is a crucial result, as BHB stars trace the most metal-poor stars in our Galaxy: at metallicities , helium-burning stars are dominantly BHB stars in Galactic globular clusters. Their lack in M32 suggests that this galaxy is deficient in metal-poor stars, which is confirmed by its metallicity distribution inferred from the distribution of RGB stars (Fig. 3, left). M32 therefore has a ‘G-dwarf problem’ (Worthey, Dorman & Jones 1996), for which the usual suggested solution is pre-enrichment of the galaxy (Tinsley 1980).
In NGC 5128, Rejkuba et al. (2005, following earlier studies of inner fields by Harris & Harris 2000, 2002) obtained a CMD at a distance of with ACS/WFC on HST. As in M32, Rejkuba et al. obtained a CMD down to the red clump (Fig. 2, right) and found no evidence of a BHB. Again, it is difficult to rule out their presence completely, but the metallicity distribution inferred from the distribution of RGB stars (Fig. 3, right) suggests that there are few (but some) very-metal-poor stars in NGC 5128.
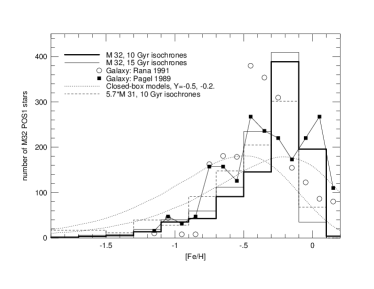
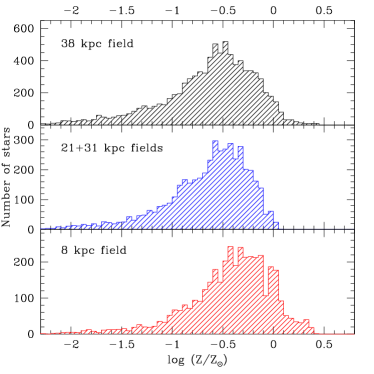
By counting stars on the RGB between isochrones of different metallicities (but typically constant age), a metallicity distribution function (MDF) can be determined. MDFs from M32 and NGC 5128 are shown in Figure 3. Both galaxies have a deficiency of metal-poor stars compared to a closed-box (‘Simple’) chemical evolution model, as discussed above. M32 has a sharp peak in its MDF at (using isochrones from Worthey 1994). In §3.2 below I will compare this inferred MDF with results from stellar population analyses. The MDF of NGC 5128 has a significant radial gradient and peaks at to , from the outermost to innermost fields (using isochrones from VandenBerg et al. 2000, re-calibrated to match Galactic globular clusters; see Rejkuba et al. 2005 for more details). Note that the lack of high-metallicity stars in the 21–31 kpc field of NGC 5128 is a selection effect due to insufficiently deep -band observations, so the shape of this MDF cannot be fairly compared to the inner and outer fields. Even so, in both galaxies, there are stars of at least solar metallicity, and there is evidence for super-metal-rich stars, particularly in the innermost field.
There are certain cautions to be kept in mind when considering CMD-inferred MDFs. First, old, single-age stellar populations are assumed in order to reliably compute these distributions. This is due to the lack of age information in insufficiently-deep CMDs: without CMDs that reach down below the main-sequence turn-off(s), the age is unknown (although the presence of bright AGB stars can indicate intermediate-aged populations). A shift, or worse, a distribution in stellar population age can change both the mean and shape of the inferred MDF. This can be seen by comparing the MDFs of M32 inferred from the 10 and 15 Gyr old isochrones in Figure 3 and imaging a mixture of these populations. Second, the assumed abundance pattern (as parametrised by, say, ) can also alter both the mean and shape of the inferred MDF. This is because changes in the abundance pattern can alter the temperature of the stars on the giant branch (e.g., Salaris, Chieffi & Straniero 1993). On the other hand, this may not be a significant problem for these two galaxies: for M32, because its abundance pattern is very close to that of the Sun (Worthey 2004), and the isochrones used to infer its MDF have scaled-solar composition (Worthey 1994); and for NGC 5128, because while the galaxy likely has because it is a giant elliptical (see below), the isochrones used to infer its MDFs were -enriched (Rejkuba et al. 2005).
2.2 Abundances from planetary nebulae
Planetary nebulae (PNe) are the second-to-last phase of the life of all low- and intermediate-mass stars. Although this phase is quite short, the large flux of stars through it means that many PNe are visible at any given time. Because this phase is so short, their density is much lower than the field stars from which they evolved, and therefore they are much less crowded on the sky. PNe are emission-line objects and are fairly easy to distinguish from the absorption-line background of their hosts. Using standard emission-line techniques it is possible to determine elemental abundances directly for each PNe.
However, PNe are quite faint. Special wide-field spectroscopy techniques have been developed to determine the kinematics of PNe systems around galaxies (e.g., Douglas et al. 2002), which utilise a narrow-band region around the [Oiii] line. But these techniques do not (yet) allow for abundance determinations, as these require a larger wavelength region: oxygen abundances require measurements of the [Oiii] and [Sii] lines. Moreover, the [Oiii] line is very weak. Unfortunately, without this line, the electron temperature cannot be measured directly, and strong-line techniques (such as those used for Hii regions) cannot be used for PNe because the temperature of the central stars vary significantly from object to object, and photoionization models do not give unique determinations (Stasińska et al. 2006). On the other hand, unlike in Hii regions, the [Oiii] line is still visible in metal-rich PNe because of the high density of the nebulae and the high temperatures of the central stars (Stasińska et al. 2005). With large telescopes (m) and sensitive spectrographs, bright PNe in early-type galaxies become reasonable tracer objects for the abundance patterns of their hosts.
Many early-type galaxies host well-known PNe systems, although for only a handful have abundance measurements been attempted. Here I will concentrate on the three cases that I know of that have independent abundance determinations from other methods: M32 (Stasińska, Richer & McCall 1998), NGC 5128 (Walsh et al. 1999, 2006), and NGC 4697 (Méndez et al. 2005). Of these, only M32 and NGC 5128 have PNe with detected [Oiii] lines: 9 PNe in M32 (Stasińska et al. 1998) and 2 (so far) in NGC 5128 (Walsh et al. 2006). None of the PNe in NGC 4697 show [Oiii] individually, although it is detected in an average spectra (Méndez et al. 2005). I will therefore (reluctantly) no longer consider it here, as the of the individual PNe cannot be determined and therefore their abundances are likely to be very uncertain. In M32, Stasińska et al. (1998) found , in reasonable agreement with and at projected galactocentric distances similar to those of the Grillmair et al. (1996) CMD study. Walsh et al. (1999) find a similar average [O/H] abundance ratio for NGC 5128 in a field close to the centre, although none of these PNe had detected [Oiii]. Walsh et al. (2006) appear to confirm this result using two PNe with estimates and also find evidence for two distinct populations of PNe in NGC 5128, a ‘bulge’ and a ‘halo’ population.
Abundances from PNe appear to be a rich area for further study, but the results of Méndez et al. (2005) and Walsh et al. (2006) suggest that perhaps the current generation of telescopes are at their limits even for PNe in galaxies as close as NGC 5128 (3.8 Mpc; Rejkuba et al. 2005).
3 Indirect abundance measurements
Given the difficulties of determining the abundances and abundance distributions star-by-star in even nearby early-type galaxies, another method is required. Analysis of the integrated light of these galaxies allows us to determine abundances and abundance patterns in entire stellar populations at over a significant fraction of the history of the Universe (currently out to : Jørgensen et al. 2005).
3.1 Stellar population models
Here I give a short overview of the method, which involves applying stellar populations to strengths of absorption lines tuned to decouple age and metallicity (and abundance ratios) in the spectra. A more complete description can be found in Trager (2004); for details the reader is referred to Trager et al. (2000a), with updates in Trager, Faber & Dressler (2006). An unfortunate drawback of this method at present is its inability to determine MDFs; only mean quantities (weighted in a peculiar way described below) can be determined.
At first glance, it might seem natural to use optical broad-band colours to determine rough abundances of galaxies: metal-poor stellar systems are blue and metal-rich ones are red. This is of course because the increasing opacity from metals removes light from the blue and moves it into the red, particularly on the RGB, which provides at least half of the optical light of galaxies. Unfortunately, age has the same effect: older populations are cooler because they have lower mass on the RGB and are therefore redder. One might expect to improve the situation by using metallic absorption lines like the feature, the MgH triplet (Mg2), or the Fe lines at 5270Å and 5335Å, which would allow a direct measurement of the metallicity. Unfortunately, these lines have the same problem as broad-band colours: they are formed in the atmospheres of the cool RGB stars and are sensitive to their temperatures – and are therefore also subject to variations in stellar population age. This age–metallicity degeneracy (e.g., O’Connell 1980) was finally broken by Worthey (1994) and Buzzoni, Mantegazzi & Gariboldi (1994), who independently showed that a plot of Balmer-line strength (such as ) as a function of metal-line strength could allow an independent measurement of stellar population age and metallicity (a result first demonstrated by Rabin 1982). This is because the temperature of the main-sequence turn-off (MSTO) of a stellar population is more sensitive to age than metallicity, and the Balmer lines of hydrogen are non-linearly sensitive to the temperature of the MSTO.
Stellar population models can then be built that predict the metal- and Balmer-line strengths of stellar populations (e.g., Worthey 1994). Stellar interior calculations, in the form of isochrones, are combined with stellar fluxes, either empirically or theoretically determined, and stellar absorption-line strengths, which are almost always empirically determined (but interpolation methods vary) to produce predicted line strengths as a function of stellar population age and composition. Modern models (e.g., Trager et al. 2000a; Thomas, Maraston & Bender 2003) now allow for variations in abundance ratios like , as models based on line strengths of solar-neighbourhood stars produce (for example) line strengths too weak for a given line strength compared to giant elliptical galaxies (see, e.g., Peterson 1976; O’Connell 1980; Peletier 1989; Worthey et al. 1992; Fig. 4).
3.2 Stellar population analyses

Once stellar population models are available, stellar population ages, metallicities, and abundance ratios can be read off of diagrams like Figure 4. (Note however that stellar population parameters are actually inferred from minimisation of the model line strengths against the observed line strengths.) All early-type galaxies span a range in metallicity and age (Trager et al. 2000b), with the mean age being older in clusters than in the field (Thomas et al. 2005). Early-type galaxies in all environments typically have and (depending exactly on the stellar population model used). There appears to be no significant difference in metallicity between different environments (Thomas et al. 2005; Sánchez-Blázquez et al. 2006), although possible small differences in [C/Fe] or [N/Fe] are possible (Sánchez-Blázquez et al. 2006).
An important caveat must be understood when reading diagrams like Figure 4. The ages and compositions inferred from these diagrams are those of the equivalent single stellar population (we call them the ‘SSP-equivalent’ parameters). That is, these are the ages and compositions that the objects would have if they were composed solely of a single population formed in a single burst at the SSP-equivalent age with a chemical composition given by the SSP-equivalent metallicity and abundance ratio(s). This means that the composite populations of real galaxies are treated in terms of their line-strength-weighted mean population parameters. In the case of M32, we can study what effect the MDF has on the inferred SSP-equivalent metallicity. The light-weighted mean metallicity from the MDF is , as can be inferred from Figure 3 (left). Using absorption-line measurement extrapolated (slightly) to precisely the same position in the galaxy, (Trager et al. 2000b). This excellent agreement between the metallicities inferred from the integrated light and the CMD is only possible in the absence of a metal-poor tail in the MDF, as hot stars corrupt the abundances inferred from line-strengths (Trager et al. 2005). More extensive analyses using synthetic star formation histories and chemical evolution models shows that the inferred SSP-equivalent metallicities and ratios are very close to their light-weighted or even mass-weighted mean values (Serra & Trager 2006; Trager & Somerville, in prep.). This is certainly not the case for the SSP-equivalent ages, which can be easily skewed to young ages by the presence of very small amounts of young stars.
Using long-slit spectra of M32 and sophisticated stellar population models that include in a limited way the variation of individual elements as a function of Fe abundance, Worthey (2004) finds , , , and near the nucleus. This confirms the generally-held notion that M32 has an abundance pattern very much like that of the Sun (O’Connell 1980; Grillmair et al. 1996; Trager et al. 2000a). The inferred nitrogen abundance appears to be too low compared to the nitrogen abundances of the PNe (Stasińska et al. 1998), but this could be due to self-enrichment of nitrogen in the PNe.

With this caveat in mind, the variations of stellar population parameters with velocity dispersion (as a tracer of the mass) can be examined. The left panel of Figure 5 shows the mass–metallicity relation for field galaxies. That a narrower mass–metallicity relation is not apparent in this plot is due to the real anti-correlation between SSP-equivalent age and metallicity of galaxies in this sample (middle panel): older field galaxies have lower metallicities at fixed velocity dispersion. The dispersion in ages causes a broadening of the mass–metallicity relation. A narrow mass–metallicity relation is however seen clearly in cluster samples (e.g., Nelan et al. 2005; Trager et al. 2006), because these samples have small age spreads. At the same time, there is a clear mass– relation in all environments, which is only weakly dependent on (Thomas et al. 2005; Nelan et al. 2005) or independent of (Trager et al. 2000b) SSP-equivalent age. The physical mechanisms driving these relations are likely to be a combination of rapid star formation, so that SNe II products dominate over SNe Ia products, and metal-enriched outflows, in which high-mass galaxies retain their SNe II products – which dominate the overall metallicity of the systems – more easily than low-mass galaxies (Trager et al. 2000b; and see Matteucci and Pipino & Matteucci, this volume).
3.3 Continuing annoyances
Nothing is easy, of course. Besides the effects of composite populations on the inferred stellar population parameters and the fact that MDFs cannot (currently) be determined from the integrated light, two major annoyances persist when trying to infer abundances from absorption-line measurements. The first is the unknown oxygen abundances of early-type galaxies. The oxygen abundance controls the temperature of the MSTO (Salaris & Weiss 1998), and so the inferred age – and therefore metallicity – is dependent on the oxygen abundance. It is not yet clear if a good tracer of oxygen abundance is available in the optical (but see below). The second is the hot-star content of these galaxies. Trager et al. (2005) have shown that these stars, such as BHB and blue straggler stars, not only corrupt age measurements for the oldest objects (e.g., Maraston & Thomas 2000) but also corrupt abundance measurements. Correcting for this effect requires excellent models and data with sensitivity in the blue, but this has been done for very few galaxies.
4 Summary
Early-type galaxies are dominantly metal-rich, of typically solar metallicity, and usually enriched in SNe II products. Their compositions – both bulk metallicity and abundance ratios – depend on their mass, and possibly on their environment. Their MDFs appear to violate ‘Simple’ chemical evolution models and therefore these galaxies suffer like the Milky Way from the G-dwarf problem. They appear to have complex star formation histories: galactic winds and rapid star formation have apparently played crucial roles in their chemical evolution; and there is mounting evidence for recent star formation, suggesting perhaps recent accretion or mergers playing a role. Better understanding of their nucleosynthetic properties would be very helpful to disentangle these histories.
The future for the understanding the nucleosyntetic histories of early-type galaxies is bright. Serven, Worthey & Briley (2005) have developed 54 new indices over a wide wavelength range in the optical that will help to determine C, N, O, Na, Mg, Al, Si, Ca, Sc, Ti, V, Cr, Mn, Fe, Co, Ni, Sr, and Ba abundances. A significant computational effort is underway by Worthey and collaborators (including the author) to produce fully self-consistent stellar interior and atmosphere models (and emergent spectra) to take advantage of these indices and their predecessors, the Lick/IDS indices. At the same time, line-strength measurements are being pursued both with two-dimensional spectrographs like Sauron to study local galaxies (e.g., Kuntschner et al. 2006) and with multislit spectrographs on large telescopes to study very distant ones (e.g., Jørgensen et al. 2005). New observations of nearby early-type with ACS on HST (such as the Lauer et al. and Worthey et al. studies of M32) will greatly improve our knowledge of their MDFs (and ages). Hopefully the next generation of large telescopes will enable star-by-star chemical studies of the nearest elliptical galaxies!
I thank the SOC and LOC, particularly Garik Israelian, for the kind invitation to review this subject and for their financial support that enabled my participation. I wish also to thank my collaborators, Alan Dressler, Sandy Faber, Wendy Freedman, Carl Grillmair, Tod Lauer, Ken Mighell, Paolo Serra, Rachel Somerville, and Guy Worthey for allowing me to present results from on-going studies. Thanks to Carl Grillmair and Marina Rejkuba for allowing me to reprint two figures each. Finally, I would like to thank Grazyna Stasińska for a very helpful discussion about the use of planetary nebulae as abundance indicators, Patricia Sánchez-Blázquez for several helpful conversations, and Marina Rejkuba for reading a draft of the manuscript.
References
- [] Bender, R., Burstein, D., and Faber, S. M. (1992). ApJ, 399, 462.
- [] Brodie, J. P. and Strader, J. (2006). ARA&A, 44, 193.
- [] Bruzual, G. and Charlot, S. (2003). MNRAS, 344, 1000.
- [] Buzzoni, A., Mantegazza, L., and Gariboldi, G. (1994). AJ, 107, 513.
- [] Davidge, T. J. and van den Bergh, S. (2001). ApJ, 553, L133.
- [] Douglas, N. G., Arnaboldi, M., Freeman, K. C., et al. (2002). PASP, 114, 1234.
- [] Fisher, D., Franx, M., and Illingworth, G. (1996). ApJ, 459, 110.
- [] Fukugita, M., Hogan, C. J., and Peebles, P. J. E. (1998). ApJ, 503, 518.
- [] González, J. J. (1993). PhD Thesis, University of California, Santa Cruz.
- [] Gregg, M. D., Ferguson, H. C., Minniti, D., Tanvir, N., and Catchpole, R. (2004). AJ, 127, 1441.
- [] Greggio, L. (1997). MNRAS, 285, 151.
- [] Grillmair, C. J., Lauer, T. R., Worthey, G., et al. (1996). AJ, 112, 1975.
- [] Harris, G. L. H. and Harris, W. E. (2000). AJ, 120, 2423.
- [] Harris, W. E. and Harris, G. L. H. (2002). AJ, 123, 3108.
- [] Humphrey, P. J. and Buote, D. A. (2006). ApJ, 639, 136.
- [] Jørgensen, I., Bergmann, M., Davies, R., Barr, J., Takamiya, M., and Crampton, D. (2005). AJ, 129, 1249.
- [] Kuntschner, H. (2000). MNRAS, 315, 184.
- [] Kuntschner, H., Emsellem, E., Bacon, R., et al. (2006). MNRAS, 369, 497.
- [] Maraston, C. and Thomas, D. (2000). ApJ, 541, 126.
- [] Nelan, J. E., Smith, R. J., Hudson, M. J., Wegner, G. A., Lucey, J. R., Moore, S. A. W., Quinney, S. J., and Suntzeff, N. B. (2005). ApJ, 632, 137.
- [] O’Connell, R. W. (1980). ApJ, 236, 430.
- [] Peletier, R. F. (1989). PhD Thesis, Rijksuniversiteit Groningen.
- [] Peterson, R. C. (1976). ApJ, 210, L123.
- [] Pietrinferni, A., Cassisi, S., Salaris, M., and Castelli, F. (2004). ApJ, 612, 168.
- [] Pietrinferni, A., Cassisi, S., Salaris, M., and Castelli, F. (2006). ApJ, 642, 797.
- [] Rabin, D. (1982). ApJ, 261, 85.
- [] Rejkuba, M., Greggio, L., Harris, W. E., Harris, G. L. H., and Peng, E. W. (2005). ApJ, 631, 262.
- [] Salaris, M. and Weiss, A. (1998). A&A, 335, 943.
- [] Salaris, M., Chieffi, A., and Straniero, O. (1993). ApJ, 414, 580.
- [] Sánchez-Blázquez, P., Gorgas, J., Cardiel, N., and González, J. J. (2006). A&A, 457, 809.
- [] Schechter, P. L. and Dressler, A. (1987). AJ, 94, 563.
- [] Schulte-Ladbeck, R. E., Drozdovsky, I. O., Belfort, M., and Hopp, U. (2003). Ap&SS, 284, 909.
- [] Serra, P. and Trager, S. C. (2006). MNRAS, in press.
- [] Serven, J., Worthey, G., and Briley, M. M. (2005). ApJ, 627, 754.
- [] Stasińska, G., Richer, M. G., and McCall, M. L. (1998). A&A, 336, 667.
- [] Stasińska, G., Vílchez, J. M., Pérez, E., Corradi, R. L. M., Mampaso, A., and Magrini, L. (2005). AIPC, 804, 262.
- [] Stasińska, G., Vílchez, J. M., Pérez, E., Gonzalez Delgado, R. M., Corradi, R. L. M., Mampaso, A., and Magrini, L. (2006). In Planetary Nebulae Beyond the Milky Way, ed. L. Stanghellini, J. R. Walsh, and N. G. Douglas (Springer Verlag, Berlin), 234.
- [] Thomas, D., Maraston, C., and Bender, R. (2003). MNRAS, 339, 897.
- [] Thomas, D., Maraston, C., Bender, R., and Mendes de Oliveira, C. (2005). ApJ, 621, 673.
- [] Tinsley, B. M. (1980). FCPh, 5, 287.
- [] Trager, S. C. (2004). In Origin and Evolution of the Elements, ed. A. McWilliam and M. Rauch (Cambridge University Press, Cambridge), 388.
- [] Trager, S. C., Faber, S. M., and Dressler, A. (2006), in preparation
- [] Trager, S. C., Faber, S. M., Worthey, G., and González, J. J. (2000a). AJ, 119, 1645.
- [] Trager, S. C., Faber, S. M., Worthey, G., and González, J. J. (2000b). AJ, 120, 165.
- [] Trager, S. C., Worthey, G., Faber, S. M., and Dressler, A. (2005). MNRAS, 362, 2.
- [] VandenBerg, D. A., Swenson, F. J., Rogers, F. J., Iglesias, C. A., and Alexander, D. R. (2000). ApJ, 532, 430.
- [] Walsh, J. R., Walton, N. A., Jacoby, G. H., and Peletier, R. F. (1999). A&A, 346, 753.
- [] Walsh, J. R., Jacoby, G., Peletier, R., and Walton, N. A. (2006). In Planetary Nebulae Beyond the Milky Way, ed. L. Stanghellini, J. R. Walsh, and N. G. Douglas (Springer Verlag, Berlin), 262.
- [] Worthey, G. (1994). ApJS, 95, 107.
- [] Worthey, G. (2004). AJ, 128, 2826.
- [] Worthey, G., Dorman, B., and Jones, L. A. (1996). AJ, 112, 948.
- [] Worthey, G., Faber, S. M., and González, J. J. (1992). ApJ, 398, 69.