Dark matter substructure and gamma-ray annihilation in the Milky Way halo
Abstract
We present initial results from “Via Lactea”, the highest resolution simulation to date of Galactic CDM substructure. It follows the formation of a Milky Way-size halo with in a WMAP 3-year cosmology, using 234 million particles. Over 10,000 subhalos can be identified at z=0: Their cumulative mass function is well-fit by down to . The total mass fraction in subhalos is 5.3%, while the fraction of surface mass density in substructure within a projected distance of 10 kpc from the halo center is 0.3%. Because of the significant contribution from the smallest resolved subhalos, these fractions have not converged yet. Sub-substructure is apparent in all the larger satellites, and a few dark matter lumps are resolved even in the solar vicinity. The number of dark satellites with peak circular velocities above () is 124 (812): of these, 5 (26) are found within , a region that appeared practically smooth in previous simulations. The neutralino self-annihilation -ray emission from dark matter clumps is approximately constant per subhalo mass decade. Therefore, while in our run the contribution of substructure to the -ray luminosity of the Galactic halo amounts to only % of the total spherically-averaged smooth signal, we expect this fraction to grow significantly as resolution is increased further. An all-sky map of the expected annihilation -ray flux reaching a fiducial observer at 8 kpc from the Galactic center shows that at the current resolution a small number of subhalos start to be bright enough to be visible against the background from the smooth density field surrounding the observer.
Subject headings:
cosmology: theory – dark matter – galaxies: dwarfs – galaxies: formation – galaxies: halos – methods: numerical1. Introduction
In structure formation scenarios dominated by cold dark matter (CDM), the halos of galaxies and galaxy clusters are assembled via the hierarchical merging and accretion of smaller progenitors. This process causes structures to virialize to a new equilibrium by redistributing energy among the collisionless mass components. Early low resolution numerical simulations and simple analytical models found that the end products of this “bottom-up” scenario were smooth, triaxial halos. In recent years, higher resolution cosmological N-body simulations have modified this picture: the merging of progenitors is not always complete, and the cores of accreted halos often survive as gravitationally bound subhalos orbiting within a larger host system. CDM halos are not smooth, they have a wealth of substructure on all resolved mass scales (e.g. Moore et al. 1999; Klypin et al. 1999; Moore et al. 2001; Stoehr et al. 2003; Diemand et al. 2004b; Reed et al. 2005; Gao et al. 2005; Diemand et al. 2006).
The amount and spatial distribution of subhalos around their host provide unique information and clues on the galaxy assembly process and the nature of the dark matter. The mismatch between the dozen or so dwarf satellite galaxies observed around the Milky Way and the predicted large number of CDM subhalos of comparable circular velocity (Moore et al., 1999; Klypin et al., 1999) has been the subject of many recent studies. Solutions involving feedback mechanisms that make star formation in small halos very inefficient offer a possible way out (e.g. Bullock et al. 2000; Somerville 2002; Kravtsov et al. 2004; Moore et al. 2006). Other models have attempted to solve the apparent small-scale problems of CDM at a more fundamental level, i.e. by reducing small-scale power (e.g. Kamionkowski & Liddle 2000). Even if most dark matter satellites have no optically luminous counterparts, the substructure population may be detectable via flux ratio anomalies in strong gravitational lenses (e.g. Metcalf & Madau 2001; Chiba 2002), through its effects on stellar streams (e.g. Ibata et al. 2002; Mayer et al. 2002), or possibly via -rays from dark matter annihilation in their cores (Bergstrom et al., 1999; Calcaneo-Roldan & Moore, 2000; Stoehr et al., 2003; Colafrancesco et al., 2006; Diemand et al., 2006).
The possibility of observing the fingerprints of the small-scale structure of CDM hinges on the ability of subhalos to survive the hierarchical clustering process as substructure within the host. This is in turn particularly sensitive to resolution issues, as subhalos with numerically softened central densities are more easily disrupted by tidal forces. In this paper we present initial results on halo substructure from a new N-body cosmological simulation of unprecedented dynamic range: dubbed “Via Lactea”, it resolves the galaxy forming region of a Milky Way-size halo at with over 200 million particles. This is an order of magnitude more than used in previous simulations. The run was completed in 320,000 CPU hours on NASA’s Project Columbia supercomputer, currently one of the fastest machines available.

2. Simulations
The simulation was performed with PKDGRAV (Stadel, 2001; Wadsley, Stadel & Quinn, 2004) and employed multiple mass particle grid initial conditions generated with the GRAFICS package (Bertschinger, 2001). The high resolution region was sampled with 234 million particles particles of mass and evolved with a force resolution of 90 pc. It was embedded within a periodic box of comoving size 90 Mpc, which was sampled at lower resolution to account for the large scale tidal forces. We adopted the best-fit cosmological parameters from the WMAP three-year data release (Spergel et al., 2006): , , , , and . The lower values of and compared to 1-year WMAP results have the effect of delaying structure formation and reducing small-scale power. The simulation was centered on an isolated halo that had no major merger after , making it a suitable host for a Milky Way-like disk galaxy. In this work we focus on results obtained at z=0, the formation history of the Via Lactea halo and its substructures will be presented in a subsequent paper. The host halo mass at is within a radius of kpc (We define ”” as the radius within which the enclosed average density is 200 times the mean matter value). We used adaptive time-steps as short as Gyr yr satisfying the condition , where is the force softening length and is the local acceleration. This criterion is insufficient to ensure convergence at small radii, where the dynamical time becomes too short and runs using the criterion start to underestimate matter densities. In comparable runs this problem was observed to to give 10% too low local densities at , see Figure 1 of Diemand et al. 2005. This density is reached at in the Via Lactea run, therefore we set . The local densities (but not necessarily the logarithmic slopes) should be correct to within 10% beyond , but detailed convergence tests using galaxy scale halos would be needed to confirm this. To resolve the density profile further in than , adaptive time-steps that scale with dynamical timescale should be adopted instead (Zemp et al., 2006). The force calculations in the tree algorithm PKDGRAV includes multipole moments up to hexa-decapole to reach high force accuracy. To check for numerical convergence of substructure properties we resimulated the same halo (plus a few neighboring galaxy halos) with 27 times more massive particles. The parameters of the two simulations are summarized in Table 2.
| 48.4 | 0.0 | 90 pc | ||
| 48.4 | 0.0 | 378 pc |
Figure 1 (upper panel) shows the logarithmic slope of the spherically-averaged density profile, , for our Via Lactea halo, plotted versus radius. The fitting formula proposed by Navarro, Frenk, & White (1997) with scale radius of kpc provides a reasonable approximation to the density profile down to our convergence radius . Within the region of convergence, deviations from the best-fit NFW matter density are typically less than 10%. From down to Via Lactea is actually denser than predicted by the NFW formula. Near the density approaches the NFW value again while the logarithmic slope is shallower ( at ) than that the NFW fit. While we have checked that these conclusions are robust to variations in the binning used to construct the density profile, they might be affected by numerical flattening near our convergence radius. We plan to run new simulations with improved time-stepping (Zemp et al., 2006) to address this issue.
3. Substructure in galaxy halos
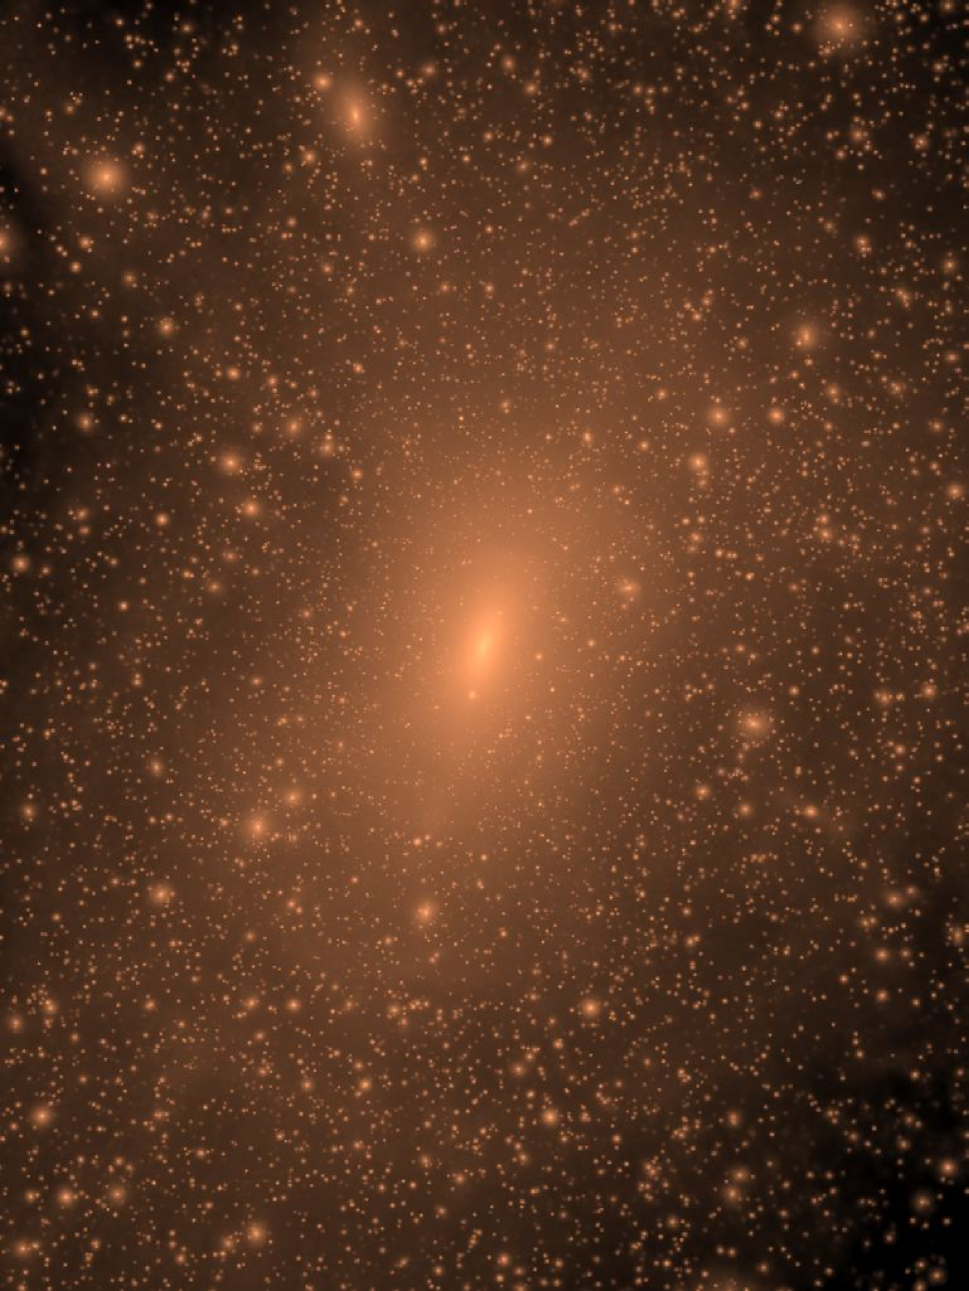
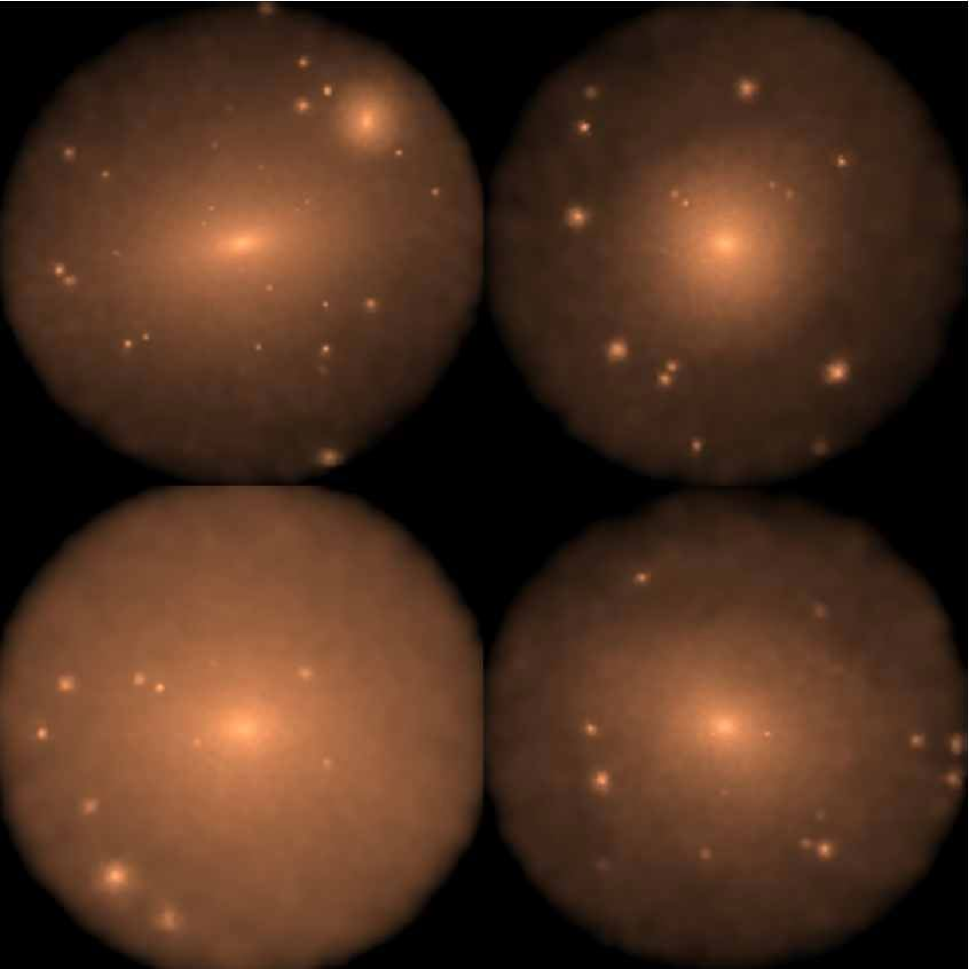
The wealth of substructure resolved in our Via Lactea run is clearly see in Figure 2. About 10,000 surviving satellites, some sub-subhalos (a few examples are shown in Fig. 3), and even a couple of dark matter clumps at less than 8 kpc from the Galactic Center are now resolved.
3.1. Subhalo identification
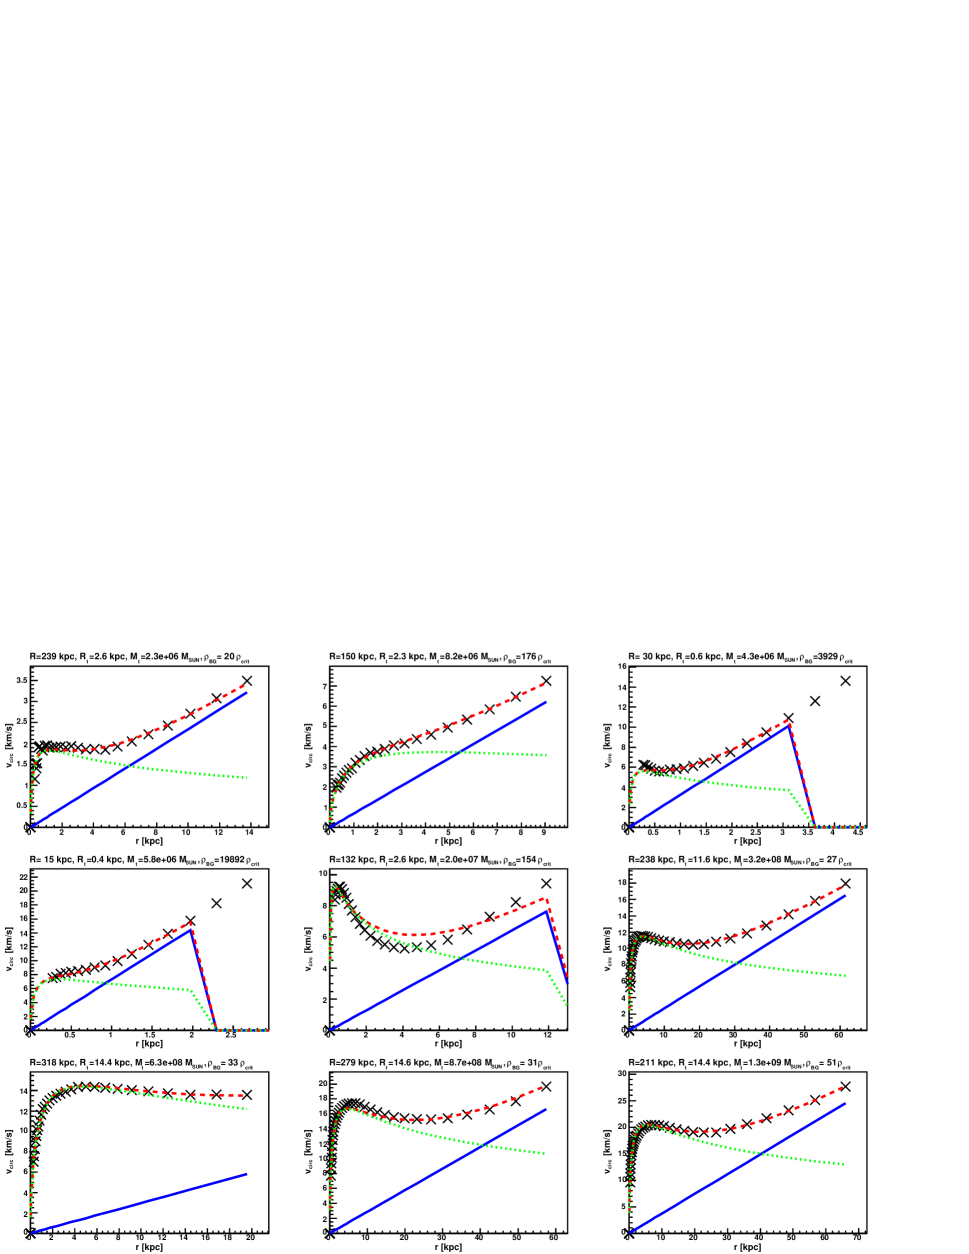
We have constructed substructure catalogs using the phase-space friends-of-friends algorithm 6DFOF described in Diemand et al. (2006). We adopt a space linking length of 0.28 physical kpc (0.033 of the mean particle separation at ), a velocity space linking length of 16 physical (0.1 of the mean 1D velocity dispersion of the host halo), and keep all groups with at least 16 members. Around their centers, spherical density profiles (using 50 logarithmic bins) were constructed: the bins reach out to in the case of isolated halos or out to the center of the nearest larger halo in the case of subhalos, i.e. all structures are allowed to contain their own, smaller substructures. The resulting circular velocity profiles were then fitted with the sum of an NFW profile and a constant density background. The radial range used in these fits starts at 3 force softening lengths, i. e. 0.27 kpc in the Via Lactea run, and ends either at the largest radial bin stored during at runtime or further in if the circular velocity grows linearly (within 10%) over five consecutive bins. Figure 4 shows nine example subhalo circular velocity profile fits. A subhalo tidal radius was defined as , where is the local matter density of the host halo. This is the tidal radius of an isothermal () satellite on a circular orbit within an isothermal host. We define the subhalo mass to be all the mass within , i.e. we did not perform an unbinding procedure. The speed of 6DFOF and its parallel implementation into PKDGRAV allowed us to use it at run-time with negligible computational cost (compared to the gravity calculations) on all 200 snapshots that were stored (separated by 68.5 Myr).
The 6DFOF subhalo list was checked in various regions of the Via Lactea halo against a list obtained with SKID (Stadel, 2001). The results compare very well down to about 40 particles per halo except for the very largest subhalos, where the SKID algorithm tends to underestimate the masses and is unable to properly account for the presence of resolved sub-substructure. Detailed evolutionary tracks of subhalo properties and density profiles will be published in a subsequent paper.
3.2. Subhalo abundance
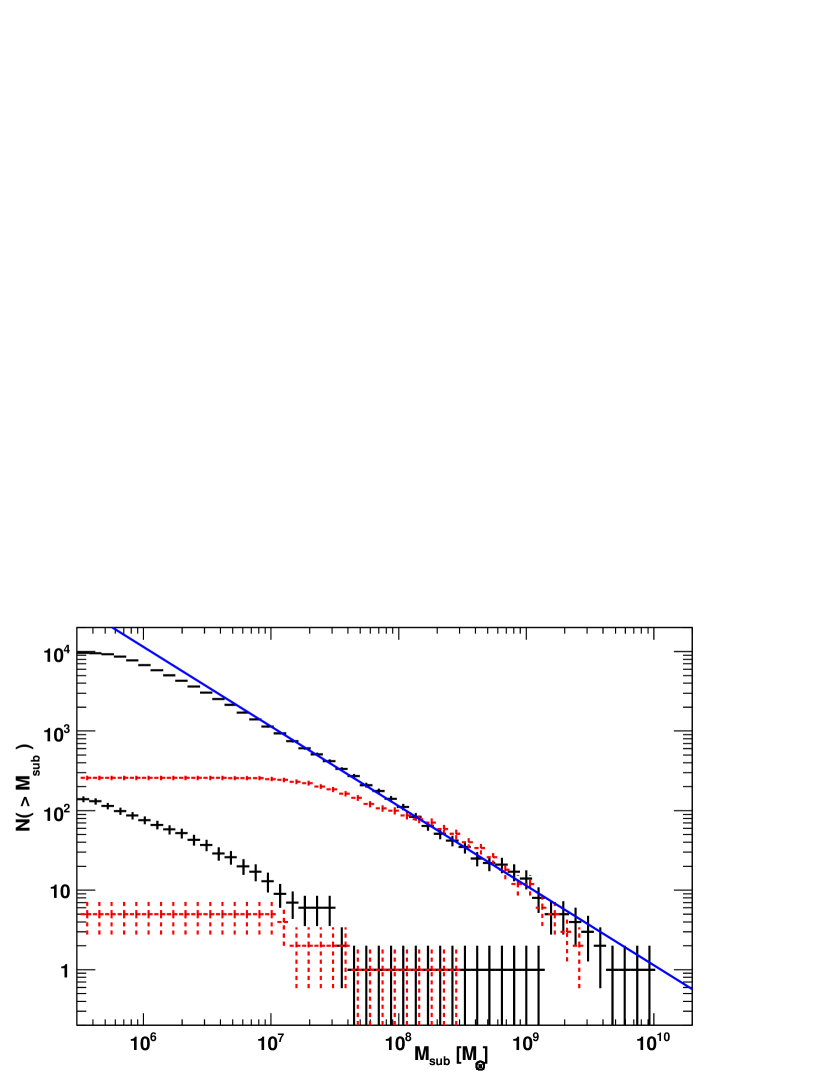
In Figure 5 we present the cumulative mass function for our entire subhalo populationw ithin as well as for the subpopulation within the inner . The former is well-fit by a power-law above , as shown by the solid line (formally, the best-fit slope in the mass range is ). This slope implies an equal mass per subhalo mass decade, making the total mass in substructure quite dependent on resolution. Note how numerical resolution effects start to flatten the distribution already below masses corresponding to about 200 particles (i.e. below and for the Via Lactea and the lower resolution run, respectively). The fraction of the host halo mass in subhalos is within . The contribution from subhalos below is significant: . The total substructure mass fractions in the lower resolution run are substantially smaller, . This is in part because the low resolution realization happens to contain slightly fewer massive satellites at , and in part because of the reduced number of resolved small subhalos.
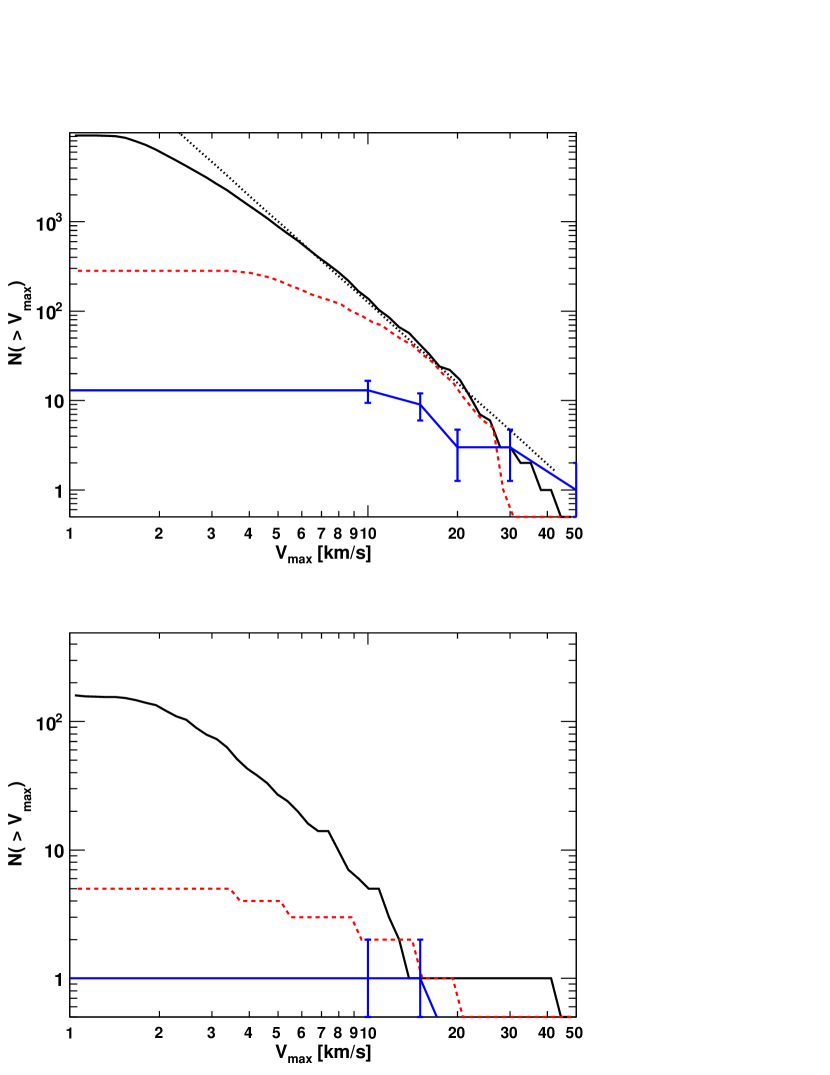
Figure 6 shows the cumulative peak circular velocity () function for the entire subhalo population within as well as for the inner sub-population. The former is well-fit by a power-law above , as shown by the dotted line. This is in good agreement with the mean abundance obtained from a large sample of host halos by Reed et al. (2005) after accounting for the effect of the different cosmology.111Reed et al. (2005) simulations were normalized using . Decreasing to 0.74 (the value used here) lowers the subhalo velocity function by about a factor two (see Zentner & Bullock 2003 and the erratum to Diemand et al. 2004b). Note how numerical effects start to flatten the velocity functions below and already below for the lower resolution run.
3.3. A ”missing inner satellites” problem?
The number of dark matter subhalos with peak circular velocity larger than is 124 (compared to 74 in the lower resolution run). This is an order of magnitude larger than the dozen or so dwarf satellite galaxies of comparable circular velocity observed around the Milky Way (Moore et al., 1999; Klypin et al., 1999), a well known mismatch often referred to as the “missing satellites problem”. The WMAP 3-year cosmological parameters do not alleviate the discrepancy significantly, and with our very high resolution Via Lactea the difference between the predicted number of CDM subhalos and the satellites actually observed has become even more pronounced. Indeed, we find a new “missing inner satellites problem” within kpc, a region that appeared practically smooth in previous lower resolution simulations. In this inner region we now resolve 5 (26) dark satellites with (), compared to only one known Milky Way dwarf galaxy, Sagittarius at a distance of kpc (Mateo, 1998). Even when the suspected stripped cores of dwarf spheroidals from the recent compilation of van den Bergh (2006) are included, the numbers of observed inner satellites remain well below the predicted number of substructures in the inner halo.
Recent Local Group models (Kravtsov et al., 2004; Moore et al., 2006) were based on simulations like the lower resolution run used in this work. The overall abundance of subhalos does increase with resolution in the relevant range, but not dramatically, i.e. the total abundance of satellite galaxies in these models seems not to be very affected by their lower numerical resolution. But what would these two models predict about satellite galaxies within the newly resolved inner subhalos? The Kravtsov et al. (2004) model allows galaxy formation only in subhalos that were relatively massive () before they fell into the gravitational potential of the host. In the Moore et al. (2006) scenario only the earliest forming halos above the atomic cooling mass at become proto-galactic building blocks (many of these systems remain well below at all times). By they have built up a halo of stars, globular clusters and a few surviving dwarfs. We followed the assembly history of the inner subhalos backwards in time and found that only two of them lie above the (time dependent) minimum mass from Kravtsov et al. (2004). The same two systems are also the only ones that form early enough to become luminous in the (Moore et al., 2006) scenario. In the inner both models thus predict two dwarf galaxies, in good agreement with the numbers observed around the Milky Way and M31, and leave the other three inner subhalos above dark. Therefore the new, missing inner satellites problem seems to be resolvable in the same way as the well known Local Group wide problem. The overabundance of inner subhalos might not be a problem for CDM, but it leads to the new and interesting prediction of having a number of relatively large, dark CDM subhalos orbiting in the inner halo, i.e. in the same region where the Milky Way galaxy is located.
3.4. Mass fractions in substructure and gravitational lensing
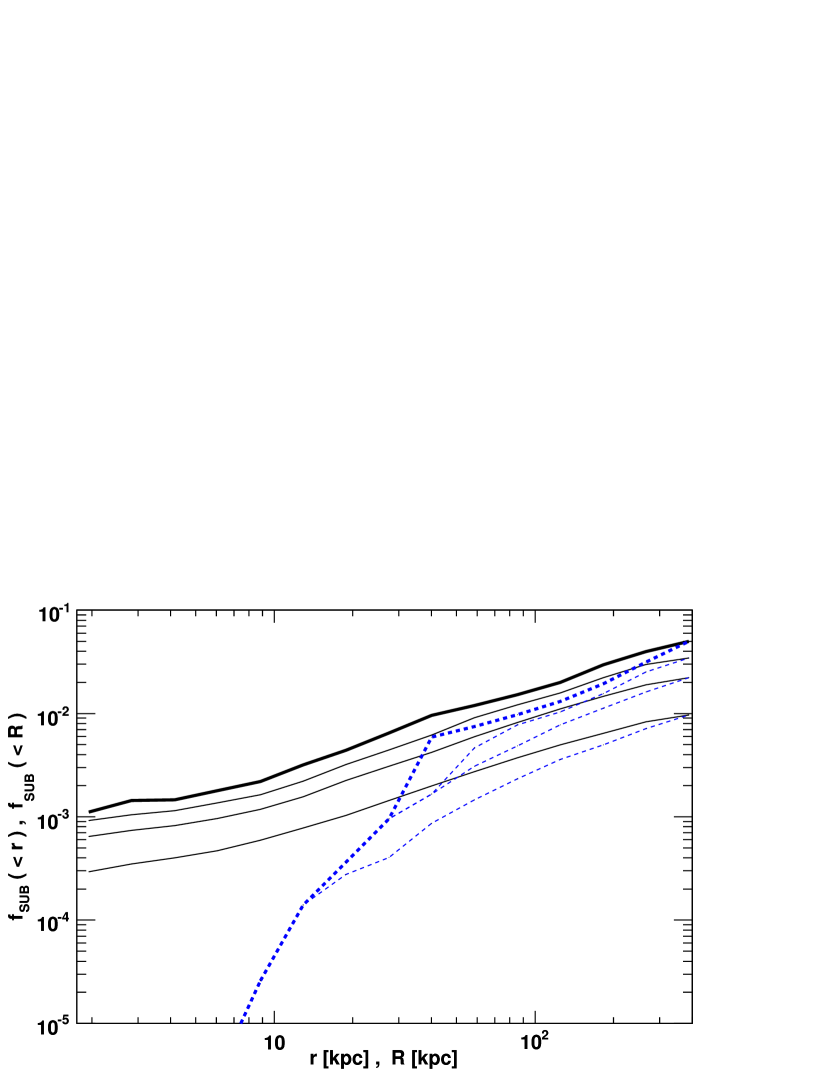
Standard smooth gravitational lens models have difficulties in explaining the relative fluxes of multiply-imaged quasars (Mao & Schneider, 1998; Metcalf & Zhao, 2002). The discrepancy between the predicted and observed flux ratios is commonly referred to as the “anomalous flux ratio problem”, and dark matter substructure within the lens halo is one of the leading interpretations of such anomaly (e.g. Metcalf & Madau 2001; Chiba 2002; Dalal & Kochanek 2002; Bradac et al. 2004; Mao et al. 2004; Amara et al. 2006; Maccio et al. 2006). Rather than the total mass fraction, lensing observations are sensitive to the mass fraction in substructure projected through a cylinder of radius 5-10 kpc around the lens center. Figure 7 depicts the fraction of the host halo mass within a sphere of radius that is bound up in substructure, , as well as the substructure mass fraction in cylindrical projection of radius , , measured in our Via Lactea simulation. The radial distribution follows the subhalo number density profile given in Diemand et al. (2004b), i.e. it is more extended than the overall mass distribution. In the vicinity of kpc, the surface mass density for all subhalos with can be approximated as .
Our total projected surface densities are consistent with, but on the low side of, estimates from semianalytic models (Zentner & Bullock, 2003), although we find significantly larger contributions from the smallest subhalos at large projected radii. The total projected surface densities is lower than the few percent value that seems to be required to explain the anomalous flux ratios (Dalal & Kochanek, 2002; Metcalf et al., 2004). Whether this constitutes a serious disagreement with CDM predictions is unclear. Here we just notice that our simulation likely suffers the numerical “over-merging” problem below : if the mass spectrum of substructure we measure, , extended all the way down to , for example, then the mass fraction in subhalos with would be comparable to that in all higher mass satellites with identified in our run. We also have to expect some “over-merging” in the dense, inner halo: Via Lactea is able to resolve a few subhalos within 10 kpc of the galactic center (3 systems at ), but the true subhalo abundance might be significantly higher in this region.
4. Dark matter annihilation signal
Our simulation shows that, in the standard CDM paradigm, galactic halos should be filled with at least tens of thousands subhalos that have no optically luminous counterpart. If the dark matter is in the form of a supersymmetric particle produced in the early Universe like the neutralino, then substructure may be lit up by the annihilation of such particles into -rays. Since the annihilation rate is proportional to density squared, the predicted flux depends sensitively on the clumpiness of the mass distribution. 222Annihilation is too slow to alter the mass distribution on the scales simulated here. For an NFW subhalo it would erase the cusp only on scales smaller than a micro-parsec and this would not lower the total subhalo luminosity significantly. Within the Milky Way, nearby subhalos may be among the brightest sources of annihilation radiation, and could be detectable by the forthcoming Gamma-Ray Large Area Telescope (GLAST).
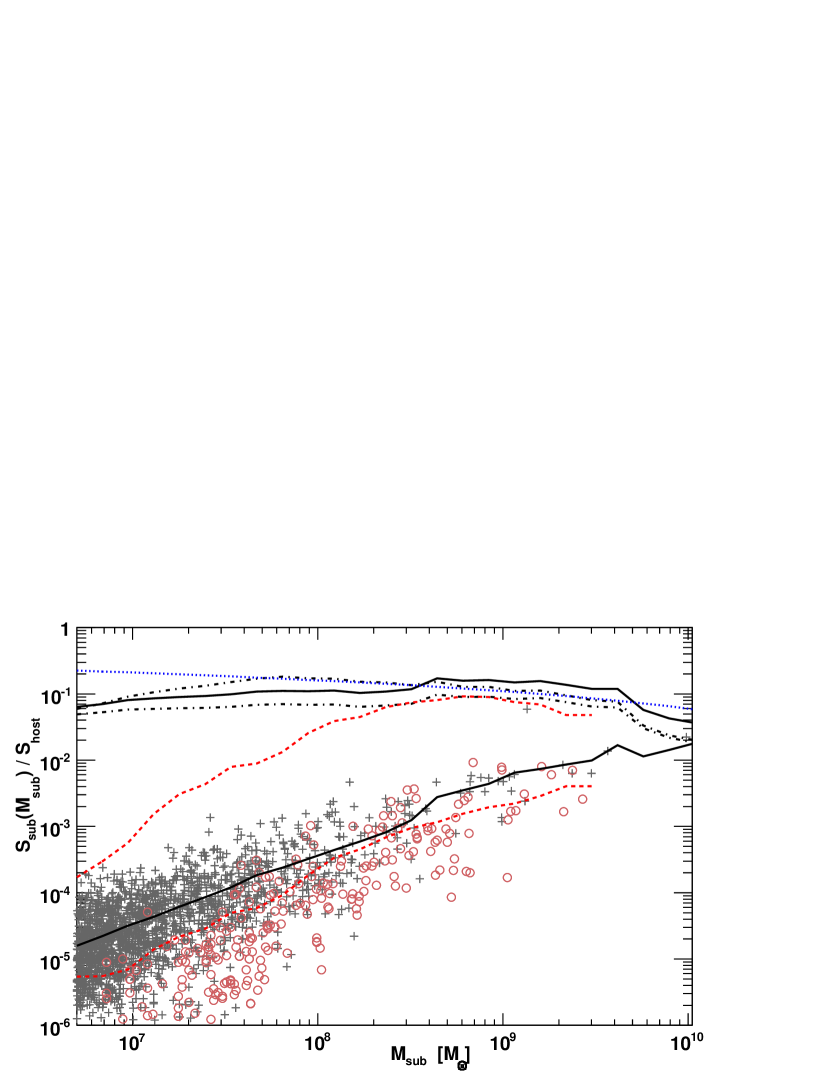
Annihilation luminosities based on densities measured directly in collisionless N-body simulations 333In this work we neglect the still somewhat unclear effects of galaxy formation on the inner dark matter density. Substantial gains are possible, e.g. the contracted NFW halo ”NFWc” in Mambrini et al. (2006), rescaled to match Via Lactea, gives an eight times larger host halo signal than the corresponding NFW profile before contraction. suggest that bound substructure may boost the signal from individual halos by only a small factor compared to a smooth spherical density profile (Stoehr et al., 2003; Diemand et al., 2006), and that the enhancenement is dominated by the most massive subhalos. The measured contribution of resolved substructure must be affected by numerical resolution, however, since higher resolution simulations would be able to resolve higher densities in subhalo centers (Kazantzidis et al., 2004). Indeed, analytic calculations tend to find larger substructure boost factors (Calcaneo-Roldan & Moore, 2000) and a signal that is dominated by small subhalos instead (Colafrancesco et al., 2006). In Figure 8 we show the mass dependence of the annihilation luminosity for individual subhalos in our two Milky Way simulations. The signal from the subhalo is proportional to
| (1) |
where is the density of the particle, and is the set of all particles belonging to halo . In the Via Lactea run we find , i.e. a signal-to-mass ratio that is approximately independent of mass. Given our substructure abundance of , this implies an annihilation luminosity that is approximately constant per decade of substructure mass, as the Figure shows.
*
A comparison with our lower resolution simulation indicates that more than 500 dark matter particle per subhalo are needed to produce a signal that is of the right order of magnitude. Below this scale (i.e. below about in Via Lactea and for the lower resolution run) the luminosity decreases quickly due to insufficient resolution.
To test the robustness of the above results we have tried two alternative ways to compute matter densities and annihilation luminosites besides the standard SPH-kernel. The first is based on densities measured in spherical bins around each subhalo, while the second uses NFW fits to these density profiles. All three methods agree with an approximately constant total signal per decade of substructure mass above a mass scale of 500 particles per subhalo. However, the spherical density profile estimate falls below the NFW estimate even for massive subhalos and the difference increases with decreasing subhalo mass. This is consistent with the result of Kazantzidis et al. (2004) that well resolved subhalos remain as cuspy as halos in the field, while under-resolved structures have relatively large, artificial constant density cores. Annihilation luminosities based on local SPH densities, on the other hand, are larger than the spherical signal for massive subhalos because of resolved sub-substructures, triaxiality, and other inhomogenities that get averaged out in the spherical estimates. Smaller subhalos, containing a few thousand particles, appear rather smooth and spherical and have a large artificial core. It is therefore not surprising that in this range the SPH estimate lies above the spherical density profile estimate, but below the NFW signals. Below about 3000 particles () the NFW total signal estimate decreases and approaches the other two estimates, presumably because it too starts to be affected by the finite resolution: with this low number of particles, halo density profiles are artificially flattened by numerical effects out to a radius of about (Diemand et al., 2004a). The scale radii of many subhalos would lie in the affected range and the resulting apparent scale radii of the NFW fits come out too large. This leads to underestimated scale densities and -ray luminosities. Above 3000 particles, the total signal estimate based on NFW fits hints at a contribution to the total signal that increases with decreasing subhalo mass in agreement with the analytic model by Colafrancesco et al. (2006).
At our highest resolution we measure a total neutralino -ray luminosity from the host halo that is a factor of 2 higher than the total spherically-averaged smooth signal: of this increase is associated with substructure, the other 59% is due to other deviations from spherical symmetry. At ten times lower resolution Stoehr et al. (2003) found an increase from subhalos of 25%, and in our 27 times lower resolution run we measure only a 12% increase. Since the subhalo signal appears to be dominated by the smaller clumps, both the total and the subhalo signal have not converged yet and might be much larger for a real CDM halo: assuming a constant boost factor of 0.17 per decade in subhalo mass from 444Micro-subhalos below appear to contribute little to the annihilation signal of their host (Diemand et al., 2006). to would give a total enhancement factor of 3, i.e. the substructure signal would be twice that of a smooth spherical host halo. Allowing the same boost for each of the subhalos (0.17 per decade from to ) in a self-similar manner, the total boost for a galaxy halo is approximately 13. A contribution that grows with decreasing subhalo mass is not excluded: Colafrancesco et al. (2006) found such a behavior using an analytic model with a subhalo mass function, subhalo concentrations proportional to those given for field halos in Bullock et al. (2001), and somewhat different cosmological parameters (, , , and ). Figure 8 shows that the results from the high resolution run are consistent with their mass dependence, especially after considering that numerical effects tend to reduce the substructure signal and that their importance is gradually growing with decreasing subhalo mass. Integrating over the Colafrancesco et al. (2006) model normalized to our result at large subhalo masses gives a boost factor of about 8. The increase due to sub-substructures adds another factor of about ten, it is more dramatic than in the constant S/M case. We plan to constrain this factor further by using analytic models based on the detailed subhalo and sub-subhalo properties in a future paper.
5. -rays from MW substructure
The Large Area Telescope (LAT) aboard the soon-to-be-launched GLAST satellite may be able to detect -rays from DM annihilations originating at the Galactic center (e.g. Mambrini et al. 2006), in a subhalo (e.g. Koushiappas et al. 2004) or even in a very nearby micro-subhalo (Koushiappas, 2006). The LAT has an effective area of more than 8000 cm2, a field of view greater than 2 steradian, and sub-degree angular resolution at energies greater than 1 GeV. GLAST is expected to operate for more than 5 years, and will conduct an all-sky survey during this time.
We have constructed all-sky maps of the expected annihilation -ray flux reaching a fiducial observer located 8 kpc from the center of the Milky Way halo. Each DM particle was assigned an annihilation -ray flux
| (2) |
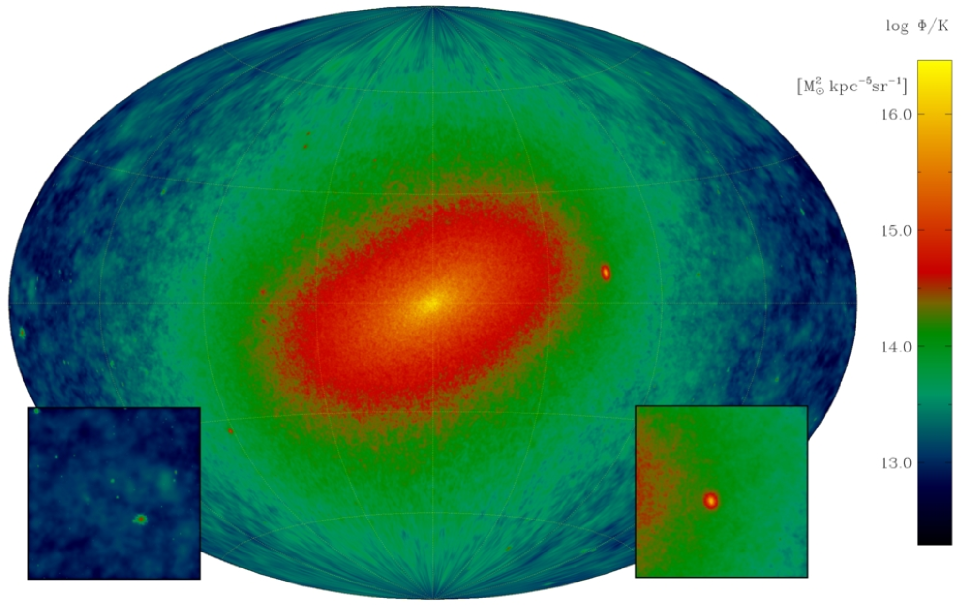
where is the distance from the observer to the particle. The constant of proportionality captures the uncertain particle physics and is equal to , where is the number of photons produced per annihilation, is the annihilation rate at zero temperature, and the restmass of the DM particle. In this work we consider only the dependence of the signal on the macroscopic DM density distribution, and present fluxes in units of , but for any given particle physics model our results can be converted to physical fluxes by multiplying by the appropriate . We also calculate the angular scale subtended by each DM particle, , where is defined to be half the radius that encloses the nearest 32 neighbors. We then bin up each particle’s contribution in angular bins (pixels) of size , typically chosen to be sr. Each particle contributes to all pixels within its angular scale, weighted by a projected SPH smoothing kernel. The weights are normalized such that the sum over all covered pixels equals the particle’s total flux . After binning all particles, we divide each pixel by , resulting in a map of flux per solid angle . This 2D image is mapped onto a Hammer-Aitoff equal area projection, with the coordinate system rotated such that the halo center lies at the center of the projection.
The image of Figure 9 depicts the resulting DM annihilation all-sky map. As expected the signal is strongest towards the center, with a flux about four orders of magnitude larger than the diffuse contribution from the anti-center. Several substructures are clearly visible, both towards the halo center and in the opposite direction (towards the edges of the image). The two insets show in greater detail a region around the anti-center and around the brightest subhalo. Because the diffuse background noise is strongest near the center due to Galactic continuum emission (Stoehr et al., 2003), it is likely that substructure will be more readily detectable at anti-center, and/or at higher latitudes.

Compared with the density squared projection in Figure 2 however, it is striking how little substructure is actually visible in the all-sky map. This is due to a number of causes. At 8 kpc () the observer is located relatively close to the halo center. The mean density at this distance is , and only 4009 of our subhalos have central densities greater than this. Of course this is largely a numerical effect, since subhalos are resolved with much fewer particles than the host. Assuming a universal density profile and higher subhalo concentrations, subhalos would be denser than their host halo at comparable . Moreover Via Lactea still resolves only 32 subhalos closer than 20 kpc from the observer. In our all-sky map distant subhalos are hard to detect because both their fluxes and angular sizes on the sky are reduced. In Figure 10 we have plotted cumulative distribution functions of and , as well as a scatter plot of the two quantities against each other. Here is the projected angular size of the subhalo’s tidal radius, is the total flux from all particles within each subhalo’s tidal radius, and is the flux from all pixels within of the Galactic center. We have only used subhalos within the host halo’s . The median angular size of all subhalos is , and only 5 subhalos have a flux greater than of the halo center. The brightest subhalo, at (longitude, latitude) , has . This subhalo has a mass of , a peak circular velocity of and lies at a distance of 31 kpc from the Galactic center. It is very unlikely that our Milky Way halo would contain such a massive DM subhalo so close to the center, since it would presumably host a dwarf galaxy 555This subhalo would host a dwarf galaxy according to both models discussed in Section 3.3.. The closest such object in the Local Group is the Small Magellanic Cloud, it has a comparable mass and velocity dispersion (Harris & Zaritsky, 2006), but lies at a distance of kpc. It would thus appear 1.7 times smaller and 2.8 times fainter than the brightest subhalo in Figure 9.
6. Conclusions
We have reported in this paper first results from the highest resolution simulation to date of Galactic DM substructure. Our simulation consists of over 200 million DM particles and follows the evolution and formation of a Milky Way-size halo with in a WMAP 3-year cosmology. Here we summarize our main results:
-
•
At the present epoch we resolve approximately 10,000 subhalos, about one order of magnitude more than in any previous simulation of a Milky Way halo. Our resolution is sufficient to even resolve a few subhalos within the solar circle. In several of our more massive subhalos we are able to identify sub-substructure.
-
•
The cumulative subhalo mass function is consistent with a power law down to (200 particles), implying an equal mass contribution per decade of subhalo mass. As such the total mass fraction in substructure is going to be resolution dependent, and our value of 5.3% is likely to be a lower limit. Extrapolating the subhalo mass function down to , for example, would lead to a substructure mass fraction of 20%. The fraction of surface mass density in resolved substructure within a projected distance of 10 kpc is 0.3%, again most likely an underestimate.
-
•
The cumulative subhalo velocity function is also well-fit by a power law: down to . We find 124 subhalos with peak circular velocities greater than , about one order of magnitude more than the number of dwarf satellite galaxies of comparable circular velocity. The lower and in the WMAP 3-year cosmology do not appreciably alleviate this “missing satellite problem”. Furthermore we report a new “inner missing satellite problem” concerning the inner 10% of . Whereas previous simulations have found this region to be practically smooth, our simulation reveals the presence of 5 subhalos with and distances less than 39 kpc, compared to only one known Milky Way satellite, Sagittarius at kpc (Mateo, 1998). A preliminary analysis suggests that this number of inner satellites is consistent with models in which dwarf galaxy formation is limited to subhalos sufficiently massive (Kravtsov et al., 2004) or forming in rare density peaks selected at (Moore et al., 2006).
-
•
The total DM annihilation luminosity of our simulated halo is a factor of 2 larger than the luminosity derived from a smooth spherically averaged density profile. 41% of this increase is due to resolved substructure and the remaining 59% can be attributed to other deviations from spherical symmetry. The luminosity of individual subhalos is linearly proportional to their mass, which together with the mass function implies an equal contribution to the total subhalo luminosity from each decade in subhalo mass. Just like the total subhalo mass fraction, the total subhalo annihilation luminosity fraction is thus limited by numerical resolution. An extrapolation down to would result in a factor of 3 increase in luminosity. Significantly larger factors due to a signal per subhalo mass decade which rises slowly with decreasing mass and/or similar gains within subhalos due to sub-subhalos cannot be excluded.
-
•
We have constructed an all-sky map of the expected annihilation -ray flux reaching a fiducial observer at 8.0 kpc. The signal is strongest in the center and falls off by about 4 orders of magnitude towards the anticenter. With our finite numerical resolution only a small number of subhalos are bright enough to be visible against the background from the smooth density field surrounding the observer. We expect actual physical DM subhalos to have higher central densities, making them more luminous and possibly detectable in regions sufficiently far from the center. The brightest subhalo in our simulation has a mass comparable to the SMC, is located 30 kpc from the center, and has a flux equal to 10% of the flux from the central .
References
- Amara et al. (2006) Amara, A., Metcalf, R. B., Cox, T. J., & Ostriker, J. P. 2006, MNRAS, 367, 1367
- Bergstrom et al. (1999) Bergstrom, L., Edsjo, J., Gondolo, P., & Ullio, P. 1999, PhRvD, 59, 043506
- Bertschinger (2001) Bertschinger, E. 2001, ApJSS, 137, 1
- Bradac et al. (2004) Bradac, M., Schneider, P., Lombardi, M., Steinmetz, M., Koopmans, L. V. E., & Navarro, J. F. 2004, A&A, 423, 797
- Bullock et al. (2000) Bullock, J. S., Kravtsov, A. V., & Weinberg, D. H. 2000, ApJ, 539, 517
- Bullock et al. (2001) Bullock, J. S., et al. 2001, MNRAS, 321, 559
- Calcaneo-Roldan & Moore (2000) Calcaneo-Roldan, C., & Moore, B. 2000, PhRvD, 62, 123005
- Colafrancesco et al. (2006) Colafrancesco, S., Profumo, S., & Ullio, P. 2006, A&A, 455, 21
- Chiba (2002) Chiba, M. 2002, ApJ, 565, 17
- Dalal & Kochanek (2002) Dalal, N., & Kochanek, C. S. 2002, ApJ, 572, 25
- Diemand et al. (2004a) Diemand, J., Moore, B., & Stadel, J. 2004, MNRAS, 353, 624
- Diemand et al. (2004b) Diemand, J., Moore, B., & Stadel, J. 2004, MNRAS, 352, 535
- Diemand et al. (2005) Diemand, J., Zemp, M., Moore, B., Stadel, J., & Carollo, M. 2005, MNRAS, 364, 665
- Diemand et al. (2006) Diemand, J., Kuhlen, M., & Madau, P. 2006, ApJ, in press (astro-ph/0603250)
- Gao et al. (2005) Gao, L., White, S. D. M., Jenkins, A., Frenk, C. S., & Springel, V. 2005, MNRAS, 363, 379
- Harris & Zaritsky (2006) Harris, J., & Zaritsky, D. 2006, AJ, 131, 2514
- Ibata et al. (2002) Ibata, R. A., Lewis, G. F., Irwin, M. J., & Quinn, T. 2002, MNRAS, 332, 915
- Kamionkowski & Liddle (2000) Kamionkowski, M., & Liddle, A. R. 2000, PhRvL, 84, 4525
- Kazantzidis et al. (2004) Kazantzidis, S., Mayer, L., Mastropietro, C., Diemand, J., Stadel, J.,& Moore B. 2004, ApJ, 608, 663
- Kleyna et al. (2005) Kleyna, J. T., Wilkinson, M. I., Evans, N. W., & Gilmore, G. 2005, ApJ, 630, L141
- Klypin et al. (1999) Klypin, A. A., Kravtsov, A. V., Valenzuela, O.,& Prada F. 1999, ApJ, 522, 82
- Koushiappas et al. (2004) Koushiappas, S. M., Zentner, A. R., & Walker, T. P. 2004, Phys.Rev. D, 69, 043501
- Koushiappas (2006) Koushiappas, S. M. 2006, ArXiv Astrophysics e-prints, arXiv:astro-ph/0606208
- Kravtsov et al. (2004) Kravtsov, A. V., Gnedin, O. Y., & Klypin, A. A. 2004, ApJ, 609, 482
- Maccio et al. (2006) Maccio, A., Moore, B., Stadel, J. Diemand, J. 2006, MNRAS, 366, 1529
- Mambrini et al. (2006) Mambrini, Y., Muñoz, C., Nezri, E., & Prada, F. 2006, JCAP, 1, 10
- Mao et al. (2004) Mao, S., Jing, Y., Ostriker, J. P., & Weller, J. 2004, ApJ, 604, L5
- Mao & Schneider (1998) Mao, S., & Schneider, P. 1998, MNRAS, 295, 587
- Mateo (1998) Mateo, M. L. 1998, ARA&A, 36, 435
- Mayer et al. (2002) Mayer, L., Moore, B., Quinn, T., Governato, F., & Stadel, J. 2002, MNRAS, 336, 199
- Metcalf & Madau (2001) Metcalf, R. B., & Madau, P. 2001, ApJ, 563, 9
- Metcalf et al. (2004) Metcalf, R. B., Moustakas, L. A., Bunker, A. J., & Parry, Ian R. 2004, ApJ, 607, 43
- Metcalf & Zhao (2002) Metcalf, R. B., & Zhao, H.-S. 2002, ApJ, 567, L5
- Moore et al. (2006) Moore, B., Diemand, J., Madau, P., Zemp, M., & Stadel, J. 2006, MNRAS, 368, 563
- Moore et al. (2001) Moore, B., Calcáneo-Roldán, C., Stadel, J., Quinn, T., Lake, G., Ghigna, S., & Governato, F. 2001, PRD, 64, 063508
- Moore et al. (1999) Moore, B., Ghigna, S., Governato, F., Lake, G., Quinn, T., Stadel, J., & Tozzi, P. 1999, ApJ, 524, L19
- Navarro et al. (1997) Navarro, J. F., Frenk, C. S., & White, S. D. M. 1997, ApJ, 490, 493
- Oda et al. (2005) Oda, T., Totani, T., & Nagashima, M. 2005, ApJ, 633, L65
- Reed et al. (2005) Reed, D., Governato, F., Quinn, T., Gardner, J., Stadel, J., & Lake, G. 2005, MNRAS, 359, 1537
- Somerville (2002) Somerville, R. S. 2002, ApJ, 572, L23
- Stoehr et al. (2003) Stoehr, F., White, S. D. M., Springel, V., Tormen, G., & Yoshida, N. 2003, MNRAS, 345, 1313
- Spergel et al. (2006) Spergel, D. N., et al. 2006, ApJ, submitted (astro-ph/0603449)
- Stadel (2001) Stadel, J. 2001, PhD thesis, U. Washington
- van den Bergh (2006) van den Bergh, S. 2006, AJ, in press (astro-ph/0607092)
- Wadsley, Stadel & Quinn (2004) Wadsley, J. W., Stadel, J., & Quinn, T. 2004, NewA., 9, 137
- Willman et al. (2005) Willman, B., et al. 2005, ApJ, 626, L85
- Zemp et al. (2006) Zemp, M., Stadel, J., Moore, B., & Carollo, C. M. 2006, MNRAS, submitted (astro-ph/0606589)
- Zentner & Bullock (2003) Zentner, A. R., & Bullock, J. S. 2003, ApJ, 598, 49