PPAK Integral Field Spectroscopy survey of the Orion Nebula
Abstract
Aims. We present a low-resolution spectroscopic survey of the Orion nebula. The data are released for public use. We show the possible applications of this dataset analyzing some of the main properties of the nebula.
Methods. We perform an integral field spectroscopy mosaic of an area of 56 centered on the Trapezium region of the nebula, including the ionization front to the south-east. Analysis of the line fluxes and line ratios of both the individual and integrated spectra allowed us to determine the main characteristics of the ionization throughtout the nebula.
Results. The final dataset comprises 8182 individual spectra, sampled in a circular area of 2.7 diameter. The data can be downloaded as a single row-stacked spectra fitsfile plus a position table or as an interpolated datacube with a final sampling of 1.5/pixel. The integrated spectrum across the field-of-view was used to obtain the main integrated properties of the nebula, including the electron density and temperature, the dust extinction, the H integrated flux (after correcting for dust reddening), and the main diagnostic line ratios. The individual spectra were used to obtain line intensity maps of the different detected lines. These maps were used to study the distribution of the ionized hydrogen, the dust extinction, the electron density and temperature, and the helium and oxygen abundance. All of them show a considerable degree of structure as already shown in previous studies. In particular, there is a tight relation between the helium and oxygen abundances and the ionization structure that cannot be explained by case B recombination theory. Simple arguments like partial ionization and dust mixed with the emitting gas may explain these relations. However a more detailed modeling is required, for which we provide the dataset.
Key Words.:
ISM: individual objects: M42 – (ISM:) HII regions – (ISM:) dust, extinction – ISM: abundances1 Introduction
The Orion nebula is the brightest and best studied HII region in the sky. It has been used for decades as a fundamental laboratory in the study of the star formation regions, ionization processes and helium and heavy element enrichment. However, despite the large number of studies on this target much remains unknown about it, even from optical studies. The more we know, the more complex it seems to be.
Several spectroscopic surveys have tried to characterize its spectroscopic properties, taking spectra at different “representative” locations (e.g., Kaler (1976); Baldwin et al. (1991); Esteban et al. (1998); Esteban et al. (2004)). In particular, Osterbrock et al. (1990) and Osterbrock et al. (1992) presented a compilation of high and low dispersion deep spectra of the central bright region in the optical-NIR region (3000-11000Å). They measured 225 emission lines, 88 at the wavelength range of our IFS data. Using the relative intensities of these lines they derived the relative abundances of several elements, the electron temperature (T=9000 K) and density (=4103 cm-3), and the extinction (1.08 mag, derived from the H/H ratio). Such properties are frequently compared with those of distant H II regions in our Galaxy and extragalactic ones (e.g., Pagel et al. (1992); Ferland (2001)). Due to their distance most of these regions are poorly resolved. However their integrated properties are compared with those of particular resolved areas in the Orion nebula.
Very little effort has been made to study the distribution of physical properties across the nebula, except for some particular areas (e.g.Baldwin et al. (1991)), or their integrated values in large aperture areas. Pogge et al. (1992) performed Fabry-Perot (FP) imaging spectrosphotometry on an area of 66 centered in the Trapezium. Their FP data covered the brightest emission lines in the nebula: H, [OIII]5007, H, [NII] 6548,6583, [SII]6716,6731 and HeI6678. They derived some of the average spectroscopic parameters of the core of the nebula, including the integrated H flux, the average extinction, the average ionization line ratios ([OIII]/H, [NII]/H and [SII]/H), the He+/H+ ionic abundance ratio, and the average electron density. They derived the first realiable maps of the distribution of these properties across the nebula, which show a considerable degree of structure. They found significant differences with some of the previously reported values that correspond to particular regions in the nebula (e.g., Osterbrock et al. 1992). However, due to the reduced spectroscopic coverage of their dataset it was not possible to fully characterize the ionization conditions in the nebula.
We present here a low-resolution Integral Field Spectroscopy (IFS) survey of a similar field-of-view of the FP observations presented by Pogge et al. (1992), but covering the entire optical wavelength range (3700-7100 Å). The data are obtained, reduced and released for the community. In this article we describe the observations and data reduction, indicating the main characteristics of the dataset, and we show a few examples of the applications of this dataset. To our knowledge this is the largest area ever sampled with an IFS unit, showing the capabilities of new tecniques like 3D mosaicing to overcome the inherent reduced field-of-view of these instruments.
The layout of this article is as follow: In Section 2 we describe the observations and data reduction. Section 3 summarizes the basic properties of the dataset. In Section 4 we list examples of the applications of this dataset, including the integrated properties of the nebula, the description of the line intensity maps of some of the brightest emission lines, a distribution of the electron density and temperature, a study of the dust extinction, a description of the ionization structure, and a study of the helium and heavy element abundances. Section 5 summarizes the conclusions of the article.
2 Observations and data reduction
Observations were carried out on November 21st, 2004 at the 3.5m telescope of the Calar Alto observatory with the Potsdam MultiAperture Spectrograph, PMAS, (Roth et al. (2005)) in the PPAK mode (Verheijen et al. (2004); Kelz et al. (2006)). The V300 grating was used, covering a wavelength range between 3700-7100 Å with a resolution of 10 Å FWHM, corresponding to 600 km s-1, much larger than the internal velocities within the nebula. The PPAK fiber bundle consists of 382 fibers of 2.7” diameter each (see Fig.5 in Kelz et al. 2006). Of them, 331 fibers (the science fibers) are concentrated in a single hexagonal bundle covering a field-of-view of 72”64”, with a filling factor of 65%. The sky is sampled by 36 additional fibers, distributed in 6 bundles of 6 fibers each, located following a circular distribution at 90” of the center and at the edges of the central hexagon. The sky-fibers are distributed among the science ones in the pseudo-slit, in order to have a good characterization of the sky. The remaining 15 fibers are used for calibration purposes, as described below.
The data were taken as a backup program of the “Disk Mass Project” (Verheijen et al. (2004)) under bad transparency and non photometric conditions. A mosaic of 27 single exposures of 2s each was taken. The exposure time was selected to avoid saturation of the brightest emission lines, like H and [OIII]. The initial exposure was centered in the Trapezium area of the Orion Nebula. Consecutive pointings followed a hexagonal pattern, adjusting the mosaic pointings to the shape of the PPAK science bundle. Each pointing center lies at 60” from the previous one. Due to the shape of the PPAK bundle and by construction of the mosaic, 11 spectra of each pointing, corresponding to one edge of the hexagon, overlap with the same number of spectra from the previous pointing. This pattern was selected to maximize the covered area, allowing enough overlapping to match the different exposures taken under variable atmospheric conditions. The offset procedure was carried out until closing due to risk of rain. The complete mosaic was completed in 1.5 hours in total, mostly due to the readout time of the PMAS CCD camera (1.5 min in the setup used).
| Wavelength | Wavelength | Flux1 | Line Id. | Wavelength | Wavelength | Flux | Line Id. |
|---|---|---|---|---|---|---|---|
| Lab. (Å) | Obs. (Å) | Lab. (Å) | Obs. (Å) | ||||
| 3726.03∗ | 3724.94 | 35219.70 | [OII] | 5006.84∗ | 5006.99 | 143002.31 | [OIII] |
| 3728.82∗ | 3730.08 | 40670.09 | [OII] | 5056.02 | 5055.80 | 35.09 | SiII |
| 3750.15 | 3751.09 | 676.63 | H12 | 5056.35 | 5056.35 | 39.79 | SiII |
| 3770.63 | 3771.25 | 1574.32 | H11 | 5158.81 | 5157.92 | 52.29 | [FeII] |
| 3797.90 | 3798.18 | 2550.31 | H10 | 5197.90 | 5195.79 | 25.86 | [NI] |
| 3819.64 | 3819.54 | 876.94 | HeI3819 | 5199.00 | 5199.49 | 76.77 | SKY_NI |
| 3835.39 | 3835.15 | 3391.71 | H9 | 5200.26 | 5201.02 | 142.51 | [NI] |
| 3857.53 | 3853.55 | 561.27 | HeI | 5270.40 | 5270.64 | 171.06 | [FeIII] |
| 3868.75 | 3868.59 | 8266.59 | [NeIII] | 5360.00 | 5359.94 | 6.06 | SKY? |
| 3888.65 | 3887.97 | 4416.27 | HeI | 5461.00 | 5461.07 | 215.29 | SKY_HgI |
| 3889.05 | 3890.22 | 3957.53 | H8 | 5517.71 | 5517.71 | 284.96 | [ClIII] |
| 3964.73 | 3967.69 | 3634.16 | HeI | 5537.88 | 5537.89 | 281.24 | [ClIII] |
| 3967.46 | 3968.09 | 642.14 | [NeIII] | 5577.00 | 5576.40 | 789.97 | SKY_OI |
| 3970.07 | 3969.20 | 5478.41 | H | 5577.31 | 5578.10 | 791.73 | [OI] |
| 4009.27 | 4007.41 | 318.24 | HeI | 5685.00 | 5684.97 | 118.17 | SKY_NaI |
| 4026.21 | 4026.00 | 722.02 | HeI | 5754.64∗ | 5754.66 | 400.01 | [NII] |
| 4046.00 | 4046.02 | 32.09 | SKY_HgI | 5770.00 | 5769.91 | 15.66 | SKY? |
| 4068.60 | 4068.39 | 458.02 | [SII] | 5790.00 | 5790.04 | 1.16 | SKY? |
| 4076.35 | 4074.88 | 159.72 | [SII] | 5875.62 | 5875.56 | 7538.90 | HeI |
| 4101.74 | 4101.56 | 12021.26 | H | 5893.00 | 5892.61 | 348.91 | SKY_NaI D |
| 4120.86 | 4121.23 | 53.23 | HeI | 5930.00 | 5927.95 | 123.02 | SKY? |
| 4143.76 | 4148.23 | 23.02 | HeI | 5957.61 | 5957.11 | 41.97 | SiII |
| 4267.15 | 4265.12 | 85.48 | CII | 5958.58 | 5957.49 | 12.78 | OI |
| 4340.47 | 4340.32 | 23860.65 | H | 5978.97 | 5978.80 | 81.35 | SiII |
| 4358.00 | 4364.15 | 113.00 | SKY_HgI | 6000.00 | 6000.26 | 12.91 | SKY? |
| 4363.21∗ | 4366.76 | 831.27 | [OIII] | 6046.40 | 6046.57 | 41.92 | OI |
| 4387.93 | 4379.43 | 125.13 | HeI | 6240.00 | 6239.95 | 60.97 | SKY? |
| 4414.91 | 4471.37 | 1937.47 | OII | 6265.00 | 6264.91 | 30.67 | SKY? |
| 4416.98 | 4418.47 | 62.93 | OII | 6300.00 | 6299.33 | 297.01 | SKY_OI |
| 4471.50 | 4412.41 | 97.99 | HeI | 6300.30 | 6301.39 | 362.98 | [OI] |
| 4658.10 | 4658.22 | 379.59 | [FeIII] | 6312.10 | 6312.27 | 950.13 | [SIII] |
| 4701.62 | 4701.26 | 123.43 | [FeIII] | 6330.00 | 6329.99 | 46.28 | SKY? |
| 4713.20 | 4713.36 | 279.38 | HeI | 6347.09 | 6347.30 | 141.11 | SiII |
| 4733.93 | 4735.80 | 40.15 | [FeIII] | 6363.78 | 6363.72 | 208.24 | [OI] |
| 4754.83 | 4755.52 | 62.28 | [FeIII] | 6370.36 | 6370.53 | 107.90 | SiII |
| 4769.60 | 4775.10 | 62.48 | [FeIII] | 6548.03∗ | 6547.63 | 10743.11 | [NII] |
| 4777.88 | 4783.04 | 29.99 | [FeIII] | 6562.82∗ | 6562.87 | 171573.70 | H |
| 4815.55 | 4815.82 | 82.38 | [FeII] | 6583.41∗ | 6583.52 | 32494.66 | [NII] |
| 4861.33∗ | 4861.41 | 50768.69 | H | 6678.15∗ | 6678.37 | 1907.79 | HeI6678 |
| 4921.93 | 4922.20 | 201.94 | HeI | 6716.39 | 6716.47∗ | 2354.08 | [SII] |
| 4958.91∗ | 4959.02 | 47337.07 | [OIII] | 6730.85∗ | 6731.27 | 3447.13 | [SII] |
1 10-11 Erg cm-2 s-1
∗ Emission line used in our analysis of the data.
Data reduction was performed using R3D (Sánchez (2006)), in combination with IRAF packages (Tody (1993))111IRAF is distributed by the National Optical Astronomy Observatories, which are operated by the Association of Universities for Research in Astronomy, Inc., under cooperative agreement with the National Science Foundation. and E3D (Sánchez (2004)). The reduction consists of the standard steps for fiber-based integral-field spectroscopy. A master bias frame was created by averaging all the bias frames observed during the night and subtracted from the science frames. The location of the spectra in the CCD was determined using a continuum illuminated exposure taken before the science exposures. Each spectrum was extracted from the science frames by coadding the flux within an aperture of 5 pixels around this location along the cross-dispersion axis for each pixel in the dispersion axis and stored in a row-staked-spectrum file RSS (Sánchez (2004)). Wavelength calibration was performed using a He lamp exposure obtained from archive data, and corrected for distortions using ThAr exposures obtained simultaneously to the science exposures through the calibration fibers (indicated above). Differences in the fiber-to-fiber transmission throughput were corrected by comparing the wavelength-calibrated RSS science frames with the corresponding continuum illuminated ones. The nature of the dataset prevents us from performing any sky subtraction. However, due to the strength of the detected emission lines and the short exposure time, sky contamination is not an important issue for most of the foreseeable science cases.
Since the data were taken under bad weather conditions, no attempt was made to perform a flux calibration on the basis of the standard stars observed during the night. On the contrary, flux calibration was performed following a two-step procedure. First, we carried out a flux calibration using a standard star observed with a similar instrumental setup on a previous night. This procedure corrects, to a first order, for the instrumental transmission. Then, we used multi-band photometric data available in the literature for the brightest star in the Trapezium, Ori C (Lee (1968); Vitrichenko (2000)) to perform an absolute flux calibration by comparing with the un-calibrated spectrum of this object extracted from the central pointing of the mosaic. An additional correction was performed to take into account flux loses in the un-calibrated spectrum of the object due to differential atmospheric refraction. This correction was determined by comparing the emission line intensities with those derived by Baldwin et al. (1991) in the spatial region (O’Dell, private communications). This procedure ensures a flux calibration and sky extinction correction of this central pointing.
After reducing each individual pointing we built a single RSS file for the mosaic following an iterative procedure. The spectra of each pointing was scaled to those of the previous one by the average ratio of the emission of H in the overlapping spectra. To address the possible variable extinction during the observations, the average ratio between these scaled spectra and the previous ones was determined. We fitted this wavelength-dependent ratio to a low order polynomial function and divided all the spectra in the new pointing by the resulting wavelength dependent scale. In most of the cases this second correction has little effect on the data, indicating that the sky extinction did not change too strongly during the observations, prehaps because they comprise only a limited amount of time (1.5h). The overlapping spectra were then replaced by the average between the previous pointing and the new rescaled spectra. The resulting spectra were included in the final RSS file, updating the corresponding position table. The process starts in the central pointing, that is flux calibrated and sky extinction corrected as explained before, ensuring an homogeneous flux calibration and sky extinction correction for all the dataset. The procedure was repeated until the last pointing was included, ending with a final set of 8182 individual spectra and its corresponding position table. In addition , we created a datacube with 1.5”/pixel sampling by interpolating this RSS frame using E3D (Sánchez (2004)).
3 Results
The final data set consists of 8182 flux calibrated spectra sampling a circular area of 2.7 diameter each and covering a contiguous field-of-view of 56 centered approximately on the Trapezium area of the Orion nebula. Each spectrum covers the wavelength range between 3700-7100 Å, which includes the most prominent recombination and collisionally excited emission lines, from [OII]3727,3729 to [SII]6716,6731 (see Table 1). Near the lower wavelength range, the [OII] flux was measured without problem in all fibers. The faintest detected emission lines, up to 5, in the individual spectra have surface brightness of the order of 10-14 erg s-1 cm-2 arcsec-2. It is out of the scope of this article to extract all the information potentially available in this huge dataset. We consider here a few relevant properties of the Orion nebula using these data. Howeverm we are releasing the full dataset in order to make if freely available to the community on the project webpage 222http://www.caha.es/sanchez/orion/.
4 Applications
4.1 Integrated properties of the Nebula
In this section we describe some of the more interesting spectroscopic properties of the nebula derived by analyzing the integrated spectrum over the full field-of-view of our IFS dataset. Contrary to previous studies that attempt to describe the average ionization conditions in the nebula by analyzing individual spectra taken at different locations, we could, for the first time, describe the real average spectroscopic parameters.
4.1.1 Integrated spectrum of the Nebula
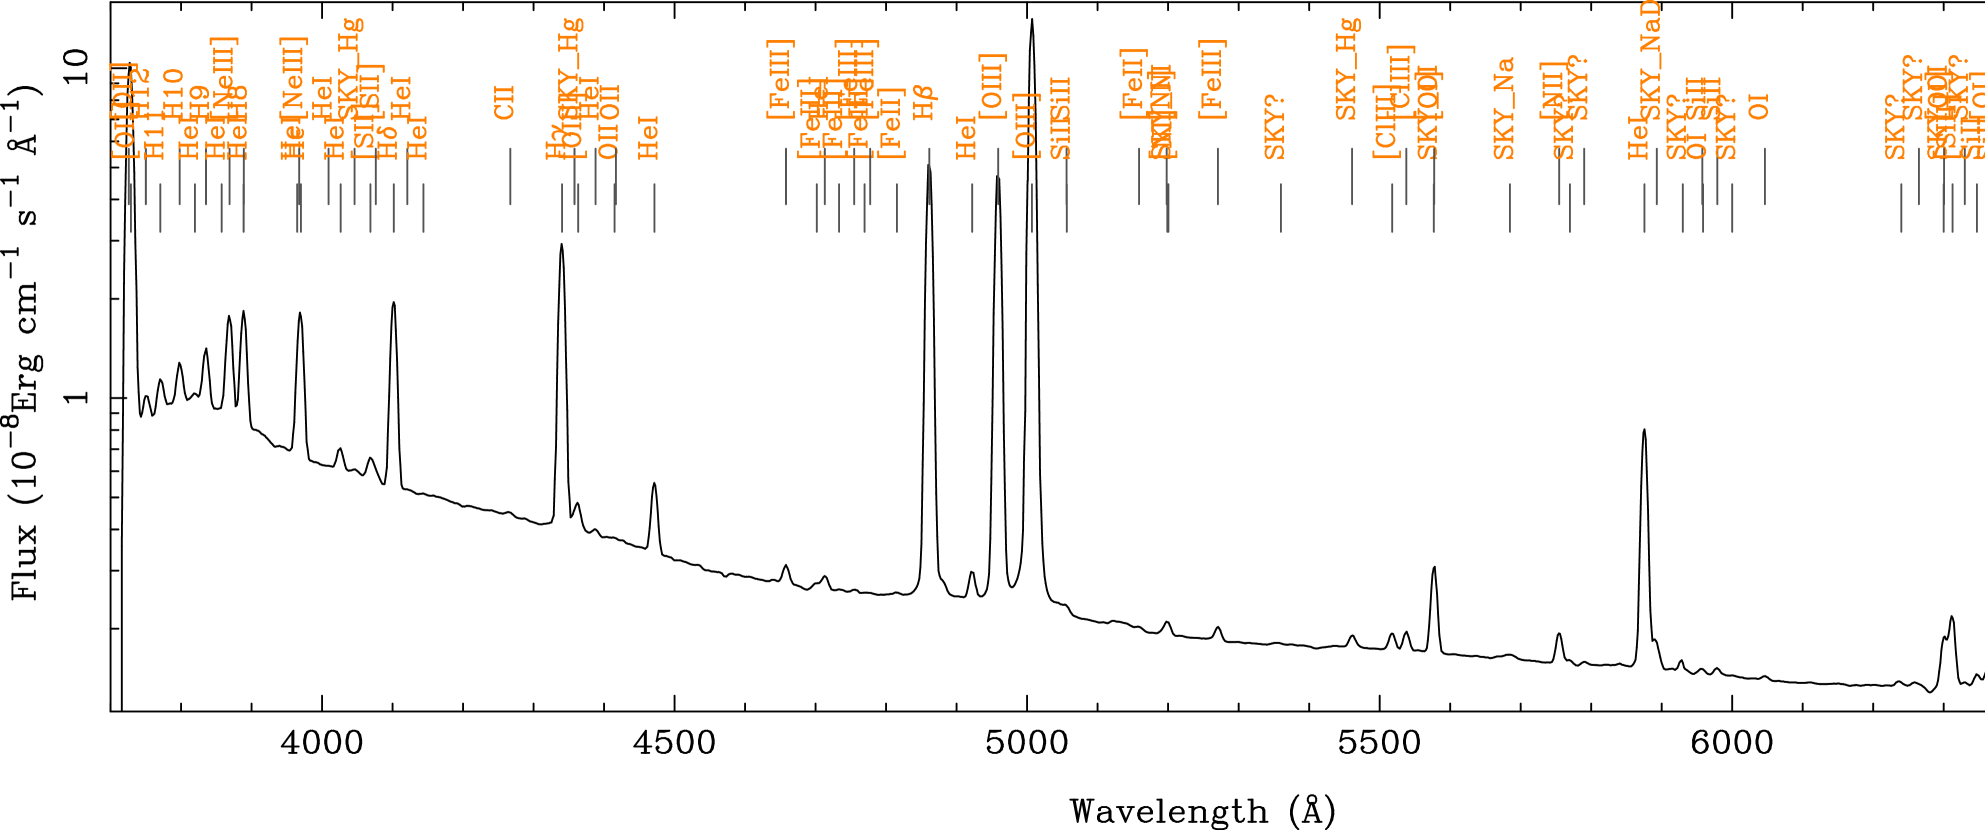
Figure 1 shows the integrated spectrum of the Orion Nebula obtained by coadding the 8281 individual spectra of our IFS dataset, plotted on a logarithmic scale. 82 emission lines are detected in the integrated spectrum. They were identified using the list of 88 emission lines detected by Osterbrock et al. (1992) using deep spectroscopy in the same wavelength range, in combination with the list of known sky emission lines at Calar Alto (Sánchez, in prep.). The observed wavelength and integrated flux of each emission line were measured using FIT3D (Sánchez et al. (2006)), removing the background continuum and deblending different emission lines when needed (and possible). Table 1 lists the detected emission lines, including, for each line, the laboratory wavelength (Osterbrock et al. (1992)), the observed wavelength, the integrated measured flux and the line identification. The final effective resolution of our integrated spectrum was FWHM10Å, measured in the brightest detected lines. Therefore, any emission line at distances less than 3Å from its adjacent neighbors is blended, and the listed integrated flux must be taken with care.
There is a considerable amount of blue continuum emission in the integrated spectrum shown in Fig. 1, whose intensity level ranges from 10-8 erg com-2 s-1 Å-1 in the ultraviolet to a few 10-9 erg com-2 s-1 Å-1 in the reddest wavelength ranges. This continuum is partially due to the stars sampled by our IFS data, in particular the bright members of the Trapezium. However, it is well known (e.g., Pogge et al. 1992) that the Orion nebula presents a diffuse continuum emission, whose origin is associated with the light from the stars within the ionized gas that is scattered by dust. Unfortunally, the measured continuum is strongly affected by the fact that we could not subtract the sky emission. Therefore this issue cannot be addressed propertly with the current IFS data.
4.1.2 Average dust extinction
The H I Balmer series are normally used to determine the extinction. One must compare the observed line ratios with the expected theoretical values. These lines are known to be emitted as a consequence of recombination, and the theory for them has been worked out in considerable detail (Hummer & Storey (1987); Osterbrock (1989)). Case B (optically thick in all the Lyman lines) is the best simple approximation to describe the real physical conditions in the ionization of the gas in the Orion nebula (Osterbrock (1988); Osterbrock et al. (1992); Ferland (2001)). The main deviation of the real nebula from the theory is probably the absorption of Lyman-line photons by dust mixed with the emitting gas, whose observable effects are at the level of a few percent in the H/H ratio (Cota & Ferland (1988); Baldwin et al. (1991)). Table 2 lists the observed and expected ratios between the H I Balmer series lines listed in Table 1. They show a good agreement within the errors, particularly the ratio for the 5 brightest emission lines (whose errors are estimated to be lower than 10%), indicating the presence of little dust extinction on average.
An average extinction of =0.75 mag is found assuming an intrinsic value of H/H=2.86, corresponding to case B recombination for T=9000 K (Hummer & Storey (1987); Pogge et al. (1992); Osterbrock et al. (1992)), and using the Orion extinction law of Cardelli, Clayton & Mathis (1989), with a ratio of total to selective extinction of 5.5 (Mathis et al. (1981)). This average extinction is smaller than the value reported by Pogge et al. (1992). However, a detailed comparison of the field-of-view covered by their FP data and our IFS ones shows that their data are approximately centered 60 more towards the east, covering a larger area of the Orion “Dark Bay”, an area with dust extinctions up to 2 mag. There are better line ratios to estimate the extinction (Osterbrock et al. (1992)), since, as we noted before, the intrinsic H/H ratio in the real nebula is a few percent smaller than the case B value (e.g, Baldwin et al. (1991)). We will discuss its effect in further sections.
| Line ratio | Obs. Value | Exp. Value |
|---|---|---|
| H/H | 3.380 | 2.86 |
| H/H | 0.470 | 0.486 |
| H/H | 0.237 | 0.259 |
| H/H∗ | 0.108 | 0.159 |
| H8/H∗∗ | 0.078 | 0.105 |
| H9/H | 0.067 | 0.0731 |
| H10/H | 0.050 | 0.0530 |
| H11/H | 0.031 | 0.0398 |
| H12/H | 0.013 | 0.0307 |
∗ Blended with [NeIII]
∗∗ Blended with HeI
4.1.3 Average electron density and temperature
The electron density, , in the S+ zone of the nebula can be estimated using the observed [SII]6716,6731 doublet ratio (Osterbrock (1989)). The estimated [SII]6716/[SII]6731 ratio based on the integrated spectrum is 0.683, that can be converted to an electron density, . Although mild, this conversion shows a dependency with the electronic temperature (, Osterbrock (1989)). Many previous spectroscopic studies sampling the Orion nebula at different locations reported a range of temperatures between 8000-10000 K (e.g., Osterbrock et al. (1992)). Therefore, the measured ratio could correspond to electron densities in a range between 2000-4000 cm-3. Pogge et al. (1992) reported an average [SII]6716/[SII]6731 ratio of 0.680, similar to our measurement. However, since their FP data did not cover any of the usual temperature indicators, they converted it to an electron density of 2150 cm-3 assuming an average temperature of 9000 K (Baldwin et al. (1991)). Our IFS spectroscopic data do cover at least two of the classical indicators with enough signal-to-noise, the [OIII] ratio:
and the [NII] ratio:
Both ratios are remarkably similar to the values reported by Osterbrock et al. (1992), for the center of the Nebula, despite the evident variable conditions of the ionization across the nebula.
The conversion between both ratios and the temperature, , depends on (Osterbrock (1989)). Therefore, it is possible to derive the temperature using both ratios and the ratio between the [SII] doublet. Once the temperature is obtained, it is possible to derive the electron density too. We found an electronic density of 2104 cm-3 (2019 cm-3) and a temperature of =9682 K (=8922 K) for the [OIII] ([NII]) ratio. To derive the electron density from the [SII] lines ratio and the temperature derived from the [OIII] lines ratios (T3), we transformed this temperature to T2 using the relation between both quantities presented by Pilyugin et al. (2006). Since the [OIII]4363 may be affected by an unsubtracted night sky HgI emission line at =4358Å we consider the estimation based on the [NII] ratio more reliable. Although the lines were not corrected by extinction, its effect on the derived temperature is negligible (even for 2 mag). The average oxygen abundance, 12+log(O/H) 8.6, derived from the fluxes of the integrated spectrum quoted in Table 1 is close to the solar value.
4.1.4 Average ionization conditions
It is widely accepted that the ionization of the Orion nebula is dominated by photoionization by the star Ori C. The derived values for the classical diagnostic line ratios, [OIII]5007/H=2.82, [NII]6583/H=0.19 and [SII]6716+31/H=0.034, are consistent with this picture, being the typical values for H II regions ionized by OB stars (Osterbrock (1989)). As already noticed by Pogge et al. (1992), the integrated H luminosity, 7.61037 erg s-1 (extinction corrected), and the electron density indicate too that Orion is a rather dense, low-luminosity H II region (Kennicutt et al. (1989)). Indeed, this H luminosity agrees with the nebula ionization dominated by a single O 5 star (Pogge et al. (1992); Hummer & Storey (1987)). A summary of the average properties of the nebula derived from our integrated spectrum is listed in Table 3.
| Parameter | Value |
|---|---|
| 0.75 (mag) | |
| 2019 (cm-3) | |
| T | 8922 (K) |
| OIII5007/H | 2.820 |
| NII6583/H | 0.190 |
| SII6716+31/H | 0.034 |
∗ Electron temperature derived from double ionized ions, like N++, using the formulae described in Osterbrock (1989).
4.2 Spatial distribution of the properties of the Nebula
While in previous sections we focused on the integrated properties of the nebula, in this section we describe the spatial distribution of these properties along the nebula. We use the 8182 individual spectra as independent probes of these properties at different locations.
4.2.1 Line intensity maps
The ionized gas in the Orion nebula exhibits a rather complex structure. Due to that, it has been targeted by narrow-band imaging using the HST and groundbased telescopes in order to disentangle the structure of its ionized gas (e.g., Wen and O’Dell 1995; O’Dell & Yusef-Zadeh (2000); O’Dell et al. (2003); Rubin et al. (2003) and references therein). In many cases these narrow-band images catch more than one single line (e.g., H, the [NII]6548,6583 doublet or the [SII]6716,6731 doublet), reducing its use to study the basic parameters of the ionized gas (as listed in Table 3). As we quoted before, Pogge et al. (1992) presented FP observations that allowed them to disentangle some of the main diagnostic emission lines. Following them we have obtained line emission maps for the same emission lines. We have also derived line emission maps for [NII]5755, [OIII]4363 and [OII]3727,29, used as temperature, oxygen abundance and ionization indicators in combination with the lines quoted before. All the analyzed lines are listed in Table 1, labeled with an asterisk.
To derive the emission line maps each spectrum in the dataset was fitted with a single Gaussian function per emission line plus a low order polynomial function to describe the continuum emission again using FIT3D (Sánchez et al. (2006)). Instead of fitting the entire wavelength range in a row, we extracted shorter wavelength ranges for each spectrum that sampled one or a few of the analyzed emission lines, in order to characterize the continuum with the most simple polynomial function, and to simplify the fitting procedure. In a few cases we had to include some of these lines: e.g., [OIII]4363 is blended with a night sky HgI line that must also be included in the fit. When more than one emission was fitted simultaneously, their FWHMs were forced to be equal (since the FWHM is dominated by the spectral resolution), in order to decrease the number of free parameters and increase the accuracy of the deblending process (when required). A final interpolated map with a 1/pixel scale was derived for each emission line by interpolating the discrete sample of intensities obtained for each spectrum (located at a certain position in the sky). The interpolation was performed using the routines included in E3D (Sánchez (2004)). The data at the location of bright stars in the field were masked prior to any interpolation, in order to decrease the effects of their contamination.
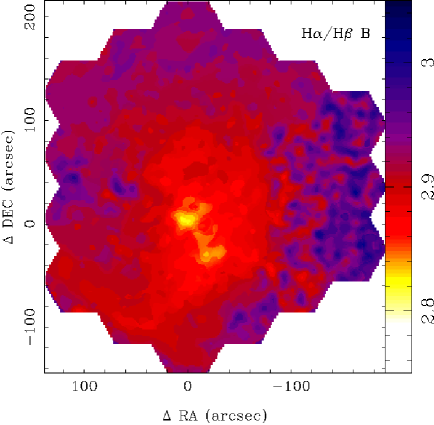
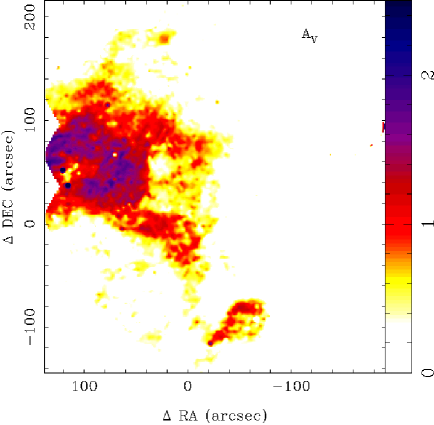
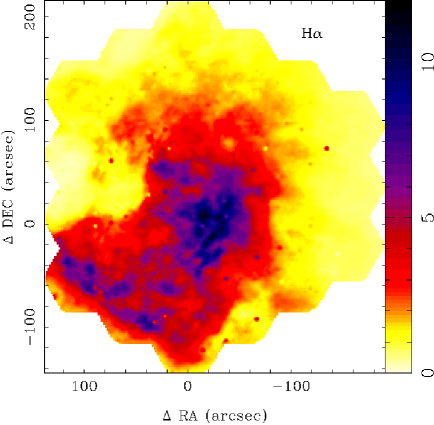
Figure 2, left panel, shows the derived H flux map. The well known structures of this region of the Orion nebula are easily identified: the strong H emission area at the west of the Trapezium, the “Dark Bay”, a strong decrease in the H intensity, at the east of the Trapezium, classically explained by dust absorption, and the Orion “Bar”, a filamentary area of strong H emission at the south-east of the Trapezium. Other fainter structures, like the small arc of M42-HH2 at the north-west of the Trapezium can also be discerned. The different sub-structures seen in the reconstructed H intensity map can be compared individually with those in the published HST and ground-based observations, which reinforce the reliability of our adopted procedure and results. In particular, this figure can be compared with the one derived from FP observations (Fig. 1e, Pogge et al. (1992)), since it does not include any contamination from [NII]. Despite the fact that there is an offset between the sampled areas of 1 they agree perfectly well, indicating that our final resolution must be similar to the one obtained by them (i.e., 2).
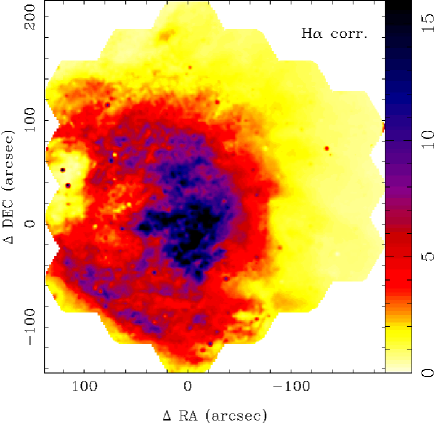
Figure 2, right panel, shows the observed H/H line ratio map. As stated before, this ratio can be used to trace the dust extinction when compared with the intrinsic one. The reddening of stars in the foreground of the Orion nebula is known to be low (0.2 mag; Breger, Gehrz & Hackwell 1981), while the reddening towards the Trapezium is much higher ( mag; Osterbrock et al. (1992); Bohlin & Savage 1981). Therefore most of the extinction is associated with the nebula. Pogge et al. (1992) proposed that it must arise in the neutral gas between us and the ionized zones of the nebula. Therefore, it is possible to assume a simple screen geometry for the dust extinction. This assumption implies that most of the deviations of the H/H ratio from the expected ones are due to dust. Pogge et al. (1992) estimated an average intrinsic ratio of H/H=2.86 throughout the nebula, assuming case B recombination for a electronic temperature of T9000 K and a density of 103 cm-3, to derive their extinction map. Instead of using this simplification, we are able to determine both the electron density and temperature maps, and derive the expected H/H line ratio map for case B recombination.
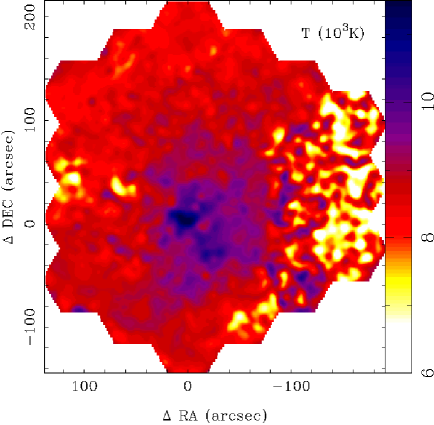
4.2.2 Electron density and temperature
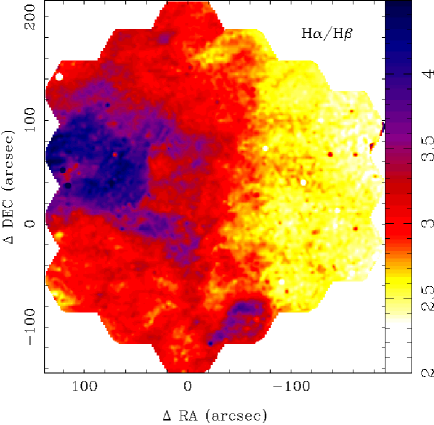
As already indicated, it is possible to determine the electron density and temperature using the [SII]6716,6731 doublet ratio and the [NII]6548+83/[NII]5755 ratio. Figure 3 shows the electron density map, (left panel) and the electron temperature map (right panel) derived from the indicated line ratio maps, following the formulae by Osterbrock (1989), as indicated in Section 4.1. The estimated density represents only a lower limit to the real one in the hydrogen ionized zone, since the [SII] emission is also present in partially ionized regions, especially near the ionization fronts, where the density can change.
To our knowledge this is the first time that both the electron density and temperature maps are estimated simultaneously. Pogge et al. (1992) derived an electron density map using the [SII]6716,6731 doublet ratio but assumed an average temperature of T=9000 K. This approximation is valid, if we take into account the reduced effect of the temperature in the density estimation and the narrow ranges of estimated temperatures throughout the nebula (Fig. 3). This explain why, despite the differences in the procedure to derive both maps, a considerable agreement in the shape of the substructures and the covered range of electron densities is found between both studies (100-15000 cm-3). This agreement is expected since the derivation of the electron density does not depend strongly on the temperature. However, we find a richer level of detail in the substructures in our map than that of Pogge et al. (1992). Since the final spatial resolutions of both datasets are similar, we may assume that these substructures are real, most probably induced by the mild effect of the temperature in the density derivation.
The highest densities are found in two regions: (1) two clumps nearby and towards the west of the Trapezium and (2) a set of clumps at 60 south-southwest of the Trapezium, both regions with an electron density of the order of 3104 cm-3. The first region was not noticed by Pogge et al. (1992), since it was too near to their masked areas due to the contamination of the bright stars of the Trapezium. The second one is coincident with the observed peak in the radio continuum emission (Yusef-Zadeh 1990), and the [CII] 158 m IR structure detected by Stacey et al. (1992), as already noticed by Pogge et al. (1992). Our density map is richer in substructures, and most of them are coincident with the higher resolution structures in this region. It seems that this is a dense region on the backside of the nebula (Pogge et al. 1992).
An enhancement of the density occurs in the Orion bar ionization front, from 2000 cm-3 to 4000 cm-3, and then it drops again across the front from north-west to south-east. The regions of higher density and the detected substructures are also coincident with the areas of higher radio continuum emission in the bar (Yusef-Zadeh 1990). This is consistent with the classical picture of ionization fronts described by Hester (1991). In addition to these large structures, there are a number of isolated substructures that can be easily associated with known HH and HH-like objects in the nebula (Pogge et al. 1992), although it is out of the scope of the current study to describe or analyze them in detail.
As we indicated before, several previous spectroscopic studies have attempted to determine the ionization conditions in the Orion nebula by obtaining slit spectroscopy at different locations (e.g., Baldwin et al. (1991); Osterbrock et al. (1992); Esteban et al. (1998); Esteban et al. (2004)). Most of them have determined the electron density and temperature at these locations using the same line ratios (usually S++ and N++) and formulae used here. Baldwin et al. (1991) obtained low-resolution optical slit spectroscopy with the slit located at 30 west of Ori C, in an east-west orientation, reaching 5 west. In the range covered by our IFS data they found a decay of the electron density from 6310 cm-3 to 158 cm-3 and of the electron temperature from 11000 K to 8000 K. At the same location we found similar values, with the electron density dropping from 6166 cm-3 to 166 cm-3, and the temperature from 10000 K to 7000 K. Esteban et al. (1998) obtained high resolution echelle spectroscopy at two locations of the nebulea, one at 45 north and another at 20 south and 10 west of Ori C. New deeper data at a similar resolution were obtained by Esteban et al. (2004) in the second location. They found an electron density of 4020 cm-3 and 6410 cm-3, and a electron temperature of 9850 K and 10710 K at each of these locations. Using our IFS data we found an electron density of 3716 cm-3 and 7141 cm-3 and a temperature of 9743 K and 10217 K at the same locations. Osterbrock et al. (1992) obtained optical and near-infrared low-resolution spectroscopy at 45 north of the Trapezium. They estimated the electron density and temperature to be 4000 cm-3 and 9000 K, similar to the values derived using our IFS data at a similar location.
O’Dell et al. (2003) presented a high resolution map of the electron temperature based on the [OIII] line ratio described above derived from narrow-band imaging using the WFPC at the HST. Their narrow-band images have the characteristic WFPC field-of-view of 160160, located to the south-west of Ori C. Despite their very fine resolution, the presented image has a not much better signal-to-noise than the one derived using our IFS data. The reason for that comes from the steps required to derive the electron density from narrow-band imaging, and how they affect the signal-to-noise of the final derivation. They used a different ion to derive the electron temperature (Fig. 3). However we can compare them since there is a simple relation between both temperatures (e.g. Pilyugin et al. 2006). The values presented by O’Dell et al. (2003) in their Fig. 2 at different selected locations and the average temperature throughout the field-of-view roughly agree with those obtained using the presented IFS data at similar locations. The temperature distribution is also coincident, however their lower signal-to-noise ratio prevent us from performing a more detailed comparison. The authors claim that although they found real variations of the temperature across the nebula, based on a statistical analysis, there is no obvious relation to the position in the nebula. Based on the temperature distribution shown in Fig. 3 we cannot agree with their interpretation of the data, since we found an obvious rich structure in the temperature distribution, which rises near the Trapezium and drops in the outer regions of the field-of-view of our data.
Thus, the electron densities and temperatures derived using the presented IFS data agree with those found using classical slit spectroscopy and narrow-band imaging at different locations in the nebula.
4.2.3 Dust extinction
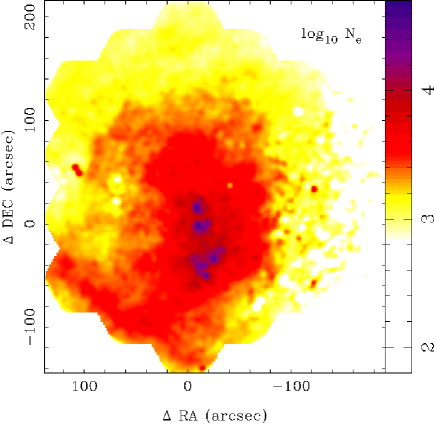
Figure 4, left panel, shows the expected distribution of the H/H line ratio map calculated for case B recombination using the electron density, , and temperature maps described above (Fig.3). We have employed the line ratios listed in Osterbrock (1989) for a discrete set of electron densities and temperatures in order to create a grid whose interpolation allowed us to estimate the line ratio for any possible set of these values. This estimation is just an approximation and a more accurate one would require a complete modeling of the nebula. However, it is clearly a much better approximation than any one used in previous studies, where a single intrinsic H/H line ratio was estimated for the entire nebula (e.g., Osterbrock et al. (1992); Pogge et al. (1992)). The estimated intrinsic line ratio ranges between 2.8 and 3.3, showing a rich structure, with a clear minimum nearby the Trapezium, towards the south-east, and a second one, less prominent, at 40 south-west. Most of the substructures are clearly associated with fluctuations in the electron density and/or temperature (see Fig. 3).
Figure 4, right panel, shows the extinction map () derived using the observed H/H line ratio map presented in Fig. 2 and assuming the estimated intrinsic value of this line ratio for each position described above (Fig. 4, left panel). We used the Orion extinction law of Cardelli, Clayton & Mathis (1989), with a ratio of total to selective extinction of 5.5 (Mathis et al. (1981)), as in previous sections. In some locations the observed line ratio is lower than the estimated one. As we indicated previously, case B recombination is the best simple approximation to describe the physical conditions in this nebula, but it does not completely describe the ionization conditions. Indeed, the presence of dust mixed with the emitting gas decreases the real value of the H/H ratio by a few percent. This deviation is most probably the cause of the observed discrepancy between the estimated intrinsic line ratio and the observed one in areas with low dust extinction.
Therefore the dust extinction map shown in Fig. 4 has to be considered as a lower limit to the real one, since the intrinsic line ratio may be overestimated. The described effect is most probably not homogeneous, which prevents us from applying a single correction to the full dataset. A detailed modeling of the ionization conditions would be required to perform a better estimation of the spatial distribution of the dust extinction. Such a modeling is out of the scope of the current study.
As expected, the “Dark-Bay” structure is associated with an increase in the foreground dust extinction, with two extensions towards the north and the south of the Trapezium. Another peak of the extinction is located 2 arcmin south-west of Ori C. Similar dust extinction distributions were reported by Pogge et al. (1992) and O’Dell et al. (2000). The Pogge et al. (1992) extinction map was affected by ring-like reduction artifacts, typical in Fabry-Perot data, absent in the currently presented dust extinction map. O’Dell et al. (2000) derived the extinction coefficient () using two different methods: (i) by comparing high resolution radio continuum emission maps obtained with the VLA and WFPC/HST H narrow-band images and (ii) by deriving the H/H line ratio using WFPC/HST narrow-band images. In both cases it was assumed that the intrinsic H/H line ratio was constant across the nebula. Despite this different approach their high resolution extinction maps are similar to the one presented here, although the estimated values for the extinction seem to be slightly lower for the IFS data.
Figure 5 shows the extinction-corrected H flux map, after the dust extinction map shown in Fig. 4 has been applied. As already noticed by Pogge et al. (1992), the appearance of the nebula is not significantly modified by the structure in the foreground dust extinction. The most remarkable structure unaffected by the dust extinction correction is the Orion bar. The decrease of the H emission south-east of this structure is not due to dust extinction, but rather a flattening of the surface of the nebula (Wen & O’Dell (1995)). The “Dark Bay” is less prominent after correcting for dust extinction, but it is still present, indicating that it is not simply a region of high foreground extinction but a region with an absence of emission. The fact that this structure is also seen in radio continuum and CO maps (e.g., Peimbert et al. (1988); van der Werf & Goss (1989); Thronson et al. 1986 ) strongly supports this conclusion.
4.2.4 Ionization structure
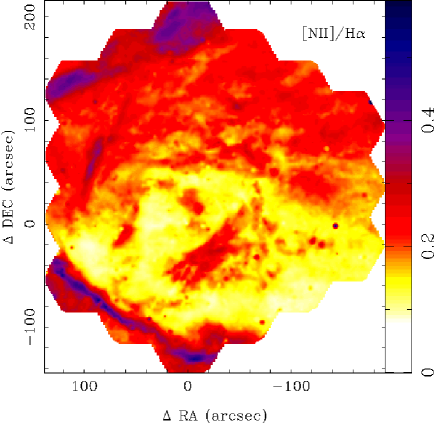
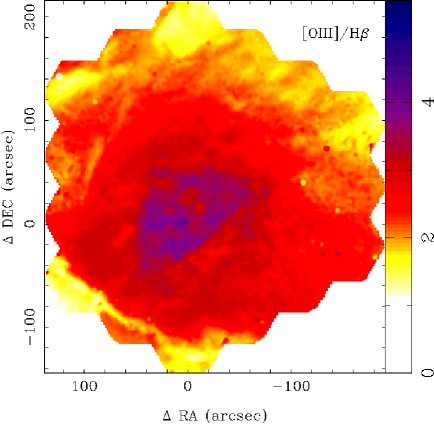
The ionization structure of the nebula can be in principle investigated by exploring the line ratio maps for the usual diagnostic lines (e.g., Baldwin et al. 1981 ; Osterbrock 1989). Figure 6 shows the line ratio maps for [NII]/H, left panel, and [OIII]/H, right panel. As already noticed by Pogge et al. (1992), the first one is the richest in structure 333The [OIII]/H map presented by Pogge et al. (1992) has an error of a factor 10 in the displayed scale, easy to cross-check when comparing with the values reported in their Table 2.. The Orion bar is the most prominent substructure, clearly seen as a diagonal region south-east of the Trapezium. Another two structures are also seen as an enhance of the [NII]/H ratio, one a less prominent north-south bar to the east of the Trapezium, at the edge of the “Dark Bay”, and another one at the north-east end of the field-of-view of our IFS data. The [NII] emission is originated in the single ionized regions between the ionized and partially ionized zones in the nebula, tracing the rapid changes in local ionization, while [OIII] is originated in the fully ionized zones (e.g., Osterbrock 1989), tracing the level of ionization in these zones. The [NII]/H as well as [OII]/H increases in areas where the [OIII]/H drops, thus the maps show the effective reciprocity between both ratios.
Pogge et al. (1992) noticed that it is not possible to use the classical diagnostic diagrams (e.g., [OIII]/H vs. [NII]/H) to distinguish between regions dominated by photoionization (HII-regions like) and regions dominated by shocks. We have repeated the experiment using our own data. They confirm that the line ratios at any position in the nebula are located in the general locus of HII-regions. No major deviations are found, even in the location of well known HH objects, like M42-HH2 and M42-HH1, where shocks may play an important role. The reason is that these regions are embedded in a high surface brightness photoionization nebula. It is known that many HH objects differ by 60 km s-1 from the systemic velocity of the nebula (e.g., Canto et al. (1980); Meaburn (1986)). Thus, it is not possible to decouple them from the resolution of our dataset, requiring high spatial and spectral resolution spectroscopy.
4.2.5 He+ Ionic abundance and metalicity
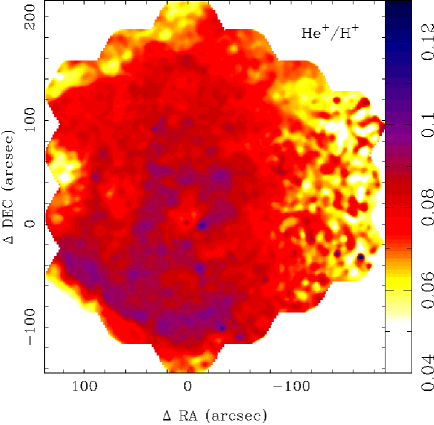
The Orion nebula has been used as an anchor point for HII regions to determine the primordial helium abundance () and the slope of the relationship between the helium and heavy-element abundance enrichment (), (e.g, Peimbert & Torres-Peimbert (1976); Baldwin et al. (1991)). However little effort has been made to explore possible internal effects on both quantities. Pogge et al. (1992) presented a study of the systematic behavior of the helium emission with respect to the hydrogen to understand the effects that influence the derived helium abundance. They presented the distribution of this abundance (He+/H+ map) in comparison to the ionization structure in the nebula.
Following Pogge et al. (1992) we determined the ionized helium abundance based on the HeI6678/H line ratio. In ionized nebulae it is expected that the He+ zone is spatially included in the H+ one, and therefore the relative strength of HeI to HI will provide a direct estimate of the ionic abundance He+/H+ (). To perform such a conversion we used the effective recombination rates of Hummer & Store (1987) for HI and of Smits (1991) for HeI, recently updated by Benjamin et al. (1999,2002). Figure 7, left panel, shows the derived He+/H+ ionic abundance map, after applying a 44 median filter to increase the signal-to-noise ratio. As already noticed by Pogge et al. (1992), there is a considerable degree of structure in the helium ionic abundance, strongly correlated with the ionization structure in the nebula. In particular, the partially ionized zones coincide with areas with lower He+/H+ abundance. In these regions, the fraction of neutral helium can be important, making it necessary to correct the derive helium abundance by this neutral fraction using an ionization correction factor (ICF, e.g., Vilchez (1989)).
Baldwin et al. (1992) estimated the He+/H+ ionic abundance at 30-90 west from Ori C at 0.08760.0047 cm-3. At a similar location we estimate this value in 0.089 using our IFS data. Esteban et al. (1998,2004) estimated the electron density at the two locations described before as 0.08560.0069 cm-3 and 0.08930.0092 cm-3. At similar locations, we estimated the electron density as 0.085 cm-3 and 0.089 cm-3. The agreement between our results and previous studies at different locations reinforce our approach and demonstrate the quality of the presented dataset.
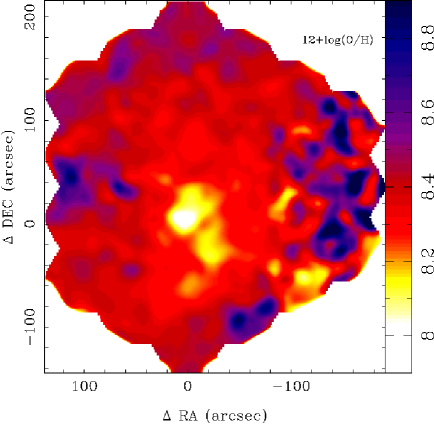
Figure 7, right panel, shows the oxygen abundance map using the classical direct derivation using the temperature estimator (Pagel et al. (1979)). The oxygen abundance was derived using the [OII]3727/H and [OIII]5007/H, together with the distribution of electron densities and temperatures describe before, and the formulae presented by Pilyugin & Thuan (2005). The described electron temperature, T2, derived using the [NII] line ratio, is representative of single ionized ions (like N+ or O+). This temperature is different to the temperature representative of double ionized ions, T3 (like O++). To derive it, one would have to use the [OIII] line ratio, as described above (Sec. 4.1). However, the strong contamination by a Hg sky emission line at 4358Å close to the [OIII]4363 line prevents us from using it, particularly in the regions of faint [OIII] emission. Instead we have employed the model-independent relation between T2 and T3 presented by Pilyugin et al. (2006). For comparision we also estimated the oxygen abundance ratio using the indicator (Pettini & Pagel (2004)), based on the [OIII]/H and [NII]/H line ratios maps (corrected for dust extinction). This indicator was calibrated to determine the integrated abundance in a nebula and it is not clear that it would be valid for point-to-point abundance estimations within a nebula itselft. It has the advantage that it does not require the use of the poorly determined electron temperature or density, but the use of a high signal-to-noise line ratios. Although we found a one-to-one relation between both abundances, we also found two worrisome effects: (1) there is a strong scatter in the relation, of the order of 1 dex, and (2) the relation induces a strong correlation between the oxygen abundance and any of the indicators of the degree of ionization, like the [OIII]/H and [NII]/H line ratios and the ionization parameter (). These two effects prevent us from using this latter indicator, although the one derived using the temperature measurement has a much lower signal-to-noise ratio.
The derived distribution of oxygen abundace was smoothed using a 44 median filter to increase the accuracy in the areas of lower signal-to-noise ratio. Despite this smoothing the abundance shows also a rich structure. However, in this case there is no clear relation to the structure of the distribution of the ionization diagnostic lines, being more related to the distributions of the electron densities and temperatures shown in Fig. 3. The oxygen abundance has a minimum near the Trapezium, of the order of 12+log()8.2, increasing towards the outer parts, where it reaches 12+log()8.6–8.8. Although in some regions its structure seems to be correlated with that of the helium abundance, contrary to what is expected, this is not always the case. It is out of the scope of this article to study in detail the reasons for such a lack of correlation. However it is probably related to the presence of non-fully ionized areas where the fraction of neutral helium is not negligible, and/or a deplection of the oxygen from the helium ioniazed areas.
It is well known that there are two ionization zones in the Orion nebula (O’dell (2001)). The zone closest to the ionization front, partially ionized, where the fraction of neutral helium is not negligible, and the zone closest to the ionizing star, fully ionized. The former is associated with an enhanced [NII]/H ratio, while the latter is associated with an increase of the [OIII]/H ratio. Thus, in the partially ionized zone it would be necessary to recompute the fraction of ionized helium by applying an ICF.
5 Summary and conclusions
We have performed a low-resolution IFS survey covering the optical wavelength range (3700-7100Å) within a field-of-view of 56 centered approximately in the Trapezium area of the Orion nebula. The data, comprising 8121 individual spectra sampling circular areas of 2.7 each are distributed public as a PPAK legacy project. To demonstrate the use of these data we have analysed the integrated spectrum, detecting 82 individual emission lines, whose fluxes were measured. Based on these line intensities we derived the main integrated spectroscopic properties of the ionized gas, including the average dust extinction, electron density and temperature and the values of the classical diagnostic line ratios. All of them agree with previously published results based on long-slit and Fabry-Perot observations.
Line intensity maps for different emission lines were obtained to study the complex structure of the ionized gas in the nebula. The derived H intensity map, a tracer of the ionized hydrogen, was found to be similar to that found using FP and narrow-band imaging, which supports the overall observational and reduction procedure. The electron density and temperature maps were derived using the [SII] line ratios and [OIII] and [NII] line ratios respectively. A considerable amount of structure was found in both distributions. We used this stricture to create a map of the expected H/H line ratio, based in case B recombination. A comparison between this expected line ratio and the observed one was used to obtain a dust extinction map that was used to correct for reddening all in the derived emission line maps.
The ionized structure was studied based on the classical diagnostic line ratios [NII]/H and [OIII]/H. The distribution of helium and oxygen abundances were derived based on the HeI6678/H line ratio and the temperature metallicity indicator (based on the [OII]/H and [OIII]/H line ratios). No clear relation was found between the abundance distributions, contrary to what was expected from the study of the integrated properties of known HII regions. There is a relation between the helium abundance and the ionization structure, in the sense that partially ionized areas are less abundant in helium and more abundant in heavy elements. Two possible deviations from case B recombination theory in the Orion nebula may explain this trend and the lack of a relation between both abundances: (i) the fact that the nebula is not fully ionized, which leads to an underestimation of the helium mass fraction due to the non neglectible contribution of neutral helium, and (ii) the suspiction that there is dust mixed with the emitting gas which absorbs the Lyman-line ionizing photons.
A more detailed modeling is required to correctly understand the ionizing conditions in the nebula and their relations with the helium and heavy metals abundances. We consider that the released dataset will be of a fundamental importance to constrain such models.
Acknowledgements.
We thank the Spanish Plan Nacional de Astronomía program AYA2005-09413-C02-02, of the Spanish Ministery of Education and Science and the Plan Andaluz de Investigación of Junta de Andalucía as research group FQM322. MV thanks Matthias Steinmetz and the instrumentation group at the AIP for facilitating the construction of the PPak module and its integration into PMAS, the spectrograph used for this survey. We thank the referee, Prof. Dr. O’Dell, who helped us to improve the quality of this article with his valuable comments and suggestions, and his detailed check of the flux calibration.References
- (1) Baldwin, J. A., Phillips, M. M., & Terlevich, R. 1981, PASP, 93, 5
- Baldwin et al. (1991) Baldwin, J. A., Ferland, G. J., Martin, P. G., Corbin, M. R., Cota, S. A., Peterson, B. M., & Slettebak, A. 1991, ApJ, 374, 580
- Benjamin et al. (1999) Benjamin, R. A., Skillman, E. D., & Smits, D. P. 1999, ApJ, 514, 307
- Benjamin et al. (2002) Benjamin, R. A., Skillman, E. D., & Smits, D. P. 2002, ApJ, 569, 288
- Bohlin & Savage (1981) Bohlin, R. C., & Savage, B. D. 1981, ApJ, 249, 109
- Breger et al. (1981) Breger, M., Gehrz, R. D., & Hackwell, J. A. 1981, ApJ, 248, 963
- Canto et al. (1980) Canto, J., Goudis, C., Johnson, P. G., & Meaburn, J. 1980, A&A, 85, 128
- Cardelli et al. (1989) Cardelli, J. A., Clayton, G. C., & Mathis, J. S. 1989, ApJ, 345, 245
- Clegg (1987) Clegg, R. E. S. 1987, MNRAS, 229, 31P
- Cota & Ferland (1988) Cota, S. A., & Ferland, G. J. 1988, ApJ, 326, 889
- Esteban et al. (1998) Esteban, C., Peimbert, M., Torres-Peimbert, S., & Escalante, V. 1998, MNRAS, 295, 401
- Esteban et al. (2004) Esteban, C., Peimbert, M., García-Rojas, J., Ruiz, M. T., Peimbert, A., & Rodríguez, M. 2004, MNRAS, 355, 229
- Ferland (2001) Ferland, G. 2001, PASP 113, 41
- Hester (1991) Hester, J.J., 1991, PASP, 103, 853
- Hummer & Storey (1987) Hummer, D. G., & Storey, P. J. 1987, MNRAS, 224, 801
- Kaler (1976) Kaler, J. B. 1976, ApJS, 31, 517
- Kelz et al. (2006) Kelz, A., Verheijen, M.A.W., Roth, M.M. et al., 2006, PASP, 118, 129
- Kennicutt et al. (1989) Kennicutt, R. C., Jr., Edgar, B. K., & Hodge, P. W. 1989, ApJ, 337, 761
- Lee (1968) Lee, T. A. 1968, ApJ, 152, 913
- Mathis et al. (1981) Mathis, J. S., Perinotto, M., Patriarchi, P., & Schiffer, F. H., III 1981, ApJ, 249, 99
- Meaburn (1986) Meaburn, J. 1986, A&A, 164, 358
- O’Dell & Yusef-Zadeh (2000) O’Dell, C. R., & Yusef-Zadeh, F. 2000, AJ, 120, 382
- O’dell (2001) O’dell, C. R. 2001, ARA&A, 39, 99
- O’Dell et al. (2003) O’Dell, C. R., Peimbert, M., & Peimbert, A. 2003, AJ, 125, 2590
- Osterbrock (1988) Osterbrock, D. E. 1988, PASP, 100, 412
- Osterbrock (1989) Osterbrock, D. E. 1989, Research supported by the University of California, John Simon Guggenheim Memorial Foundation, University of Minnesota, et al. Mill Valley, CA, University Science Books, 1989, 422 p.,
- Osterbrock et al. (1990) Osterbrock, D. E., Shaw, R. A., & Veilleux, S. 1990, ApJ, 352, 561
- Osterbrock et al. (1992) Osterbrock, D. E., Tran, H. D., & Veilleux, S. 1992, ApJ, 389, 305
- Pagel et al. (1979) Pagel, B. E. J., Edmunds, M. G., Blackwell, D. E., Chun, M. S., & Smith, G. 1979, MNRAS, 189, 95
- Pagel et al. (1992) Pagel, B. E. J., Simonson, E. A., Terlevich, R. J., & Edmunds, M. G. 1992, MNRAS, 255, 325
- Peimbert & Torres-Peimbert (1976) Peimbert, M., & Torres-Peimbert, S. 1976, ApJ, 203, 581
- Peimbert et al. (1988) Peimbert, M., Ukita, N., Hasegawa, T., & Jugaku, J. 1988, PASJ, 40, 581
- Pettini & Pagel (2004) Pettini, M., & Pagel, B. E. J. 2004, MNRAS, 348, L59
- Pilyugin & Thuan (2005) Pilyugin, L. S., & Thuan, T. X. 2005, ApJ, 631, 231
- Pilyugin et al. (2006) Pilyugin, L. S., Vilchez, J.M., Thuan, T. X., 2006, MNRAS, 370, 1928
- Pogge et al. (1992) Pogge, R. W., Owen, J. M., & Atwood, B. 1992, ApJ, 399, 147
- Roth et al. (2005) Roth, M.M., Kelz, A., Fechner, T., et al., 2005, PASP, 117, 620
- Rubin et al. (2003) Rubin, R. H., Martin, P. G., Dufour, R. J., Ferland, G. J., Blagrave, K. P. M., Liu, X.-W., Nguyen, J. F., & Baldwin, J. A. 2003, MNRAS, 340, 362
- Sánchez (2004) Sánchez, S. F. 2004, AN, 325, 167
- Sánchez (2006) Sánchez, S. F. 2006, AN, 327, 850
- Sánchez et al. (2006) Sánchez S.F., García-Lorenzo, B., Pecontal-Rousset, A., 2006, Proceedings of the XIII IAC Winter School, Arribas, S., Mediavilla, E., & Roth, M., Ed., in press.
- Smits (1991) Smits, D. P. 1991, MNRAS, 251, 316
- Stacey et al. (1993) Stacey, G. J., Jaffe, D. T., Geis, N., Grenzel, R., Harris, A. I., Poglitsch, A., Stutzki, J., & Townes, C. H. 1993, ApJ, 404, 219
- (44) Thronson, H. A., Jr., et al. 1986, AJ, 91, 1350
- Tody (1993) Tody, D. 1993, ”IRAF in the Nineties” in Astronomical Data Analysis Software and Systems II, A.S.P. Conference Ser., Vol 52, eds. R.J. Hanisch, R.J.V. Brissenden, & J. Barnes, 173.
- van der Werf & Goss (1989) van der Werf, P. P., & Goss, W. M. 1989, A&A, 224, 209
- Verheijen et al. (2004) Verheijen, M. A. W., Bershady, M. A., Andersen, D. R., Swaters, R. A., Westfall, K., Kelz, A., & Roth, M. M. 2004, Astronomische Nachrichten, 325, 151
- Vilchez (1989) Vilchez, J. M. 1989, Ap&SS, 157, 9
- Vitrichenko (2000) Vitrichenko, E. A. 2000, Astronomy Letters, 26, 244
- Wen & O’Dell (1995) Wen, Z., O’Dell, C.R., 1995, ApJ, 438, 784
- Yusef-Zadeh (1990) Yusef-Zedeh, F., 1990, ApJ, 361, L19