Our CMB motion: The Role of the Local Void
Abstract
A database with a high density of accurate distances is used to investigate the contributions to the motion of our Galaxy. It is found that the motion of the Local Group separates remarkably cleanly into 3 components: a large-scale attraction toward structure in the ‘Great Attractor’ sector, a mid-scale attraction toward the Virgo Cluster, and a local-scale ‘repulsion’ from the Local Void. These 3 components cause motions of comparable amplitudes and, conveniently, are directed almost orthogonal to one another.
Institute for Astronomy, University of Hawaii
1. Introduction
The dipole temperature variation of the cosmic microwave background (CMB) indicates that we have a peculiar motion of over 600 km s-1 in the Local Group rest frame. Part of that motion is directed toward the concentration of galaxies in the vicinity of the Virgo Cluster (Aaronson et al. 1982; Tully & Shaya 1984; Tonry et al. 2000). Another part is directed toward the structures in the Norma–Hydra–Centaurus regions (Lynden-Bell et al. 1988) with a possible relevance of the background Shapley Concentration (Scaramella et al. 1989). These sources strongly influence our motion but there is yet another very substantial component. There have been hints of the importance of this component that have given rise to discussion of the ‘local velocity anomaly’ (Faber & Burstein 1988; Tully 1988; Tully et al. 1992). Today there are many more excellent distances to nearby galaxies and these new distances clarify the situation considerably. Remarkably, it is possible to separate the influences on our motion on scales beyond the Local Group into three cleanly separated components.
The most important of the new distance information is coming from Hubble Space Telescope (HST) imaging of nearby galaxies of all types and the color-magnitude diagrams of the resolved stars that result from those observations. A single orbit sequence of observations with Advanced Camera for Surveys (ACS) provides sufficient definition of the tip of the red giant branch (TRGB) for the determination of a distance with relative accuracy of 5% (without getting into zero-point issues) for any galaxy within 10 Mpc (Karachentsev et al. 2004, 2006; Makarov et al. 2006). Presently, HST has provided information for over 200 galaxies within this distance, roughly half of what we might hope ultimately to obtain.
The TRGB measurements provide outstanding distances to nearby galaxies. At larger distances, the present analysis relies on the following sources: the HST Key Project (Freedman et al. 2001) for Cepheid distances and the zero-point to the distance scale that the Key Project provides, the Surface Brightness Fluctuation (SBF) measures of Tonry et al. (2001), and a personal compilation of luminosity–linewidth measures (Tully & Fisher 1977) extending on the sample discussed by (Tully & Pierce 2000). This compendium of distances is restricted to km s-1, including the Centaurus and Hydra clusters at it’s limit. The catalog contains distance estimates for 1485 galaxies in 661 groups. The catalog will be made available on-line with the publication of an article that describes the present results more completely.
2. The Peculiar Velocity Field within 3000 km s-1
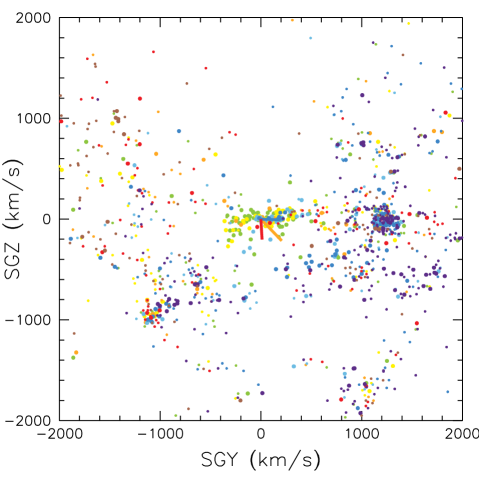
Figure 1 illustrates the peculiar velocities of the galaxies within an inner box of km s-1 of our position. Several aspects of the plot are striking. The obvious cluster at SGY=1200, SGZ=0 is the Virgo Cluster and there is a great predominance of blue shades among the galaxies found there. There is an implied motion of approach and we can presume that we are being pulled toward the Virgo Cluster rather than the other way round. Second, we see that all the galaxies in our immediate vicinity have modest relative velocities, causing them to be colored green or yellow. The filament containing our Galaxy and all our immediate neighbors is heading somewhere as a unit, with little internal velocity dispersion. Third, there is a tendency for objects between one o’clock and 8 o’clock in Fig. 1 to be in shades of blue and objects in the opposite sector to be in shades of red. We are headed toward 4:30. Indeed, the vector of our motion with respect to our full sample of distance estimates has an amplitude of 298 km s-1 toward supergalactic coordinates (Galactic coordinates ). This vector is indicated in orange in Fig. 1.
The Virgo Cluster must be causing part of this motion. A recent analysis that gives attention to the infall pattern in the immediate vicinity of the Virgo Cluster (Mohayaee & Tully 2005) ascribes a mass approaching to the cluster within a radius of 2 Mpc. It follows that we have a peculiar motion of km s-1 toward Virgo at our location. If a vector of this amplitude and direction (the blue vector in Fig. 1) is subtracted from the orange vector then the result is the red vector, with amplitude 211 km s-1 toward (). This vector is not very sensitive to the details of the vector subtraction of the Virgo component because the red and blue vectors are almost orthogonal; a variation of km s-1 toward Virgo affects the amplitude of the red vector by only 10 km s-1 and the direction by .
3. The Local Void
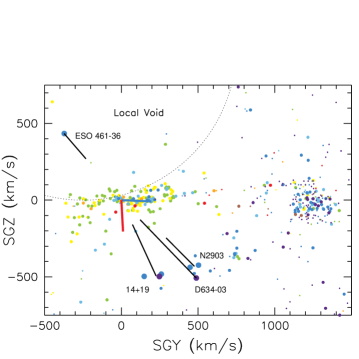
What are we to make of this large motion orthogonal to the plane of the local filament? Consider Figure 2. It is reaffirmed that all our neighbors within our filament are traveling with us in this downward excursion. Second, this motion is a local phenomenon: the filament below us at SGZ=500 km s-1, the Leo Spur in the Nearby Galaxies Atlas, (Tully & Fisher 1987) is not participating in this activity. To the contrary, after subtracting off our motion the Leo Spur has a net motion toward positive SGZ! This motion is well established by the accurate TRGB distance measures reflected in the black peculiar velocity vectors shown in Fig. 2.
There is manifestly no source of attraction that would pull us down toward negative SGZ while pulling the Leo Spur up. It is to be concluded that our motion is not toward anything but away from the Local Void. (The motion of the Leo Spur might in part be due to a push from a void below it and in part the pull of the equatorial plane of the Local Supercluster.) The Local Void (Tully & Fisher 1987) is impressively extensive and impressively near. The void lurks at the edge of the Local Group. It actually seems to have two components; a smaller void with a long dimension of Mpc enclosed within a larger void with a long dimension of Mpc. We lie on a wall that is shared by the two, which we are calling the Inner and Greater Local Voids. If one wants to study the properties of voids, one does not have to look very far.
The Local Void is not a total void. A good TRGB distance and HI velocity exists for the lonely dwarf galaxy ESO 46136 (Karachentsev et al. 2006). This galaxy has the peculiar velocity km s-1 indicated by the vector in Fig. 2. This galaxy is chasing us out of the void. It’s motion is additive to the orange vector of Fig. 1 so it’s motion with respect to the rest frame given by our km s-1 sample is over 500 km s-1.
4. The Large-Scale Component of our Peculiar Velocity
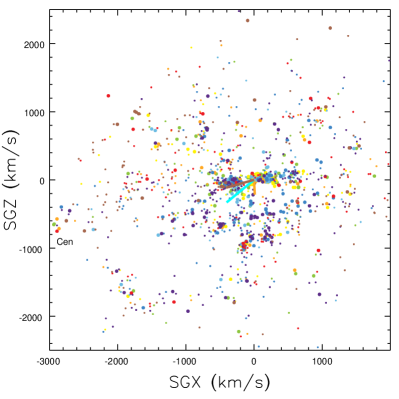
The motion defined by our sample of galaxies with distances within 3000 km s-1 does not agree with the global motion inferred from the CMB dipole anisotropy. Figure 3 shows these two vectors (orange and cyan respectively) and the resultant vector (brown) after the local contribution is subtracted from the CMB cumulative motion. This resultant vector is taken to be generated by forces on larger scales than sampled by our distance catalog. The cyan global CMB vector is taken (Kogut et al. 1993) to have an amplitude in the Local Group rest frame of 619 km s-1 directed toward (). Subtracting the orange Local Supercluster vector leaves the brown large-scale vector of 446 km s-1 toward ().
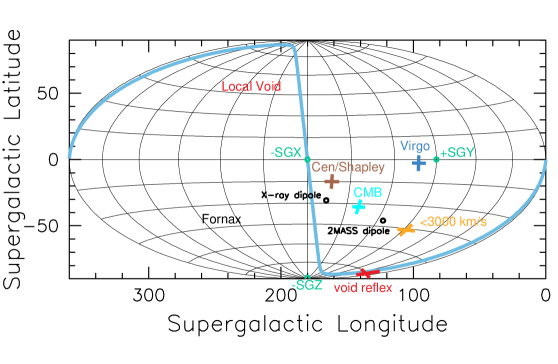
The directions of these various vectors are displayed on the Aitoff projection of Figure 4 along with the positions of features that might be considered relevant. Partially but not completely by chance, the three components of the CMB decomposition are almost orthogonal to each other, with Virgo near +SGY, the Local Void reflex near SGZ, and the large scale (Cen/Shapley) component near SGX (it is no coincidence that the attractors are at the Supergalactic equator and the repulser is at the Supergalactic pole). Two recently determined dipoles in the distribution of galaxies are plotted in Fig. 4. One is the dipole in the distribution of 2MASS selected galaxies (Erdoğdu et al. 2006) while the other is the dipole in the distribution of X-ray selected rich clusters (Kocevski & Ebeling 2006). The former is drawn from a sample that peaks in number at km s-1 and provides poor coverage beyond 10,000 km s-1 while the latter is only becoming interesting beyond 4000 km s-1. Interestingly, the 2MASS dipole is offset from the CMB dipole in the direction of the orange velocity vector defined by our 3,000 km s-1 sample while the X-ray cluster dipole is offset from the CMB dipole in the direction of the brown large scale residual velocity vector. The 2MASS sample is relatively local, strongly influenced by galaxies within 3000 km s-1 that we are sampling with our distance catalog. The X-ray selected sample has very little overlap with our domain and provides a degree of confirmation of our decomposition of the CMB vector into local and large scale components. It follows that models that try to describe the large scale motion need only explain the reduced amplitude of the residual large scale component and the direction of this residual component which agrees reasonably with the direction of obvious concentrations in the distribution of galaxies.
5. Summary
1. A sample of 1485 distance measure for galaxies with velocities within 3000 km s-1 reveal that the Local Group has a motion with respect to this sample of 298 km s-1 in a direction with components toward the Virgo Cluster and the supergalactic south pole.
2. The galaxies within our local filament share this motion with very low internal random motions.
3. The motion toward the supergalactic south pole is in the sense of an evacuation of the Local Void which lies north of the supergalactic equator just beyond the Local Group. A lonely dwarf galaxy in the void is seen to be moving toward the edge of the void with a velocity of over 500 km s-1 with respect to the galaxies of our sample.
4. The Leo Spur, the filament that lies below the supergalactic plane, has a motion of several hundred km s-1 upward with respect to the galaxies in our sample. In co-moving coordinates our filament and the Leo Spur are converging although in expanding coordinates the two structures are almost stationary.
5. If the Local Group motion with respect to our sample limited to 3000 km s-1 is subtracted from the CMB dipole motion, the resultant motion of 446 km s-1 to be attributed to the large scale distribution of matter is found to be reasonably aligned with the observed overdensity of galaxies in the general direction of Centaurus.
Acknowledgments.
An expanded version of this talk is being prepared for a refereed publication. I thank my colleagues in that enterprise: Helen Courtois, Igor Karachentsev, Dale Kocevski, Alan Peel, Luca Rizzi, and Ed Shaya. This research is supported by HST awards GO-9162, 10210 and 10905, a SIM Key Project, and NSF award AST-0307706.
References
- Aaronson et al. (1982) Aaronson, M., Huchra, J., Mould, J., Schechter, P. L., & Tully, R. B. 1982, ApJ, 258, 64
- Erdoğdu et al. (2006) Erdoğdu, P., Huchra, J. P., Lahav, O., Colless, M., Cutri, R. M., Falco, E., George, T., Jarrett, T., Jones, D. H., Kochanek, C. S., Macri, L., Mader, J., Martimbeau, N., Pahre, M., Parker, Q., Rassat, A., & Saunders, W. 2006, MNRAS, 368, 1515
- Faber & Burstein (1988) Faber, S. M. & Burstein, D. 1988, Motions of galaxies in the neighborhood of the local group (Large-Scale Motions in the Universe: A Vatican study Week), 115–167
- Freedman et al. (2001) Freedman, W. L., Madore, B. F., Gibson, B. K., Ferrarese, L., Kelson, D. D., Sakai, S., Mould, J. R., Kennicutt, Jr., R. C., Ford, H. C., Graham, J. A., Huchra, J. P., Hughes, S. M. G., Illingworth, G. D., Macri, L. M., & Stetson, P. B. 2001, ApJ, 553, 47
- Karachentsev et al. (2006) Karachentsev, I. D., Dolphin, A., Tully, R. B., Sharina, M., Makarova, L., Makarov, D., Karachentseva, V., Sakai, S., & Shaya, E. J. 2006, AJ, 131, 1361
- Karachentsev et al. (2004) Karachentsev, I. D., Karachentseva, V. E., Huchtmeier, W. K., & Makarov, D. I. 2004, AJ, 127, 2031
- Kocevski & Ebeling (2006) Kocevski, D. D. & Ebeling, H. 2006, ApJ, 645, 1043
- Kogut et al. (1993) Kogut, A., Lineweaver, C., Smoot, G. F., Bennett, C. L., Banday, A., Boggess, N. W., Cheng, E. S., de Amici, G., Fixsen, D. J., Hinshaw, G., Jackson, P. D., Janssen, M., Keegstra, P., Loewenstein, K., Lubin, P., Mather, J. C., Tenorio, L., Weiss, R., Wilkinson, D. T., & Wright, E. L. 1993, ApJ, 419, 1
- Lynden-Bell et al. (1988) Lynden-Bell, D., Faber, S. M., Burstein, D., Davies, R. L., Dressler, A., Terlevich, R. J., & Wegner, G. 1988, ApJ, 326, 19
- Makarov et al. (2006) Makarov, D., Makarova, L., Rizzi, L., Tully, R. B., Dolphin, A. E., Sakai, S., & Shaya, E. J. 2006, ArXiv Astrophysics e-prints
- Mohayaee & Tully (2005) Mohayaee, R. & Tully, R. B. 2005, ApJ, 635, L113
- Scaramella et al. (1989) Scaramella, R., Baiesi-Pillastrini, G., Chincarini, G., Vettolani, G., & Zamorani, G. 1989, Nat, 338, 562
- Tonry et al. (2000) Tonry, J. L., Blakeslee, J. P., Ajhar, E. A., & Dressler, A. 2000, ApJ, 530, 625
- Tonry et al. (2001) Tonry, J. L., Dressler, A., Blakeslee, J. P., Ajhar, E. A., Fletcher, A. B., Luppino, G. A., Metzger, M. R., & Moore, C. B. 2001, ApJ, 546, 681
- Tully (1988) Tully, R. B. 1988, Distances to galaxies in the field (Large-Scale Motions in the Universe: A Vatican study Week), 169–177
- Tully & Fisher (1977) Tully, R. B. & Fisher, J. R. 1977, A&A, 54, 661
- Tully & Fisher (1987) —. 1987, Nearby galaxies Atlas (Cambridge: University Press, 1987)
- Tully & Pierce (2000) Tully, R. B. & Pierce, M. J. 2000, ApJ, 533, 744
- Tully & Shaya (1984) Tully, R. B. & Shaya, E. J. 1984, ApJ, 281, 31
- Tully et al. (1992) Tully, R. B., Shaya, E. J., & Pierce, M. J. 1992, ApJS, 80, 479