NGC 3741: dark halo profile from the most extended rotation curve
Abstract
We present new HI observations of the nearby dwarf galaxy NGC 3741. This galaxy has an extremely extended HI disk, which allows us to trace the rotation curve out to unprecedented distances in terms of the optical disk: we reach 42 B-band exponential scale lengths or about 7 kpc. The HI disk is strongly warped, but the warp is very symmetric. The distribution and kinematics are accurately derived by building model data cubes, which closely reproduce the observations. In order to account for the observed features in the data cube, radial motions of the order of 513 km s-1 are needed. They are consistent with an inner bar of several hundreds of pc and accretion of material in the outer regions.
The observed rotation curve was decomposed into its stellar, gaseous and dark components. The Burkert dark halo (with a central constant density core) provides very good fits. The dark halo density distribution predicted by the CDM theory fails to fit the data, unless NGC 3741 is a 2.5- exception to the predicted relation between concentration parameter and virial mass and has at the same time a high value of the virial mass (though poorly constrained) of 1011 M⊙. Noticeably, MOND seems to be consistent with the observed rotation curve. Scaling up the contribution of the gaseous disk also gives a good fit.
keywords:
galaxies: kinematics and dynamics – galaxies: spiral – dark matter1 Introduction
The measurement of rotation curves of disk galaxies has been one of the most powerful tools to study dark matter, its content relative to baryons, and its distribution. In particular, dwarf galaxies are good candidates for dark-matter studies as their kinematics is generally dominated by dark matter down to small galactocentric radii (Persic, Salucci & Stel 1996), thus providing an almost clean measurement of the dark-matter contribution to the observed rotation curve and hence of its density profile. Therefore, they represent an important test for cosmological models, because numerical simulations performed in the framework of the currently favoured theory of structure formation in the Universe, Cold Dark Matter (CDM), predict a well-defined density profile for dark matter in virialised structures, the NFW profile (Navarro, Frenk and White 1996). Subsequent modifications and refinements via improved numerical resolution (Moore et al. 1999, Navarro et al. 2004) do not change one of the main predicted features: a central density cusp, for , with .
In the recent past, several studies were devoted to the analysis of rotation curves of dwarf galaxies (e.g. van den Bosch & Swaters 2001, Borriello & Salucci 2001, Swaters et al. 2003, Weldrake, de Blok & Walter 2003, Simon et al. 2005, Gentile et al. 2005), in particular to test whether the density profile predicted by CDM models is actually observed. Even though the debate as to whether observations can put strong constraints on the dark matter density profiles is still ongoing, the results are that in most cases the observations prefer halos with a constant-density core, for . A possible explanation to reconcile the observations and predictions involves non-circular motions induced by halo triaxiality (Hayashi et al. 2004, Hayashi & Navarro 2006); the authors show the effects of non-circular motions on the observed minor axis kinematics for some viewing angles. Gentile et al. (2005) analysed the velocity field of DDO 47 (of which the rotation curve is best fitted by a cored halo) through its harmonic decomposition and found non-circular motions of the order of only km s-1, an order of magnitude smaller than the discrepancy between the observations and the CDM predictions. However, the effects of triaxiality vary strongly with the viewing geometry. A detailed study of the effects of triaxiality with all possible viewing angles on the results of harmonic decompositions of velocity fields is yet to come and would be a valuable result. It seems however unlikely that the very small 2-D non-circular motions measured in Gentile et al.(2005) may hide an underlying NFW cusp.
NGC 3741 is a sort of privileged laboratory to investigate the dark matter distribution in galaxies. It is a nearby dwarf irregular galaxy with an absolute blue magnitude of -1313. Its distance (Karachentsev et al. 2004), estimated through the tip of the Red-Giant Branch, is 3.00.3 Mpc, while Georgiev et al. (1997) find a slightly higher value (3.5 0.7 Mpc) from the brightest blue stars; unless stated otherwise, in this paper we adopt a distance of 3 Mpc, obtaining an absolute B-band blue luminosity of 2.7 107 . The HI disk of this galaxy was studied by Begum et al. (2005) using observations performed with the Giant Metrewave Radio Telescope (GMRT), which disclosed the extremely extended gaseous disk of NGC 3741. They traced the rotation curve out to 38 B-band times the exponential scale length, whose value is 1075 (Bremnes et al. 2000), corresponding to 0.16 kpc at a distance of 3 Mpc. We observed this galaxy in the HI line with the Westerbork Synthesis Radio Telescope (WSRT) and reach 42 exponential scale lengths. We re-determined the rotation curve by means of the more efficient Modified Envelope Tracing method (Gentile et al. 2004) and data cube modelling. This is to our knowledge the most extended rotation curve ever measured in terms of the optical size.


2 Observations and reduction
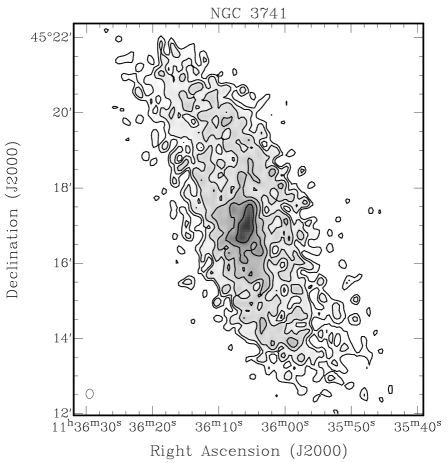
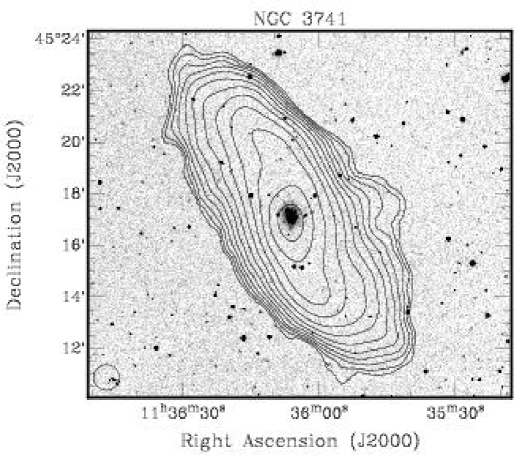
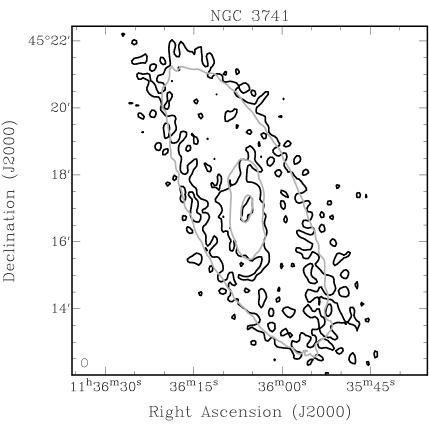
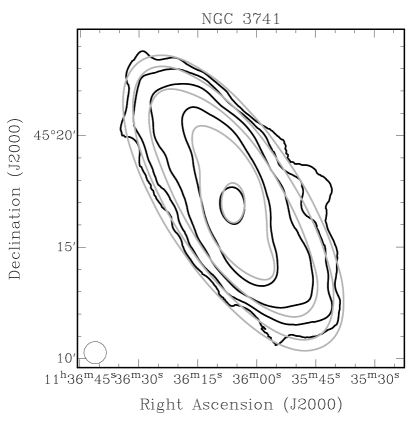
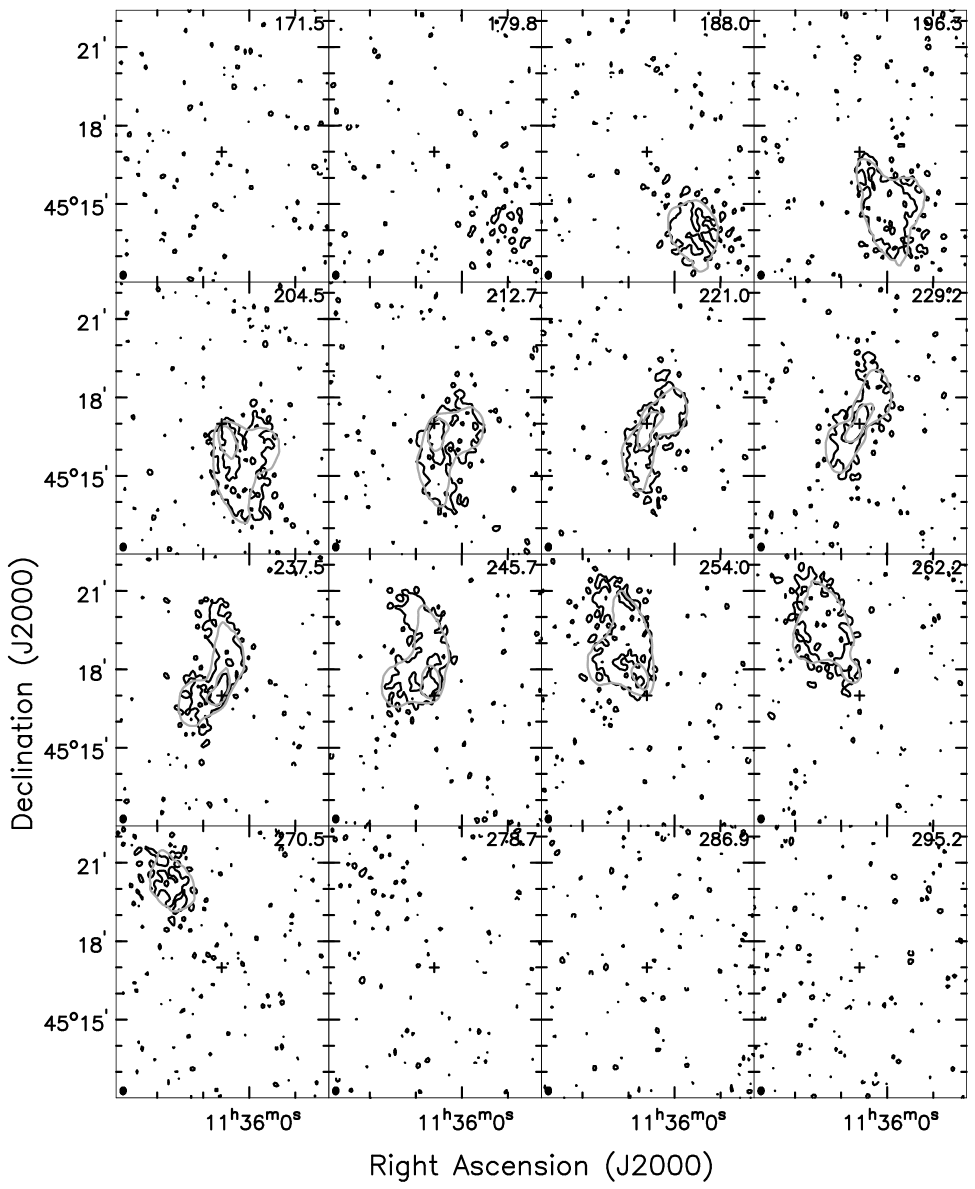
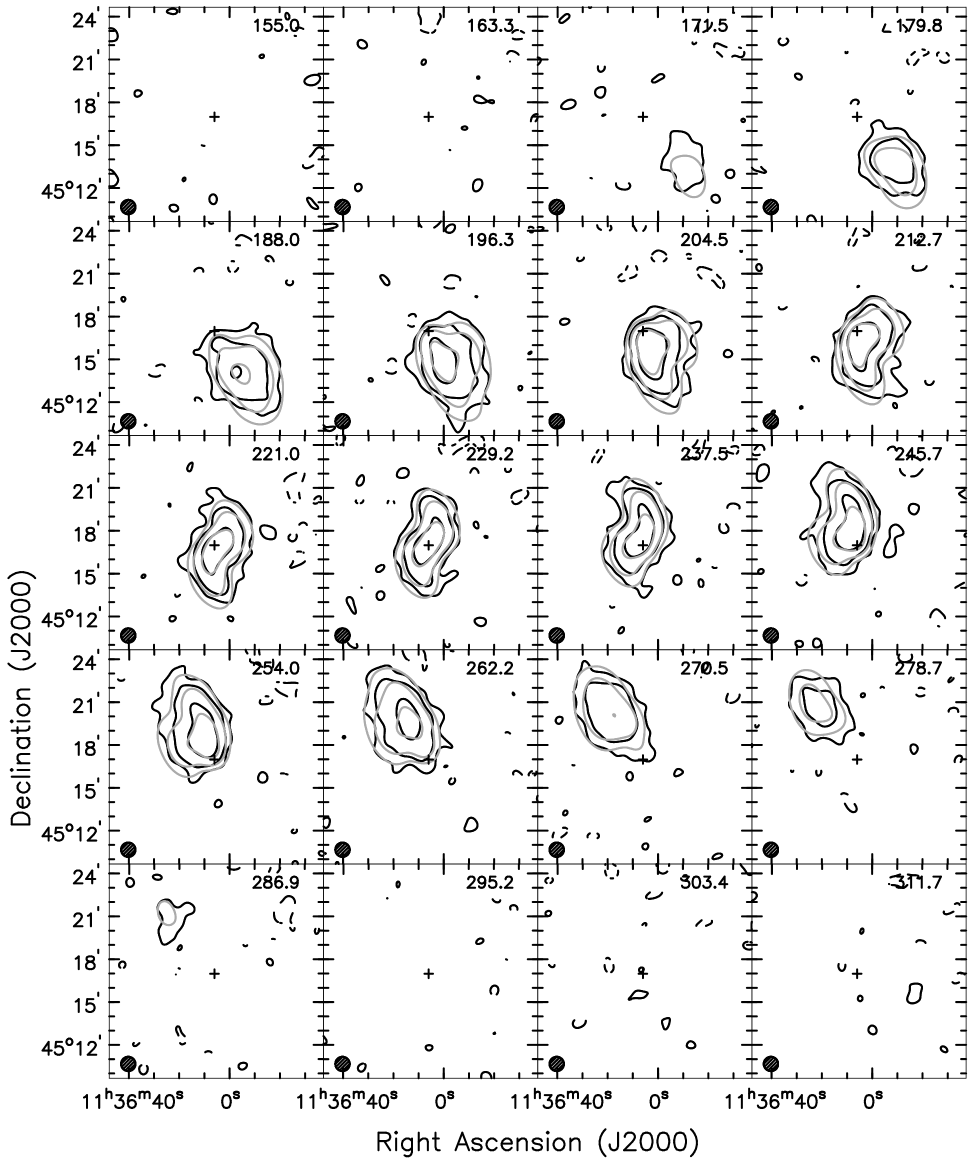
The observations were performed with the WSRT for 12 hours with the ‘maxi-short’ configuration. The correlator setup was chosen to have 10 MHz total bandwidth divided into 2048 channels, which were subsequently reduced through Hanning smoothing. The final data cubes have a velocity resolution of 4.1 km s-1. Flagging and calibration were performed with the MIRIAD software. A continuum map was created from the line-free channels, which was used for phase self-calibration. The continuum was subtracted from the u-v data using line-free channels and then an HI data cube was created, using uniform weighting. The data were CLEANed in the regions of the channel maps with HI emission and subsequently restored using a Gaussian beam. The beam size is 152 117, which at the distance of NGC 3741 corresponds to approximately 220 pc 170 pc. We also created a low-resolution data cube, with a beam of 60′′ 60′′. In order to separate real and spurious emission, the data cubes were smoothed at about twice the resolution; the regions in these smoothed cubes with emission lower than 2 were blanked. Based on these masked data cubes, total HI maps (moment 0 maps) from the high- and low-resolution cubes were created: they are shown in Figs. 1 and 2.
The integrated HI flux is 59.6 Jy km s-1, which corresponds to an HI mass of M⊙, and a total gas mass (including primordial He) of M⊙. The value of our measured total flux is higher than the single-dish one (Schneider et al. 1992), but it is lower than the value quoted in Begum et al. (2005). However, it is unlikely that we have lost a significant amount of flux due to missing short spacings, because the largest angular scale imaged by the WSRT in the maxi-short configuration is much larger than the size of the emission in the channel maps.
3 Data cube modelling
3.1 Velocity field: a first analysis
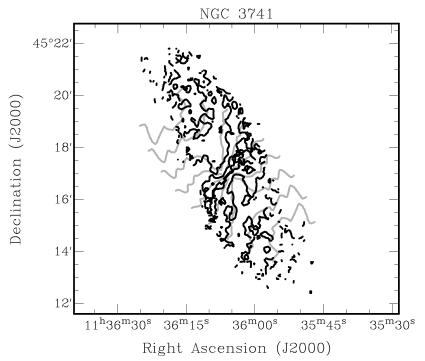
From the above-mentioned data cubes at two different resolutions velocity fields were constructed based on the Modified Envelope Tracing method (Gentile et al. 2004). A first attempt to understand the kinematics of NGC 3741 was made by performing a tilted-ring fit (Begeman 1989) to the abovementioned velocity fields using the task ROTCUR within GIPSY (van der Hulst et al. 1992), and leaving the inclination and position angles as free parameters. This way, the orientation angles were very poorly constrained. In order to obtain a first estimate of the radial run of the position angle, we fixed the inclination at the value of 64∘, the average between the two extremes of the inclination range fitted by Begum et al. (2005); the results are shown in Fig. 3. The kinematical position angles found this way do not agree with the morphological position angles, as can be seen in Figs. 4 and 5. In Fig. 4 we compared a model velocity field based on the parameters derived from the tilted-ring modelling to the observed velocity field: even though the observed and modelled contours are very close to each other, the overall shape of the modelled galaxy does not coincide with the observed one. This points towards a misalignment between the morphological and kinematical position angles and it is a first hint at the presence of non-circular motions, that were not taken into account by Begum et al. (2005).
3.2 Improved orientation parameters
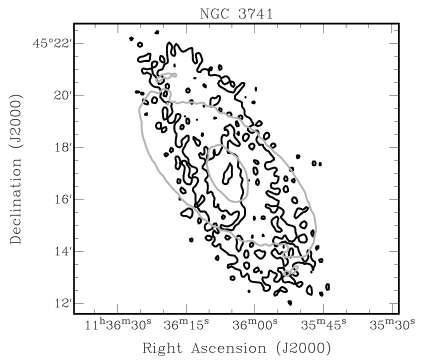
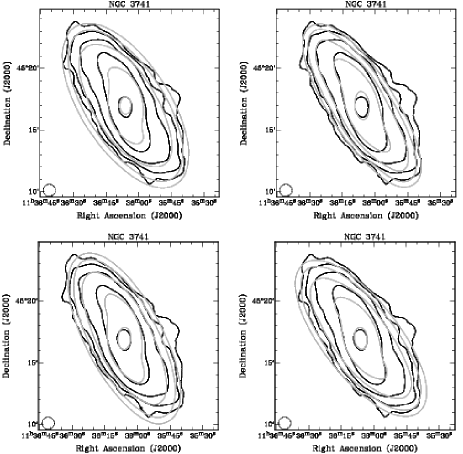
As we have shown in the previous section, the orientation parameters derived from the tilted-ring fit of the velocity field cannot account for the observed data cube. We then built synthetic data cubes (using a modified version of the task GALMOD in GIPSY, Barbieri et al. 2005), which were compared to the actual observations. These model observations are based on a number of geometrical and kinematical parameters that describe the HI disk, such as the rotation curve and the inclination and position angles as a function of radius. The other input parameters are: the central position and the systemic velocity, which can be derived with reasonable accuracy from the observations; the velocity dispersion as a function of radius, which we kept at a fixed value of 6 km s-1, typical of dwarf irregulars (Weldrake et al. 2003); the surface density as a function of radius, which is derived from the total HI map; the scale height of the HI disk, which we assumed to be 300 pc, a typical value for dwarf galaxies; the radial motions as a function of radius. With the choice of parameters from Section 3.1, the position angle was incorrect, and the inclination was underestimated, as can be seen in Figs. 4 and 5. These two parameters were then iteratively changed in order to give a better representation of the total HI map; the results are show in Figs. 6 and 7 for the high- and low-resolution data cubes respectively, in which the models clearly match the data much better. Compared to the position angles shown in Fig. 3, the new ones are different by values ranging from 70∘ in the inner parts to about 15∘ in the outer ones. The inclination was changed to a fixed value of 70∘, in order to obtain good agreement with the total HI maps, both at high and low resolution. The radial dependence of the position angle is shown in the middle panel of Fig. 12. In Fig. 8 we show low-resolution total intensity maps with different choices of the orientation parameters. Based upon these models, we estimate the uncertainty of the inclination and position angles to be about 4∘. In the innermost few data points we conservatively doubled this value, given the smaller number of beams that sample the total HI map and the higher complexity of the HI kinematics and distribution. Note that the assumption of a constant velocity dispersion of 6 km s-1 is consistent with the observations: even though it is apparently increasing towards the centre, a velocity dispersion map of a model data cube with a constant velocity dispersion of 6 km s-1 exhibits a very similar behaviour (Fig. 9), because of the broadening of the velocity profiles due to the beam where the velocity gradients are the largest.
3.3 Harmonic decomposition of the velocity field
In order to account for the kinematics, and therefore to explain the difference between morphological and kinematical position angles, one must resort to non-circular motions. A data cube built with the inclination and position angles that match the total HI map is inconsistent with the observations if non-circular motions are kept to zero (Fig. 10). An estimate of their amplitude can be found by performing a harmonic decomposition of the velocity field (Schoenmakers et al. 1997, Wong, Blitz & Bosma 2004), keeping the position and inclination angles fixed at the values derived in the previous Section, since leaving them as free parameters leads to unconstrained fits. With this method the observed line-of-sight velocity is modelled by
| (1) |
where is the azimuthal angle. In this analysis we considered terms up to . The results are illustrated in Figs. 11 for the high-resolution cube (the low-resolution cube gives similar results), where the component (indicative of radial motions) is non-zero and varies approximately between 5 and 10 km s-1, with a region between 150′′ and 250′′ where they are close to 5 km s-1. The very small values of and indicate that the kinematics of NGC 3741 is very symmetric. Wong et al. (2004) show that an error in the fitted inclination angle causes the term to be proportional to , which seems to be the case here. However, as seen in Fig. 6, the inclination is quite well constrained from the total HI map. We interpret this spurious term as the difference between an analysis that assumes an infinitely thin disk (the harmonic decomposition of the velocity field) and one that takes this effect into account (the data cube modelling). Indeed, within the framework of the harmonic analysis this term would indicate an incorrect value of the inclination. However, the harmonic decomposition assumes an infinitely thin disk: if the disk thickness is actually non-negligible, this assumption will result in an underestimated inclination angle. Therefore, if one fixes the inclination at its correct value (accounting for the thickness of the disk), the output harmonic decomposition procedure will display a spurious “” effect.
Note that the plotted errors in Fig. 11 are formal errors coming from the fitting procedure and they are likely to be smaller than the real uncertainties in the parameters (see e.g. Bureau & Carignan 1999).


3.4 Model data cubes: high resolution
Starting from the results of the harmonic decomposition of the velocity field we built different model data cubes, iteratively improving the input parameters of the models until acceptable results were found. Some parameters were adjusted at an earlier stage (the position and inclination angles), while others (the rotation and radial velocities) needed some additional small changes. An automatic and objective method to fit a model data cube to an observed one, and to estimate the uncertainties in the fit is still a matter of active research (Józsa et al. 2006, in prep.). However, as a first estimate of the kinematical properties we used the most complete objective method available, the harmonic decomposition of the velocity field, whose results were improved by matching visually some key features in the model data cubes to the observed ones. It is possible to associate a to each model but its value cannot be considered for statistical purposes, it can only be a useful tool to compare different models. The reasons are that 1) there is no objective way to define how big the data cube should be or which portion of the cube should be fitted and 2) the clumpiness and inhomogeneity of actual distribution of gas cannot be reproduced in the smooth axisymmetric models shown here.
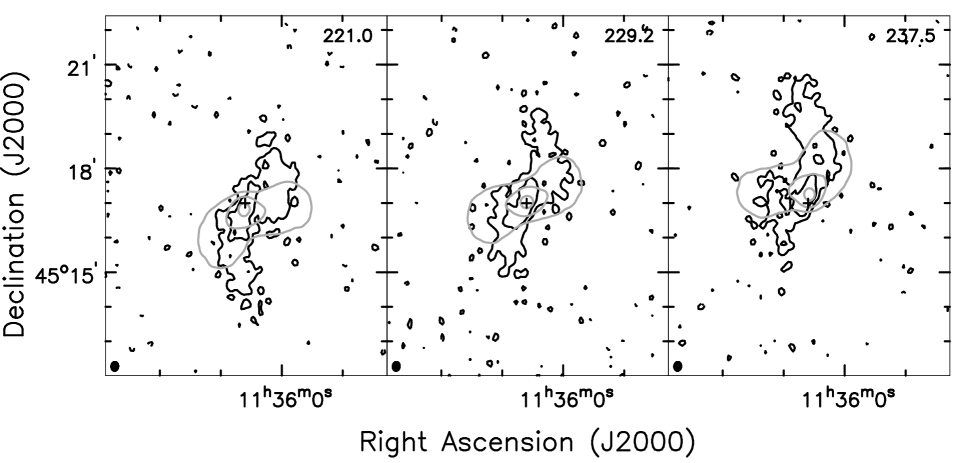
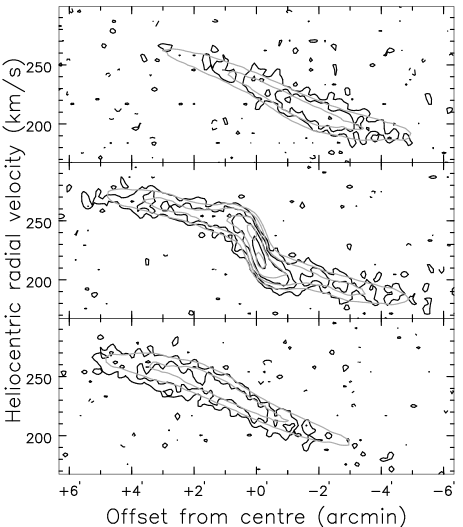
The rotation curve was derived from the tilted-ring fit of the velocity field by only considering those points that are less than 45∘ away from the major axis, while for the radial velocity as a function of radius the whole velocity field was used. It turns out that the value of the rotation and radial velocities had to be slightly modified in the inner parts (compared to the output of the tilted-ring fit to the velocity field) in order to reach a better agreement with the observations. The rotation velocity had to be increased by up to 4 km s-1 in the innermost parts, and to be decreased by 2 km s-1 in the outer parts of the low-resolution cube. The radial velocity was increased by up to 4 km s-1 in the innermost and outermost parts. The comparison between our best model high-resolution data cube and the observed one is shown in Fig. 13. With our choice of input parameters we are able to reproduce all the major features present in the observations. We reiterate that without the introduction of non-circular motions the good agreement would not have been reached, due to the impossibility of reproducing simultaneously the total intensity map (Figs. 1 and 2) and the central channels (Fig. 10). The excellent agreement between the two data cubes is also visible in Fig. 14, in which position-velocity diagrams along the major axis are compared. The only feature that is not well reproduced is the northern part of the emission in channels 237.5 km s-1 to 262.2 km s-1 (receding side, see Fig. 13). However, since the corresponding emission is not present in the approaching channels, it means that it is an asymmetric feature of the galaxy, thus it is not reproducible with our axisymmetric models.
Bearing in mind the caveats discussed above on the use of the statistics, the fact that our preferred model is a better reproduction of the observations (based on the masked cube, see Section 2) can also be seen in the smaller value ( for about 2.1 degrees of freedom) compared to the model data cube built from the first attempt to derive the rotation curve (Section 3.1, ) or compared to the model with the correct orientation angles but no non-circular motions (Fig. 10, ).
A similar procedure was performed to fit the low-resolution cube (see Section 3.5); the results from the low-resolution cube were used for radii larger than 180′′, because of its better signal-to-noise ratio in the outer parts.
3.5 Model data cubes: low resolution
One of the main goals of this paper is to investigate the distribution of dark matter at large radii; we smoothed the high-resolution cube to obtain a beam of 60′′ 60′′ in order to highlight the faint diffuse emission.
Similarly to the high resolution cube, first a tilted-ring fit on the velocity field was performed. Again, the kinematical position angle is different from the morphological one, and it needs to be modified in order to reproduce the data cube. The same procedure as above was applied to look for the best geometrical and physical parameters to describe the observed data cube. The parameters for the inner parts were fixed at the values derived from the high-resolution cube; based on the signal-to-noise ratio of the high-resolution cube, it was decided to only use the high-resolution values up to 180′′. A harmonic decomposition of the velocity field was performed, whose results are not shown because they are similar to Fig. 11. The term in the outer parts is close to 10 km s-1, while the non-zero term is again interpreted as the effect of disk thickness; the inclination is well constrained from the total HI map (Fig. 7).
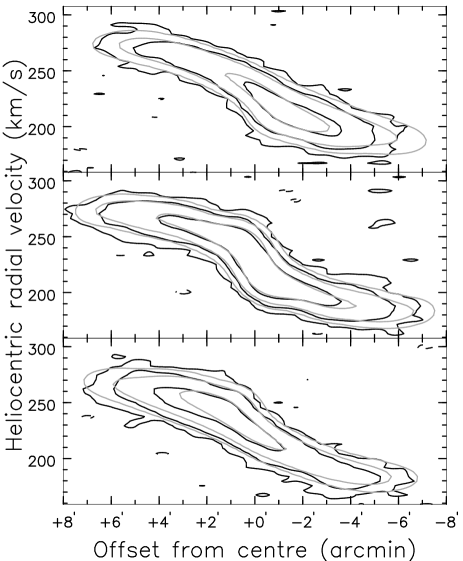
The comparison between the observed and modelled low-resolution total HI maps is displayed in Fig. 7. Again, the agreement between the maps is excellent. As can be seen in Figs. 15 and 16 our choice of parameters enables us to reproduce the observations in detail. Without the introduction of non-circular motions such a good agreement would not have been possible. The final choice of inclination, position angle, rotation velocity and radial velocity is shown in Fig. 12. The parameters from the low-resolution cube were sampled every 30′′ (half the beam FWHM), so that the low- and high-resolution cubes contribute to the final rotation curve with a comparable number of points. Thanks to the exceptional extension of the HI disk, the rotation curve extends out to 6.6 kpc, which correspond to 42 B-band exponential scale lengths (see Fig. 2).
Given the small size of the optical disk (R25 = 307, taken from LEDA, the Lyon-Meudon Extragalactic Database) compared to the beam, and given that the orientation of the optical disk is not very well defined (e.g. the position angle estimates of the optical disk range from ∘, LEDA, to ∘, Vaduvescu et al. 2005), it is hard to define the radius at which the warp commences. According to Briggs (1990), warps usually start around R25. For the final rotation curve we used the values derived from the high-resolution cube out to 180′′, beyond which the low-resolution cube was used.
3.6 Asymmetric drift
We applied the following correction for asymmetric drift, in order to derive the circular velocity from the observed rotation velocity :
| (2) |
where is the one-dimensional velocity dispersion of the gas and is the gas density, which can be derived from the observed surface density distribution under the assumption of a constant scale height. As shown in Section 3.2, the observed velocity dispersion in NGC 3741 is consistent with a constant value of 6 km s-1, which is what we assumed here. The asymmetric drift correction turns out to be smaller than the error bars except for the outermost two data points, where the corrections are respectively 2.7 and 4.8 km s-1. Note that this correction is very uncertain, mainly because we are ignoring the other gaseous components of the ISM, in particular the molecular gas.
In order to estimate the uncertainties in the rotation curve, tilted-ring fits to the velocity fields were made such as those illustrated in Figs. 11, but considering one side of the velocity field at a time. The errors of the final rotation curve were taken to be the geometric sum of half the difference between the approaching and receding sides and half the asymmetric drift correction. A minimum error of km s-1 (half the velocity resolution) was assumed.
4 Non-circular motions
The distribution and kinematics of the HI in NGC 3741 could only be modelled by resorting to non-circular motions (Sect. 3). This is therefore a caveat in the analysis of the dark matter distribution, in that the gas is not in perfect circular motion and the radial component of its velocity, especially in the inner parts, is non-negligible. In the inner 30′′ the non-circular motions that we found are of the same order as the rotation velocity. The innermost points of the rotation curve are also those that give the strongest constraints on the stellar mass-to-light ratio; therefore, the best-fit values inferred in the next section are have larger uncertainties than the formal ones, since the rotation velocity is not likely to be a fair tracer of the circular velocity . The non-circular motions as derived from the harmonic decomposition are around 10 km s-1 between the centre and 80′′, then they drop to about 5 km s-1, between 150′′ and 200′′ they increase again around 10 km s-1. As discussed in Sect. 3, the higher values were increased by a few km s-1 in order to better reproduce the observed data cube, so the range of radial velocities becomes 513 km s-1. Some dwarf galaxies (such as NGC 4605, Simon et al. 2005) exhibit a similar behaviour in terms of non-circular motions, while in others (e.g. DDO 47, Gentile et al. 2005) their amplitude is much smaller. However, the interpretation of these motions is not obvious.
A rough idea can be obtained from the parameters and of the harmonic decomposition (Wong et al. 2004). In the inner regions there is a hint of an anti-correlation between the two parameters, which can be an indication of elliptical streaming. The most likely cause for this kind of motion is an inner bar; Figs. 1 and 6 also suggest the presence of a bar at the centre. In the outer parts the term is very close to zero, which is consistent with a radial flow. In order to disentangle between outflow and inflow we need to know the true orientation of the galaxy, i.e. whether it is rotating clockwise or counterclockwise. In the map of total HI intensity (Fig. 7) there is a hint of spiral structure. Assuming that it is really present and that the spiral arms are trailing, we can infer that the galaxy is rotating clockwise, so the radial flow could be interpreted as an inflow. To try to better understand these radial motions, we separated the galaxy in two parts, dividing along the major axis (because the effect of radial motions is stronger along the minor axis). The radial motions on the north-western side are higher (by 7 km s-1) than on the opposite side, which makes the accretion hypothesis more likely. However, that the magnitude of the motions seems rather high compared to the theoretical expectations (e.g. Blitz 1996 expects an inflow velocity of 7 km s-1 in the outer HI disk of the Milky way). We also note that a full investigation of this phenomenon goes beyond the scope of this paper.
With this assumption, it might be that the material in the outermost regions that is seen having a km s-1 inflow is being accreted onto the galaxy. The consistency of the HI observations with an inner bar and outer accretion can be shown by comparing the and terms: Wong et al. (2004) showed that they can be use to distinguish between a bar (elliptical streaming), where the two terms are anticorrelated, and a radial flow, where is different from zero and is close to zero. We plot the two terms (normalised to ) in Fig. 17, separately for the inner regions (radius smaller than 180′′, using the high-resolution data) and for the outer regions (radius larger than 180′′, using the low-resolution data). In the inner parts the two terms are anticorrelated, suggesting the presence of a bar, while in the outer parts they are uncorrelated, which is consistent with a radial (in)flow.
5 Mass models
The data presented in the present paper allow us to make use of the most extended rotation curve of a galaxy ever measured, in terms of the optical disk scale length. The observed rotation curve , corrected for asymmetric drift, was decomposed into the stellar disk, gaseous disk and dark halo contributions , and via
| (3) |
The shape of the stellar disk contribution is derived from the NIR photometry presented in Vaduvescu et al. (2005). From the K-band photometric profile the contribution of the stellar disk was derived using the task ROTMOD in GIPSY with the assumption of a vertical sech2 distribution having a scale height (van der Kruit & Searle 1981). Its amplitude is scaled using a constant mass-to-light () ratio. From the photometric profile we can exclude any significant contribution from a bulge, because NGC 3741 even shows a brightness deficit at small radii, extrapolating the exponential fit to the inner region. The gaseous disk contribution was derived from the HI observations presented here, multiplying the neutral hydrogen surface density by 1.33 to account for primordial He.
5.1 Stellar disk
The stellar ratio being one of the largest uncertainties in the rotation curve fits, we describe here the attempts we made to put some strong a-priori constraints. Unfortunately, with the present data this was not possible to achieve. Attempts were made using the measured (B-K) colour and the predictions of stellar population synthesis models of Bell & de Jong (2001). We find a predicted K-band stellar ratio of 0.3. We also tried to constrain the stellar ratio by using the predictions of Bell et al. (2003). They only give values based on the observed B-V and B-R colours. By taking the latter value from LEDA (Lyon-Meudon Extragalactic Database) we obtain a K-band stellar ratio of 0.7.
Another attempt at constraining the stellar ratio was made through an estimate of the lower limit of the stellar mass by comparing UBV photometry (NED) plus JK magnitudes (Vaduvescu et al. 2005) with several libraries of SEDs computed with the spectral synthesis code GRASIL (Silva et al. 1998). The observed SED can be well reproduced by several different star formation histories. There are no difficulties in producing an amount of about M⊙ or more in stars as predicted in the cored and in the NFW mass models. Instead, in order to obtain significantly lower masses, i.e. M⊙, and a good fit to the observed SED, there are some requirements to be fulfilled: a peculiar SFR, a delayed formation for 10 Gyr and most of the stars formed in the last 0.5 Gyr. In any case, also accepting this fact, by adopting a standard Salpeter IMF extended from 0.1 to 100 M⊙, we never found that the observed SED implies stellar masses lower than . These results, combined with the estimates from the stellar population synthesis models, induced us to consider in the rotation curve fits a minimum K-band ratio of 0.3, corresponding to a stellar mass of at a distance of 3 Mpc.
We remind, however, that the stellar ratio coming out of the fits is mostly constrained by the innermost two/three data points of the rotation curve, which are also the most affected by non-circular motions, in proportion to the rotation velocity. In the specific example shown in Fig. 18 the stellar mass is . The spectrophotometric determination of the stellar disk mass does not help in discriminating between cored and NFW halos, and it is not decisive against MOND. In any case, the small stellar mass found with these estimates (of the order of M⊙) is an advantage for our aims: uncertainties in the stellar do not have a great influence on the derived dark matter halo profile.
5.2 Dark halo
Concerning the dark matter halo, several alternatives were investigated. In numerous previous studies dark halos with a central constant-density core provided the best fits to the rotation curve. An example of such a cored halo is the Burkert halo (Burkert 1995, Salucci & Burkert 2001); its density distribution is given by
| (4) |
were (the central density) and (the core radius) are the two free parameters.
Then, another fit to the observed rotation curve was performed using the Navarro, Frenk and White halo (NFW), the result of an analytical fit to the density distribution of dark matter halos in CDM cosmological simulations,
| (5) |
Here, and are the characteristic density and scale of the halo. More recent simulations (Navarro et al. 2004) have improved the NFW fit to the CDM halo density distribution, but on scales of radii we are considering here the NFW halo is still a good fit to the outcome of the CDM simulations. The two parameters and are in principle independent, but they were shown to be correlated in simulations (e.g. Wechsler et al. 2002) through the virial mass , the concentration parameter and the critical density of the Universe . The recent third year WMAP results (Spergel et al. 2006) suggest however that the concentration parameters predicted by Bullock et al. (2001) and Wechsler et al. (2002) should be lower, in particular due to the lower . As the “original” relation we considered eq. 18 in Bullock et al. (2001), whose normalisation was lowered by 25%, compatible with 20% used in the model of Dutton et al. (2006), 28% that comes out of Bullock et al.’s CVIR code and 25% found by Gnedin et al. (2006). The relations we used were therefore:
| (6) |
| (7) |
where is the virial overdensity at that can be computed following Bryan & Norman (1998). The scatter in the relation that links to has been reported to be (Bullock et al. 2001), although this value slightly varies from one study to another. We also note that these relations assume a running of the tilt of the power spectrum () of 0, while different values lead to significant changes in the normalisation of these relations.
5.3 MOND
A hypothesis that has been put forward (Modified Newtonian Dynamics, MOND; Milgrom 1983) to explain the absence of a Keplerian decline in rotation curves is that Newtonian gravity does not hold below a certain acceleration , without the need of invoking dark matter. The true gravitational acceleration and the Newtonian one are linked through:
| (8) |
where is an interpolation function that tends to 1 for and tends to for . Traditionally was given the following form:
| (9) |
Recently, Famaey & Binney (2005) proposed the following alternative form of , which, contrary to Eqn. 9, Zhao & Famaey (2006) have shown not to be in contrast with the relativistic MOND theory of Bekenstein (2004):
| (10) |
In both cases, the stellar ratio and the distance were left as free parameters.
5.4 Gas scaling
A noticeable global property of rotation curves of disk galaxies is that the ratio of the gaseous disk and dark matter surface density is approximately constant with radius (Hoekstra et al. 2001). This implies that one can attempt to fit a rotation curve without a dark matter halo by simply scaling up the contribution of the gaseous disk. This fact is important in view of the hypothesis that a substantial fraction of dark matter within the radii reached by rotation curves might reside in a disk, in the form of cold clumps of molecular hydrogen (Pfenniger, Combes & Martinet 1994). Previous studies have shown that this hypothesis does not reproduce the details of observed high-quality rotation curves of spiral galaxies (Gentile et al. 2004), even though it is a remarkable feature of disk galaxies.
6 Results
The results of the mass decompositions are shown in Fig. 19 and in Table 1. The Burkert halo gives a very good-quality fit, with a core radius about five times larger than the optical radius. Its best-fit ratio is quite high, rather poorly constrained and consistent with the spectrophotometric analysis based on the GRASIL code. Also, if the in the B-band is considered, we find very similar values compared to that found by Carignan & Purton (1998) for DDO 154, whose properties (e.g. very large extent of the HI disk, maximum rotation velocity) are similar to NGC 3741. To further test whether reasonable stellar may weaken the support for a cored halo we made a Burkert fit with a fixed (within the range derived by Bell et al. 2003 for blue galaxies): we find that the fit is still very good ().
The NFW fit using Eqn. 6 is poor, with the usual effect of overestimating the dark mass density in the inner parts and underestimating it in the outer parts. Moreover, the best-fit stellar ratio is 0: more realistic values of would only make the fit worse.
If the relation between and is relaxed, a good fit can be made. However, this is achieved at the expense of rather unrealistic (in the context of CDM) best-fit parameters: the best-fit is 6, which is about 2.5 off the predicted relation (corrected for the third year WMAP cosmological parameters). This means that the rotation curve of NGC 3741 can be fitted with an NFW halo but only if it is a 2.5- exception to the - relation. Also, note that in this case the NFW best-fit virial mass is too high ( M⊙) for a galaxy with an observed maximum velocity of 4550 km s-1, even though the constraint on is weak. Moreover, a is difficult to explain even taking the feedback from SN explosions into account.
If the distance is kept as an unconstrained free parameter, the standard MOND fit is almost as good as the Burkert fit, and so is the MOND fit with the new (eq. 10). In both MOND fits the acceleration parameter was kept fixed at cm s-2 (Begeman, Broeils & Sanders 1991). The best-fit distance in the MOND fits is significantly higher than the value quoted by Karachentsev et al. (2004), 3.0 0.3 Mpc, but it is consistent with the distance of 3.5 0.7 Mpc given in Georgiev et al. (1997). The former is more likely to be a reliable distance estimate, as it was made using the tip of the Red-Giant Branch instead of the brightest blue stars, so the high best-fit distance might potentially constitute a problem for the standard MOND (see Table 1). By allowing the distance to vary only within the 3.0 0.3 Mpc range we found that the standard gives a relatively poor fit (, which is however still much better than the constrained NFW fit), while the new gives a better fit (); this fit can be further improved () if is assumed to be 1.35 cm s-2 (see Famaey et al. 2006).
Scaling up the contribution of the gaseous disk gives a reasonably good fit, with a scaling factor for the gas surface density of , in agreement with the results of Hoekstra et al. (2001).
A fit of the rotation curve was also made by assuming that the dark matter density can be described as a power-law (e.g. Simon et al. 2003), defined as . This is not the case in most models of dark matter halos; a power-law fit will therefore provide a sort of average slope of the dark matter density profile over the range of radii probed by the rotation curve. Note that the outcome of such a fit depends on the extension of the rotation curve: a more extended rotation curve will have a steeper average slope. We fixed the stellar mass-to-light ratio at the average value between the two extremes found in the above fits: . This quantity turns out not to have a great influence on , since the disk dominates the kinematics only in the innermost few points. We find and , which however does not mean that NGC 3741 has a cuspy dark matter halo. Indeed, at their respective core radius, a Burkert halo has a , and a pseudo-isothermal halo has . This shows that if the rotation curve extends beyond the core radius (such as in NGC 3741), the average slope, as measured by a power-law fit, will be much steeper than zero. On the other hand, for an NFW halo it is difficult to reproduce an average slope close to -1, since its slope is already -2 at (which is of the same order as the last measured radius of our NGC 3741 observations). See e.g. Fig. 3 of Navarro et al. (2004) for the variation of the density slope with radius in CDM simulations of dwarf galaxies. The only ways to reconcile an NFW profile with the observations are to have a very large , which means that either the virial mass has to be very high, or to decrease the concentration, which is at odds with the CDM predictions in the concordance cosmology.
NGC 3741 has therefore evidence for a cored halo. This could be linked to the presence of a bar. Indeed, barred galaxies seem to have somewhat shallower dark matter density profiles (Swaters et al. 2003), despite the uncertainties in the mass models due to non-circular motions. However, there is no general agreement yet as to whether realistic bars can significantly flatten the cusp (Weinberg & Katz 2002, Sellwood 2006).
| Burkert | 2.97 | |
| 1.65 | ||
| K | 1.51 | |
| 3.47 | ||
| 6.5 | ||
| /Mvir | 3.1 | |
| 0.42 | ||
| Gas scaling | Scaling factor | 12.6 |
| K | 0.30 | |
| 0.69 | ||
| 1.00 | ||
| NFW and free | 1.5 | |
| 6 | ||
| K | 0.44 | |
| 1.01 | ||
| /Mvir | 1.2 | |
| 0.35 | ||
| NFW and | 1.4 | |
| K | 0.30 | |
| 4.44 | ||
| MOND - standard | M/LK | 0.30 |
| Distance | 3.71 | |
| 24 | ||
| 0.52 | ||
| MOND - new | M/LK | 0.30 |
| Distance | 3.51 | |
| 24 | ||
| 0.63 |

7 Conclusions
We have presented the analysis of HI observations of the nearby dwarf irregular galaxy NGC 3741, performed at the WSRT. The HI disk of this galaxy is very extended, the most extended ever observed in terms of optical scale length. The huge extension of the HI disk enables us to trace the rotation curve out to unprecedented distances in terms of the size of the optical disk: the last radius at which we can trace the kinematics is 42 B-band exponential scale lengths, approximately 15 times R25. The HI disk displays a warp, which is very symmetric. In order to derive the distribution and kinematics, we built model data cubes; with our choice of geometrical and kinematical parameters, the observed data cube is reproduced accurately. Some key features in the data cube are characteristic of non-circular motions, whose amplitude turns out to be of the order of 513 km s-1. Their interpretation is non-trivial, but they are consistent with an inner bar and accreting outer material.
Subsequently, the standard rotation curve decomposition was performed. The (cored) Burkert dark halo fits the data very well; the fit performed by taking the dark matter density distribution predicted by the CDM cosmological simulations fits badly, unless the prediction of a correlation between the concentration parameter and the virial mass is relaxed. In this case, however, the price to pay is a concentration parameter 2.5 below the predicted relation and a high virial mass (but poorly constrained) of 1011 M⊙.
Scaling up the contribution of the gaseous disk also gives acceptable fits. MOND, both with the standard interpolation function and with the new one proposed by Famaey & Binney (2005), is also consistent with the observed rotation curve. We also notice that the distance to NGC 3741 might be a potential problem for the standard MOND interpolation function, but not for the new one.


Acknowledgments
GG wishes to thank Filippo Fraternali for his modified version of GALMOD, Ovidiu Vaduvescu for providing the NIR photometric profiles of NGC 3741 and Gyula Józsa for very useful discussions. We thank James Bullock for assistance with his code CVIR, and the anonymous referee for his comments.
References
- Barbieri et al. (2005) Barbieri, C. V., Fraternali, F., Oosterloo, T., Bertin, G., Boomsma, R., Sancisi, R., 2005, A&A, 439, 947
- Begeman (1989) Begeman, K. G., 1989, A&A, 223, 47
- Begeman et al. (19 91) Begeman, K. G., Broeils, A. H., Sanders, R. H., 1991, MNRAS, 249, 5 23
- Begum et al. (2005) Begum, A., Chengalur, J. N., Karachentsev, I. D., 2005, A&A, 433, L1
- Bekenstein (2004) Bekenstein, J. D., 2004, Phys. Rev. D., 70, 083509
- Bell & de Jong (2001) Bell, E. F., de Jong, R. S., 2001, ApJ, 550, 212
- Bell et al. (2003) Bell, E. F., McIntosh, D. H., Katz, N., & Weinberg, M. D., 2003, ApJS, 149,289
- Blitz (1996) Blitz, L., 1996, in 25 Years of Millimeter Wave Spectroscopy, ed. W. B. Latter, S. J. E. Radford, P. R. Jewell, J. G. Mangum, & J. Bally (Dordrecht: Kluwer), 11
- Bremnes et al. (2000) Bremnes, T., Binggeli, B., Prugniel, P., 2000, A&AS, 141,211
- Briggs (1990) Briggs, F., 1990, ApJ, 352, 15
- Bryan & Norman (1998) Bryan, G. L., Norman, M. L., 1998, ApJ, 495, 80
- Bullock et al. (2001) Bullock, J.S., Kolatt, T.S., Rachel, Y.S., Somerville, S., Kravtsov, A.V., Klypin, A.A., Primack, J.R., Dekel, A., 2001, MNRAS, 321, 559
- Bureau & Carignan (1999) Bureau, M., Carignan, C., 1999, AJ, 123, 1316
- Burkert (1995) Burkert, A., 1995, ApJ, 447, L25
- Carignan & Purton (1998) Carignan, C., Purton, C., 1998, ApJ, 506, 125
- de Blok, McGaugh & Rubin (2001) de Blok, W. J. G., McGaugh, S. S., Rubin, V. C., 2001, AJ, 122, 2396
- de Blok & Bosma (2002) de Blok, W. J. G., Bosma, A., 2002, A&A, 385, 816
- Dutton et al. (2006) Dutton, A. A., van den Bosch, F. C., Dekel, A., Courteau, S., 2006, preprint, astro-ph/0604553
- Famaey & Binney (2005) Famaey, B., Binney, J., 2005, MNRAS, 363, 603
- Famaey et al. (2006) Famaey, B., Gentile, G., Bruneton, J.-P., Zhao, H. S., 2006, Phys. Rev. D. subm., astro-ph/0611132
- Gentile et al. (2004) Gentile, G., Salucci, P., Klein, U., Vergani, D., Kalberla, P., 2004, MNRAS, 351, 903
- Gentile et al. (2005) Gentile, G., Burkert, A., Salucci, P., Klein, U., Walter, F., 2005, ApJ, 634, L145
- Georgiev et al. (1997) Georgiev, T. B., Karachentsev, I. D., Tikhonov, N. A. 1997, Lett. Astron. Zh., 23, 586
- Gnedin et al. (2006) Gnedin, O. Y., Weinberg, D. H., Pizagno, J., Prada, F., Rix, H.-W., 2006, preprint (astro-ph/0607394)
- Hayashi et al. (2004) Hayashi, E., Navarro, J. F., Jenkins, A., Frenk, C. S., Power, C., White, S. D. M., Springel, V., Stadel, J., Quinn, T., Wadsley, J., 2004, astro-ph/0408132
- Hayashi & Navarro (2006) Hayashi, E., Navarro, J. F., 2006, MNRAS in press, astro-ph/0608376
- Hoekstra et al. (2001) Hoekstra, H., van Albada, T. S., Sancisi, R., 2001, MNRAS, 323, 453
- Józsa et al. (2006) Józsa, G. I. G., Kenn, F., Klein, U., Oosterloo, T. A., 2006, A&A subm.
- Karachentsev et al. (2004) Karachentsev, I. D., Karachentseva, V. E., Huchtmeier, W. K., Makarov, D. I., 2004, AJ, 127, 2031
- McGaugh, Barker and de Blok (2003) McGaugh, S. S., Barker, M. K., de Blok, W. J. G., 2003, ApJ, 584, 566
- Milgrom (1983) Milgrom, M., 1983, ApJ, 270, 365
- Moore et al. (1999) Moore, B., Quinn, T., Governato, F., Stadel, J., Lake, G., 1999, MNRAS, 310, 1147
- Navarro et al. (1996) Navarro, J.F., Frenk, C.S., White, S.D.M., 1996, ApJ, 462, 563
- Navarro et al. (2004) Navarro, J. F., Hayashi, E., Power, C., Jenkins, A. R., Frenk, C. S., White, S. D. M., Springel, V., Stadel, J., Quinn, T. R., 2004, MNRAS, 349, 1039
- Pfenniger et al. (1994) Pfenniger, D., Combes, F., Martinet, L., 1994, A&A, 285, 79
- Schneider et al. (1992) Schneider, S. E., Thuan, T. X., Mangum, J. G., & Miller, J. 1992, ApJS, 81, 5
- Schoenmakers et al. (1997) Schoenmakers, R. H. M., Franx, M., de Zeeuw, P. T., 1997, MNRAS, 292, 349
- Sellwood (2006) Sellwood, J. A., ApJ submitted, astro-ph/0610468
- Silva et al. (1998) Silva, L., Granato, G. L., Bressan, A., Danese, L., 1998, ApJ, 509, 103
- Simon et al. (2003) Simon, J. D., Bolatto, A. D., Leroy, A., Blitz, L., 2003, ApJ, 596, 957
- Simon et al. (2005) Simon, J. D., Bolatto, A. D., Leroy, A., Blitz, L., Gates, E. L., 2005, ApJ, 621, 757
- Spergel et al. (2006) Spergel, D. N., et al. 2006, preprint (astro-ph/0603449)
- Swaters et al. (2003) Swaters, R.A., Madore, B.F., van den Bosch, F.C., Balcells, M., 2003, ApJ, 583, 732
- Vaduvescu et al. (2005) Vaduvescu, O., McCall, M. L., Richer, M. G., Fingerhut, R. L., 2005, AJ, 130, 1593
- van den Bosch & Swaters (2001) van den Bosch, F.C., Swaters, R.A., 2001, MNRAS, 325, 1017
- van der Hulst et al. (1992) Van der Hulst, J.M., Terlouw, J.P., Begeman, K., Zwitser, W. & Roelfsema, P.R. 1992, in ASP Conf. Ser., Vol. 25, Astronomical Data Analysis Software and Systems I, ed. D. M. Worrall, C. Biemesderfer, & J. Barnes (San Francisco: ASP), 131
- van der Kruit & Searle (1981) van der Kruit, P. C., Searle, L. 1981, A&A, 95, 105
- Wechsler et al. (2002) Wechsler, R. H., Bullock, J. S., Primack, J. L., Kravtsov, A. V., Dekel, A., 2002, ApJ, 568, 52
- Weldrake et al. (2003) Weldrake, D.T.F., de Blok, W. J. G., Walter, F., 2003, MNRAS, 340, 12
- Wong et al. (2004) Wong, T., Blitz, L., Bosma, A., 2004, ApJ, 605, 183
- Zhao & Famaey (2006) Zhao, H. S., Famaey, B., 2006, ApJ, 638, L9