A global 86-GHz VLBI survey of compact radio sources
Abstract:
We present results from a large global VLBI survey of compact radio sources at 86 GHz begun in October 2001. The main goal of the survey was to increase the total number of objects accessible for future 3-mm VLBI imaging by factors of 3 5. The survey data attained the baseline sensitivity of 0.1 Jy, and image sensitivity of better than 10 mJy/beam. To date, a total of 127 compact radio sources have been observed. The observations have yielded images for 109 sources, and only 6 sources have not been detected111 The remaining 12 objects have been detected but could not be imaged due to insufficient closure phase information.. Flux densities and sizes of core and jet components of all detected sources have been measured using Gaussian model fitting. From these measurements, brightness temperatures have been estimated, taking into account resolution limits of the data. Here, we compare the brightness temperatures of the cores and secondary jet components with similar estimates obtained from surveys at longer wavelengths (e.g. 15 GHz). This approach can be used to study the phenomena related to mechanisms of initial jet acceleration (accelerating or decelerating sub-pc jets?) and jet composition (electron-positron or electron-proton plasma?).
1 Observations
Millimetre-wavelength VLBI (mm-VLBI) provides a unique tool for exploring the physical nature of compact radio sources. The higher resolution222Global VLBI observations at 86 GHz offer about 6 times better resolution than space VLBI observations at 5 GHz. of VLBI observations at millimetre wavelengths allows us to image directly the VLBI core and the knots with subparsec-scale resolution. Furthermore, in AGN, synchrotron radiation becomes optically thin at wavelengths between 1 cm and 1 mm [1]. Therefore, the mm-VLBI imaging makes it possible to look deeper into the VLBI cores that are invisible at centimetre wavelengths. The first detection of single-baseline interference fringes of 89 GHz (3.4 mm) VLBI observation was reported by [2], demonstrating the feasibility of 3-mm VLBI. A decade later, the first global mm-VLBI array, the Coordinated Millimeter VLBI Array (CMVA), was established in 1995 with support from radio observatories throughout the world. The number of participating telescopes gradually increased up to 12. The CMVA discontinued to organize mm-VLBI experiments in 2002. Since then, the activity of mm-VLBI experiments has been continued through the Global mm-VLBI Array (GMVA). The GMVA carries out regular, coordinated global VLBI observations at 86 GHz, providing good quality images with a typical angular resolution of 50-70 micro-arcseconds (). In order to increase the number of objects imaged at 86 GHz, four detection and imaging surveys have been conducted to date, with a total of 124 extragalactic radio sources observed at 86 GHz (see [3], [4], [5], [6]). Fringes have been detected in 44 objects, but only 24 radio sources have been successfully imaged so far. Table 1 gives an overview of the VLBI surveys at 86 GHz. The survey presented here was envisaged as a project that would increase the number of objects imaged at 86 GHz by a factor of 3 to 5.
The source selection of this survey was based on the results from the VLBI surveys at 22 GHz [7], 15 GHz [8], and on source fluxes obtained from the multifrequency monitoring data from Metsähovi at 22, 37, and 86 GHz [9] and from Pico Veleta at 90, 150, and 230 GHz (Ungerechts, priv. comm.). Using these databases, we selected the sources with expected flux density above Jy at 86 GHz. We excluded some of the brightest sources already imaged at 86 GHz, and focused on those sources that had not been detected or imaged in the previous surveys. In order to optimize the uv-coverage of the survey data, sources at higher northern declinations () were preferred. According to the aforementioned selection criteria, a total of 127 compact radio sources were selected and observed.
The survey observations were conducted during three global mm-VLBI sessions on October 2001, April 2002 and October 2002. The participation of the large and sensitive European antennas (the 100-m radio telescope at Effelsberg, the 30-m mm-radio telescope at Pico Veleta, the 615-m interferometer on Plateau de Bure) resulted in a typical single baseline sensitivity of Jy and an image sensitivity of better than 10 mJy/beam. Every source in the survey was observed for 3-4 scans of 7-min duration (snapshot mode). The data were recorded either with 128-MHz or 64-MHz bandwidth using the MkIV VLBI system with 1- and 2- bit sampling adopted at different epochs. The observations were made in left circular polarization (LCP). 3 to 4 scans per hour were recorded, using the time between the scans for antenna focusing, pointing and calibration. The data were correlated using the MkIV correlator of Max-Planck-Institut für Radioastronomie (MPIfR) in Bonn. Fringes were searched with the HOPS package fourfit and AIPS333The NRAO Astronomical Image Processing System. task FRING. The amplitude calibration was made using the system temperature, antenna gain, and opacity measurements carried out at each station during the observations. The AIPS task APCAL was used to calibrate the amplitudes. From the phase- and amplitude-calibrated data, the images were made using DIFMAP software [10]. The detailed description of the fringe-fitting and imaging will be given in [11].
| Surveys | |||||||
| (1) | (2) | (3) | (4) | (5) | (6) | (7) | (8) |
| 1 | 3 | 0.5 | … | … | 45 | 12 | … |
| 2 | 25 | 0.7 | … | … | 79 | 14 | … |
| 3 | 69 | 0.5 | 30 | 70 | 67 | 16 | 12 |
| 4 | 35 | 0.4 | 20 | 100 | 28 | 26 | 17 |
| Total number of unique objects: | 124 | 44 | 24 | ||||
| Properties of this survey: | |||||||
| 1214 | 0.2 | 10 | 50 | 127 | 121 | 109 | |
Notes: Columns: 1 – references of previous VLBI surveys at 86 GHz; 2 – number of participating antennae; 3 – average baseline sensitivity [Jy]; 4 – average image sensitivity [mJy/beam]; 5 – typical dynamic range of images; 6 – number of sources observed; 7 – number of objects detected; 8 – number of objects imaged. References of surveys: 1 – [3]; 2 – [4]; 3 – [5]; 4 – [6].
2 Images

We have detected 121 sources and have produced hybrid maps of 109 sources for which the data contain a sufficiently large number of uv-points. Out of 109 sources, 90 sources are imaged for the first time at 86 GHz, increasing the number of sources ever imaged with 86-GHz VLBI observations up to 110. To illustrate our results, we present here the images for two relatively weak objects. These are the first 3-mm VLBI maps for the respective sources. For each image, plots of the uv-coverage and of the visibility amplitudes against uv-radius are presented. Here we report details on two sources.
0016+731:
The image in Figure 1 (top, right) shows two jet components
along the different directions,
and ,
appearing to be bent to the southeast.
The direction of the jet is in a good
agreement with the VLBI images of 0016+731 obtained
at 43 GHz [12]
and 15 GHz [13]. The peak flux density
is 0.196 Jy/beam with a beam size of mas
and the lowest contour level is 9.8 mJy.
The brightness temperature () of the core component
is ( K.
Since the source
is at high declination, the uv-sampling (shown in the left
panel) is nearly circular resulting in a very regular restoring beam.
A decrease of the visibility amplitude
with the uv-distance (middle panel) indicates that
the source is resolved.
1923+210:
In the image in Figure 1 (bottom, right), we identify one feature
in the jet extending along
, which is similar to the orientation
of the jet observed at lower frequencies[14].
The peak flux density is 0.301 Jy/beam, with a beam size
of mas, and the lowest contour level is 12.0 mJy.
The brightness temperature of the core component is ( K.
3 Brightness temperature and jet physics
Using the Gaussian-model fitted images of 109 sources, we have
determined basic properties of the core and jet components
for all of the imaged sources: total flux density, ,
peak flux density, , post-fit rms, , size, ,
radial distance, (for jet components),
and position angle, (for jet components).
For all parameters,
the uncertainties of measurements have been obtained, taking into account
the resolution limits [15]:
| (1) |
which is the minimum resolvable size of a component in an image.
The minimum resolvable size depends on the axes of the restoring beam, a and b, and
the signal-to-noise ratio, SNR. The weighting function, , is 0 for natural weighting
or 2 for uniform weighting. The observed brightness temperature, , of a component in the
rest frame of the source is given by:
| (2) |
where is the wavelength of observation, is the redshift, and is the
Boltzmann constant.
If , then the lower limit of is obtained
with . The observed brightness temperatures can be used to study the physics of
the relativistic jets. One of the applications is to model the observed distribution of
by a population of jets in which all jets are randomly oriented and
have the same Lorentz factor, , the same
spectral index, , and the same intrinsic brightness temperature, (see [6]).
Since the orientation of the jets is random, and the observed distribution of is caused
only by Doppler boosting, the predicted distribution should be corrected for the bias due to
the Doppler boosting. Lobanov et al. [6] applied this approach to a smaller sample
of VLBI images at 86 GHz, inferring the range of K that reproduces
the observed distribution in the VLBI cores. We expect a similar result for our larger sample.
Another application is to study the intrinsic brightness
temperatures of the VLBI cores, by using the observed at 86 GHz from our survey and
the maximum apparent jet speeds at 15 GHz taken from [8].
In order to constrain the intrinsic brightness temperature,
the method from [16] could also be applied to our sample.
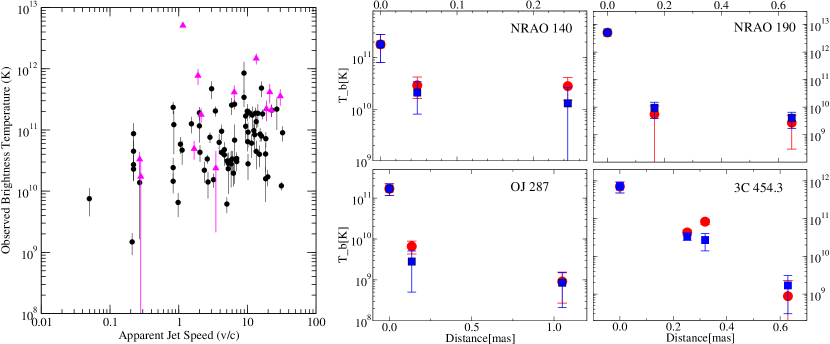
In the left panel of Figure 2,
we can see a hint of correlation of the observed brightness temperatures of the VLBI cores
with the maximum apparent jet speeds of the jets measured at 15 GHz.
The right panel of Figure 2 shows the profile of along the main jet direction.
The values of brightness temperatures in the jets predicted assuming adiabatic expansion
in a relativistic plasma [6] agree well
with the observed brightness temperatures.
Using these three approaches to analyze the 86-GHz data,
we hope to be able to further constrain physical models proposed to explain
the nature of compact relativistic jets.
Acknowledgements
We gratefully thank the staff of the observatories participating in the GMVA; the MPIfR Effelsberg 100-m telescope, the two IRAM telescopes on Plateau de Bure and Pico Veleta, the Metsähovi Radio Observatory, the Onsala Space Observatory, and the VLBA. The VLBA is an instrument of the National Radio Astronomy Observatory, which is a facility of the National Science Foundation operated under cooperative agreement by Associated Universities, Inc.
References
- [1] J. A. Stevens, S. J. Litchfield, E. I. Robson, D. H. Hughes, W. K. Gear, H. Teräsranta, E. Valtaoja, and M. Tornikoski, Multifrequency observations of blazars. 5: Long-term millimeter, submillimeter, and infrared monitoring, ApJ 437 (1994) 91
- [2] A. C. S. Readhead, C. R. Mason, A. T. Moffet, et al., Very long baseline interferometry at a wavelength of 3.4 mm, Nature 303 (1983) 504
- [3] A. J. Beasley, V. Dhawan, S. Doeleman, and R. B. Phillips, CMVA Observations of Compact AGNs, Proceedings of Millimeter-VLBI Science Workshop (1997) 53
- [4] C. J. Lonsdale, S. S. Doeleman, and R. B. Phillips, A 3 Millimeter VLBI Continuum Source Survey, AJ 116 (1998) 8
- [5] F. T. Rantakyrö, L. B. Baath, D. C. Backer, et al., 50 MU as resolution VLBI images of AGN’s at lambda 3 MM, A&AS 131 (1998) 451
- [6] A. P. Lobanov, T. P. Krichbaum, D. A. Graham, et al., 86 GHz VLBI survey of compact radio sources, A&A 364 (2000) 391
- [7] G. A. Moellenbrock, K. Fujisawa, R. A. Preston, et al., A 22 GHz VLBI Survey of 140 Compact Extragalactic Radio Sources, AJ 111 (1996) 2174
- [8] K. I. Kellermann, R. C. Vermeulen, J. A. Zensus, and M. H. Cohen, Sub-Milliarcsecond Imaging of Quasars and Active Galactic Nuclei, AJ 115 (1998) 1295
- [9] H. Teräsranta, M. Tornikoski, A. Mujunen, et al., Fifteen years monitoring of extragalactic radio sources at 22, 37 and 87 GHz, A&AS 132 (1998) 305
- [10] M. C. Shepherd, T. J. Pearson, and G. B. Taylor, Software Report: DIFMAP, Owens Valley Radio Observatory, BAAS 26 (1994) 987
- [11] Sang-Sung Lee, A Global 86 GHz VLBI Survey of Compact Radio Sources, PhD Thesis at University of Bonn, in prep.
- [12] M. Lister, Parsec-Scale Jet Polarization Properties of a Complete Sample of Active Galactic Nuclei at 43 GHz, ApJ 562 (2001) 208.
- [13] M. Lister and D. C. Homan, MOJAVE: Monitoring of Jets in Active Galactic Nuclei with VLBA Experiments. I. First-Epoch 15 GHz Linear Polarization Images, AJ 130 (2005) 1389.
- [14] A. L. Fey and P. Charlot, VLBA Observations of Radio Reference Frame Sources. III. Astrometric Suitability of an Additional 225 Sources, ApJS 128 (2000) 17.
- [15] A. P. Lobanov, Resolution limits in astronomical images, A&A, submitted (astro-ph/0503225).
- [16] D. C. Homan, Y. Y. Kovalev, M. L. Lister, et al. Intrinsic Brightness Temperatures of AGN Jets, ApJ, 642 L115.