Giant Ringlike Radio Structures Around Galaxy Cluster Abell 3376
In the current paradigm of cold dark matter cosmology, large-scale structures are assembling through hierarchical clustering of matter. In this process, an important role is played by megaparsec (Mpc)-scale cosmic shock waves, arising in gravity-driven supersonic flows of intergalactic matter onto dark matter-dominated collapsing structures such as pancakes, filaments and clusters of galaxies. Here we report Very Large Array telescope observations of giant ( Mpc Mpc), ring-shaped non-thermal radio emitting structures, found at the outskirts of the rich cluster of galaxies Abell 3376. These structures may trace the elusive shock waves of cosmological large scale matter flows, which are energetic enough to power them. These radio sources may also be the acceleration sites where magnetic shocks are possibly boosting cosmic-ray particles with energies of up to to electron volts.
A large fraction () of the baryon mass of the universe at the present epoch resides in a tenuous gas phase known as the warm-hot intergalactic medium (WHIM) (?). Although the WHIM is heated to to K by intergalactic shocks, its direct detection is very challenging owing to its low density and temperature. The main tracers of this gas are highly excited oxygen lines mainly visible in soft X-rays and the far ultraviolet, whose emission or absorption signal is well below the sensitivity threshold of the current instruments. Alternatively, the supersonic infalls and resulting shock waves propagating in the magnetized inter-galactic medium (IGM) or WHIM around galaxy clusters and filaments can be probed by the synchrotron and inverse-Compton radiation emitted by energetic electrons accelerated at the shock fronts (?, ?). For particles to be shock accelerated, magnetic fields need to be present at the shocks for generation of Alfven waves (transverse waves moving along magnetic field lines embedded in an electrically conducting fluid), and to-and-fro scattering of particles across the shock front by wave-particle interactions [the so called diffusive shock acceleration process (?)]. The origin of cosmic magnetic fields is currently unknown (?), and so any observational evidence for them in the IGM environment is of great importance. Magnetic fields (G) are observed in the denser, and hotter (relative to WHIM) intra-cluster medium (ICM) of clusters of galaxies by means of the Faraday effect, causing rotation of the plane of polarization of light of the background radio sources (?). Magnetic fields are further revealed by the presence of cluster-wide Mpc scale (1 Mpc = cm) radio-halos and peripheral radio-relics (?, ?) (both are large-scale diffuse radio sources, having no optical counterparts and no obvious connection to the galaxies in clusters) in a few clusters of galaxies. Radio-halos and radio-relics are believed to be the result of synchrotron emission of relativistic electrons shock accelerated in cluster mergers (?).
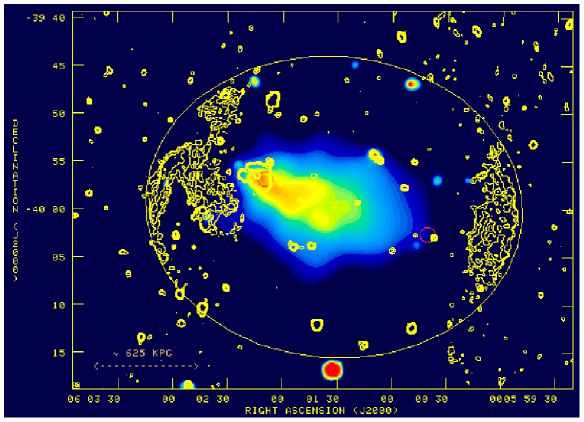
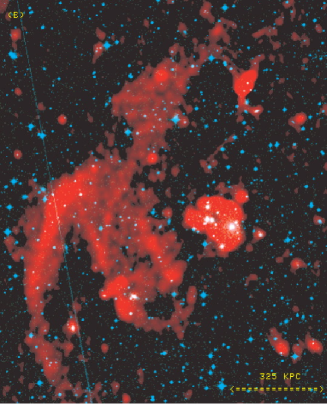
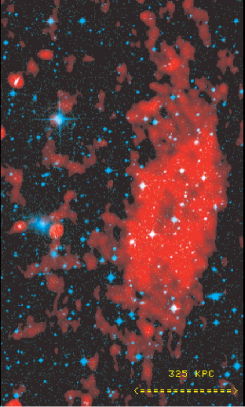
We have discovered with the Very Large Array (VLA) telescope at 1.4 GHz frequency, a large-scale [ Mpc (?)] ringlike synchrotron radio emission structure, possibly tracing the intergalactic shocks around a rich cluster of galaxies Abell 3376 at redshift z=0.046 (?). The southern galaxy cluster Abell 3376 was observed with the VLA, a Y-shaped interferometric array of 30 25-meter-diameter radio telescopes located on the plains of San Agustin in Socorro, New Mexico, the United States (?). Figure 1 shows the most important findings; a pair of giant, “arc” shaped diffuse radio-emitting sources, each with a linear dimension Mpc, located at the outskirts of this cluster at the projected distance of Mpc from the cluster center. In addition, the eastern structure shows several more thin filamentary structures behind the radio arc, and a peculiar loop-like feature joining two linear filaments (Fig. 1). This radio image is the result of combining data in the VLA CnB and DnC hybrid configurations, having the sensitivity for mapping diffuse, large-scale emissions, as well as the angular resolution (20 arc sec) for identifying the superposed background point sources (?). The VLA radio image shown has Jy per beam of root mean square noise background, and the estimated signal-to-noise ratio for detection of these giant radio arcs ranges from at the faintest contour to at the peaks (after removing a few superposed background point sources, which are visible in Fig. 1). Noticeably, both radio structures are positioned with their concave side facing the cluster center, and,- they fit quite well on the surface of a large, projected elliptical ringlike formation of dimension Mpc Mpc, oriented in position angle . The center of this ellipse falls at the position R.A. , and Dec. , which is taken as the center of symmetry of this cluster (marked ‘+‘ in Fig. 1). No other ”radio-halo” type of diffuse, large scale emission was found near the cluster center down to the surface brightness limit mentioned above.
The luminous thermal bremsstrahlung X-ray emission detected by the Position Sensitive Proportional Counter (PSPC) detector onboard the Roentgen Satallite (ROSAT) is shown in Fig. 1 (in the 0.14 to 2.0 keV band). In the central region, it reveals a highly disturbed, non-equilibrium state of the intra-cluster thermal gas, which is obviously extended like a “comet” or “bullet-head”, its wake extending along the major axis of the elliptical radio structure described above. Both radio sources are located on the outer periphery of the X-ray emission observed by ROSAT, which has an unblocked field of view of 17.5 arcmin radius. From galaxy redshift measurements in Abell 3376, a filamentary structure composed of at least three major galaxy groups is found, oriented along the general elongation of X-ray emission mapped by ROSAT and XMM-Newton (XMM: X-ray Multi Mirror Mission). (?, ?).
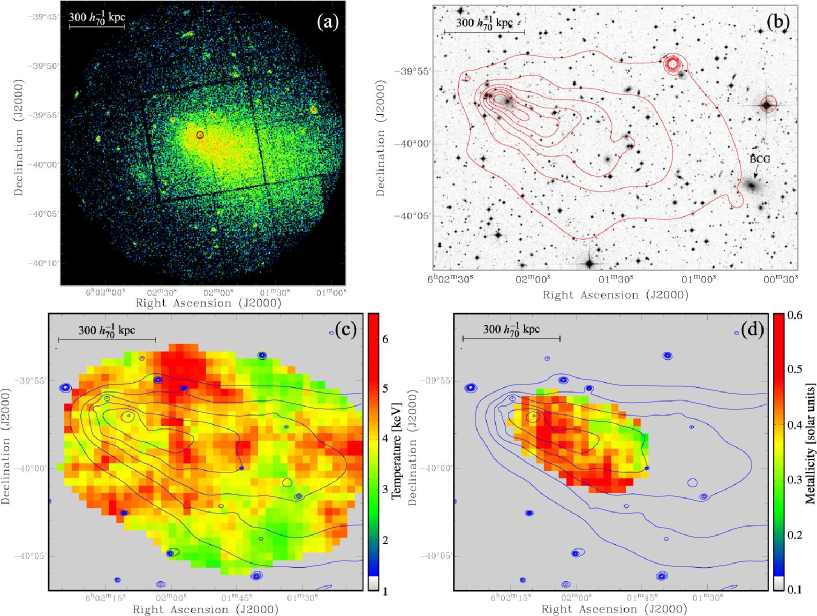
XMM-Newton and ROSAT X-ray observations (?) shown in Fig. 2 reveal strong evidence for merger activity of subclusters along this filamentary axis. The field of view of XMM is a circle of radius 15 arcmin, and the image shown is in the 0.3 to 8.0 keV band. The XMM map of Fig. 2 is quite similar to the ROSAT image in Fig. 1, but it shows more clearly the “bullet-head” and multiple X-ray peaks to the south south-west of it, each one probably associated with a merging group. The X-ray temperature map (Fig. 2) and has typical errors of about 10 percent. This map reveals an overall temperature of about 5 keV ( K), with several alternating hot and cold regions crossing the cluster, divided by a prominent “cold-arc” at about 3 keV, which originates at the north edge and curves southward toward the east. The most plausible scenario is that a large group or a small cluster is falling onto the main body of the cluster from the east-northeast, thus creating hotter regions through a shock. Such a scenario would agree with the second-brightest galaxy on the X-ray peak associated with the strong radio source MRC 0600-399, of which both radio-jets are bent backwards towards east-northeast, away from the “bullet”, suggesting an infall and ram pressure on radio jets from a gaseous “wind” blowing from the west-southwest direction along position angel (Fig. 1, detailed image in fig. S1). The dominant elliptical galaxy in Abell 3376 is located in the south-west subcluster, arc min ( Mpc) from the X-ray peak (Fig. 2). The highly asymmetrical metal distribution [mainly iron, about errors (?)] near the center also suggests a violent and recent dynamical event, where the gas is not well mixed and we observe patches of high and low metallicity (Fig. 2; metallicity profile in fig.S2).
What is the energy source that could possibly power such giant radio structures ? Any electron acceleration process must be at least energetic enough to account for erg/s of radio emission observed at the frequency GHz (sum of radio luminosity of two sides). First, there is no evidence that any optical galaxy is obviously associated with the radio arcs (Fig. 1), and it is unlikely that these arcs are the usual cluster radio galaxies. On the other hand, these radio structures could be generic to radio relics known to occur in certain merging clusters (?, ?), although such double relics are rare. Another very similar configuration of Mpc-scale binary radio relic arcs is found in the well known merging galaxy cluster Abell 3667 ( (?)). Second, initial acceleration at a central active-galactic-nucleus like point source and particle transport by diffusion across a Mpc scale is not possible. The radiative energy loss timescale for an electron of relativistic Lorentz factor is [assuming only inverse Compton scattering (IC) on the ambient 2.7 K background and a weak magnetic field G], and the diffusion length within the IC cooling time: pc Mpc, the scale of the observed radio arcs [here , the Bohm diffusion coefficient, for scattering on saturated field fluctuations]. The discrepancy between the Bohm diffusion length-scale and the radio structure size is so large that, even with the inclusion of advective transport by bulk flows and more effective diffusion in ordered magnetic fields, electrons are still unable to cross the emission region within a radiative life-time. Electrons must be accelerated to ( GeV) for synchrotron emission at frequency GHz in a magnetic field B=1 G (). Sparse observations (?) and simulations (?) of magnetic fields in the diffuse IGM at the cluster outskirts and within filaments suggest that to G. In this situation the synchrotron loss timescale is , and IC radiation is the dominant cooling process.
Clearly, the detection of these large radio structures at Mpc distances from the cluster center inevitably requires some form of in situ acceleration mechanism for particles and the magnetic field powering them. The detected structures cannot result from the chance superposition of background radio point sources which are very few ( sources per arcmin2 above 1 mJy flux density), and most of the emission is truly diffuse. Lastly, it is very unlikely that these diffuse sources are the radio-lobes of a currently active giant radio galaxy (GRG), because to mJy/beam surface brightness limit ( signal) no radio jets or plumes connect the radio sources with any central optical galaxy, and GRGs of such extreme size ( Mpc) are not commonly found (?). On the other hand, their concave bow-shock like structure, symmetric and tangential juxtaposition on the merger axis - tangential both to the chain of sub-clusters of galaxies and to the X-ray emission elongation axis (Fig. 1) - strongly supports association of these arcs with the cluster,- and suggests their origin in a cosmological-scale energetic event linked to the cluster formation process.
Hydrodynamical simulations show that only shock waves induced in structure formation processes are sufficiently extended, long-lived, and energetic to overcome the strong radiation losses of the relativistic electrons over a Mpc-scale, rapidly accelerating them to relativistic energies (?, ?), which could emit synchrotron radio emission at the level observed (?). These ubiquitous shocks are an inevitable consequence of gravitational collapse, and they are pivotal to virialization of diffuse IGM. Two competing shockwave inducing mechanisms are plausible: (i) outgoing “merger shocks” emanating from the cluster center, induced by mergers of subclusters; and (ii) the accretion flows of IGM and associated “accretion shocks” near the virial radius. We briefly mention both these plausible models because their observational signatures - which cannot be discerned in the present data - are very similar.
In the merger shock model, a pair of outgoing, merger-generated shock waves (?) could have created these diffuse radio sources on the outskirts of Abell 3376 by compressing and accelerating a pre-existing lower energy “fossil” electron population (?). It takes years for shock fronts to cross the -Mpc distance from the cluster center (at the ‘+’ mark in Fig. 1) if the shock speed is km/s. The merger shock model adequately explains the extended steep-spectrum radio arcs and elongated X-ray structure found in a well-studied cluster Abell 3667 (?). This is a plausible model given the striking resemblance of Abell 3376 and Abell 3667, both of which provide strong evidences for mergers and have similar X-ray and radio morphologies (?). The peripheral location of quasi-ring-like radio arcs and the absence of a central radio halo in Abell 3376 agree with simulations of merger shocks [ (?); and fig. S3].
In the accretion model, these giant radio structures could be tracing the accretion shocks from infall of IGM at the outskirts of the cluster Abell 3376. An accretion shock at the virial radius propagates outward while infalling gas crosses it inward supersonically, which could lead to shock acceleration of particles and radio emission if the infalling gas is magnetized [as in (?)]. The virial radius is , where is the ratio of mass density to critical density (?) inside a dissipationless, spherical, collapsing virializing halo of mass M at redshift z. In Λ Cold-Dark-Matter and Einstein-de Sitter ( (?)) cosmologies and respectively, at (?), implying that 1.4 to 1.7 Mpc for Abell 3376,- and the cluster virial mass is solar masses () (?). This exceeds the observed -Mpc distance at which radio sources are found, possibly due to a non spherical filamentary geometry (Fig. 1) and an apparent linear foreshortening due to projection on the observer’s sky plane.
Recent hydrodynamical simulations reveal an intergalactic shock structure more complex than assumed in a simple spherical accretion model described above. Around rich clusters these shocks (both accretion and merger) do not form fully illuminated rings (in projection), but they are strongest along the axes where filaments funnel the IGM deep into the forming clusters (?, ?). Along the same directions, high-speed mergers of subclusters (with merger shocks) may take place, as observed here and in cluster Abell 3667 (?). This may provide a clue to the origin of the radio structures observed in Abell 3376, which are located on an elliptical ring-like formation in projection (Fig. 1), yet only sections of this ring are actually illuminated along an axis, where X-ray data clearly show that mergers and infalls are taking place and where shocks are strongest, leading to more efficient particle acceleration. The actual three dimensional morphology could be like a “bubble” or “egg-shell” on the surface of which the shocks are located within a narrow zone. Some recent numerical simulations of structure shocks around similar massive galaxy clusters ( to ) do predict this quasi ring-like geometry of non thermal radiation (?, ?).
Therefore, in the giant radio structures discovered in Abell 3376 (and Abell 3667), we are probably witnessing the first observational evidence for merger or accretion (or even both) shocks near the sparsely studied virial infall region of a massive galaxy cluster. These shocks are an important probe of the gas dynamics at the transition zone between the hot cluster medium and cold WHIM gas. The Mach numbers () associated with these shock structures are not known as yet. Their estimation requires temperature data on both sides of the shock to fit Rankine-Hugoniot equations. For an intergalactic shock at the cluster outskirts in cold medium, simulations predict high Mach numbers [ (?)], and the pre and post shock temperatures , and are related as in a gas of specific heat ratio . Setting K, the virial temperature () for the virial mass of the cluster, the temperature of the infalling gas spans the range K, for between 50 and 5. This is close to the expected temperature range of WHIM gas (?), although too cold to be detectable in a keV-band X-ray observation (Fig. 1).
The exact physical mechanism of the electron acceleration is yet to be revealed, but diffusive shock acceleration (DSA) is a strong possibility, which explains the Mpc scale diffuse radio emission from the filamentary proto-cluster ZwCl 2341.1+0000 (?). In DSA, the time scale for a particle (electron, proton, or a heavier ion) to reach energy E is (?); year (for a strong shock of , and Bohm diffusion). Here, =, = km s-1), =, and is the ionic charge ( for electron or proton). For cosmic-ray protons, which suffer negligible radiative losses below 50 EeV, the highest acceleration energy, , is limited only by the finite lifetime of shocks, i.e., to years (here, is the time scale for merger), thus giving eV. Heavier ions carrying more charge (for example, 26Fe) could be accelerated up to much larger energy, limited by loss processes. For cosmic-ray electrons, substantial radiative losses would limit their energy to a maximum eV. Lower-energy electrons of GeV would radiate the observed 1.4 GHz synchrotron radio emission. The sketched scenario is consistent with hydrodynamical simulations (?), which show that during gravitational infall and violent mergers in clusters, protons can be accelerated up to the energy eV, if a turbulent magnetic field of 0.1 to 1 is available, and if a fraction about of the infalling kinetic energy can be injected into intergalactic medium as high-energy particles. Our estimate of the minimum energy magnetic field () within the radio-arc regions in Abell 3376 is to 3.0 G, which depends on model parameters (?).
Our observations here represent a substantial advance in the field, because they probe several important components of the cosmic environment: intergalactic gas, magnetic fields and cosmic-rays. They indicate that magnetic fields of appreciable strength are present not only in the ICM but also in the diffuse inter galactic medium, i.e., in the gas that will be shocked as it accretes onto collapsing structures - the precursors of virialized galaxy clusters. These magnetic fields are necessary for providing the scattering centers for the diffusive shock acceleration mechanism, and also for the synchrotron emission that we have observed. Because it is not obvious how magnetic fields are amplified up to such large values along filaments, our observation poses further challenges to theoretical models (?, ?).
On the other hand, as we show in this work, if diffusive shock acceleration takes place with some efficiency during the non-linear stage of large-scale structure formation, cosmic-ray ions accumulating in the forming structure could become dynamically important (?). Objects like Abell 3376 could be acceleration sites for cosmic-rays, where magnetized shocks are possibly boosting hadronic particles to relativistic energies up to to eV. Downstream from the shocks (toward the cluster center), accelerated protons will be transported by diffusion and advection, over a length scale () comparable to the cluster size, Mpc, under the Bohm diffusion regime (?). These protons will remain trapped within the cluster volume for a time scale comparable to the age of the cluster until their energy approaches eV. Inverse Compton scatter of the 2.7 K cosmic microwave background photons from both primary electrons accelerated in shocks and from secondary electrons originating in hadronic processes (mainly pion decay and pair production), will give rise to photons of energies GeV (where is the electron Lorentz factor in units of ). This inverse Compton spectrum could extend upto TeV, limited by a likely high-energy cut-off in the electron energy spectrum. Radiation from primary electrons would trace the current shock locations, owing to their short radiative cooling time. This tell-tale radiation might be detectable with hard X-ray (SUZAKU, NEXT), or 1 MeV to 100 GeV -ray (GLAST), or high-energy TeV -ray (CANGAROO, MAGIC, VERITAS, HESS) telescopes, opening a new window on the non-thermal processes in cosmological large-scale flows.
References and Notes
- 1. R. Cen, J. P. Ostriker, Astrophys. J. 519, L109 (1999).
- 2. J. Bagchi, et al., New Astronomy , 7, Issue 5, 249 (2002).
- 3. U. Keshet, E. Waxman, A. Loeb, Astrophys. J. 617, 281 (2004).
- 4. L.O’C. Drury, Rep. Prog. Phys. 46, 973 (1983).
- 5. C. L. Carilli, G. B. Taylor, Ann. Rev. Astron. and Astroph. 40, 319 (2002).
- 6. T. E Clarke, P. P. Kronberg, H. Böhringer, Astrophys. J. 547, L111 (2001).
- 7. J. Bagchi, V. Pislar, G. B. Lima Neto, Mon. Not. R. Astron. Soc. 296, L23 (1998).
- 8. G. Giovannini, L. Feretti, J. of the Korean Astron. Soc. 37, 323 (2004).
- 9. T. A Enßlin, P. L. Biermann, U. Klein, S. Kohle, A & A 332, 395 (1998).
- 10. We have used a Hubble constant of h 70 km/(s Mpc), where h is a dimensionless scaling parameter. We adopt a “concordance” model of big bang cosmology: the -CDM (lambda cold dark matter) cosmological model defined by matter (dark matter + baryonic matter) density , and dark energy (denoted by cosmological constant ) density . Thus, . The Einstein-de Sitter cosmology has no dark energy, i.e. , but . All the dimensionless densities () are defined relative to the critical density for closure of the universe, , where G is the gravitational constant. The -CDM cosmology results in 0.904 kpc per arcsec plate-scale for redshift .
- 11. R.J. Smith, et al., Astron. J. 128, 1158 (2004).
- 12. “Materials and methods” are available as supporting material on “Science Online”.
- 13. E. Escalera, et al., Astrophys. J. 423, 539 (1994).
- 14. P. Flin, J. Krywult, Astron. Astrophys. 450, 9 (2006).
- 15. H. Rottgering, M.H. Wieringa, R.W. Hunstead, R.D. Eckers, Mon. Not. R. Astron. Soc. 290, 577 (1997).
- 16. M. Bruggen, et al., Astrophys. J. 631, L21-L24 (2005).
- 17. A.P. Schoenmakers, A.G. de Bruyn, H. J. A. Rottgering, H. van der Laan, Astron. Astrophys. 374, 861 (2001).
- 18. F. Miniati, Mon. Not. R. Astron. Soc. 342, 1009 (2003).
- 19. U. Keshet, E. Waxman, A. Loeb, V. Springel, L. Hernquist, Astrophys. J. 585, 128 (2003).
- 20. P.M. Ricker, C.L. Sarazin, Astrophys. J. 561, 621 (2001).
- 21. M. Hoeft, M. Bruggen & G. Yepes, Mon. Not. R. Astron. Soc. 347, 389 (2004).
- 22. K. Roettiger, J. O. Burns, J. M. Stone, Astrophys. J. 518, 603 (1999).
- 23. T. Kitayama, S. Yasushi, Astrophys. J. 469, 480 (1996).
- 24. M. Girardi, G. Giuliano, F. Mardirossian, M. Marino, W. Boschin, Astrophys. J. 505, 74 (1998).
- 25. S. Gabici, P. Blasi, Astrophys. J. 583, 695 (2003).
- 26. H. Kang, T.W. Jones, Astrophys. J. 620, 44 (2005).
- 27. The minimum energy magnetic field is obtained by minimizing the total nonthermal energy density (), which consists of the magnetic field energy and the energy contained in all relativistic particles. Specifically, . In this expression, the model parameters are as follows: , the ratio of energy in heavy particles to electrons; , the fraction of source volume filled by magnetic fields; and V, the total source volume. The total synchrotron radio luminosity, , can be obtained from observations by integrating the radio spectrum between the lowest and highest frequencies (we used 10 MHz to 100 GHz). Parameters K, , and V are usually unknown and need to be guessed reasonably. For our estimate of , we used the values within range: 1 to 100, 0.1 to 1, line-of-sight depth = 270 kpc (for calculating V), and spectral index (for obtaining ). For further details, see (31).
- 28. R. Kulsrud, R. Cen, J.P. Ostriker, & D. Ryu, Astrophys. J. 480, 481 (1997).
- 29. Kronberg, P. P., Lesch, H. & U. Hopp, Astrophys. J. 511, 56 (1999).
- 30. F. Miniati, D. Ryu, H. Kang, & T. W. Jones, Astrophys. J. 559 , 59 (2001).
- 31. F. Govoni, L. Feretti, Int. J. Mod. Phys. (D) 13, no. 8, 1549 (2004).
-
1.
F.D. acknowledges support from CNES and PNC, CNRS/INSU. G.B.L.N. acknowledges support from CNPq, CAPES/Cofecub Brazilian-French collaboration, and FAPESP through the Thematic Project 01/07342-7. S.P. acknowledges The Deutsche Forschungsgemeinschaft (DFG), Research Training Groups (RTG) 1147 for financial support and specially thanks IUCAA for support. The National Radio Astronomy Observatory is a facility of the National Science Foundation operated under cooperative agreement by Associated Universities, Inc. The X-ray data is based on observations obtained with XMM-Newton, an ESA science mission with instruments and contributions directly funded by ESA Member States and NASA.
Supporting Online Material www.sciencemag.org SOM Text Figures: S1 to S3 References and Notes
12 June 2006; accepted 06 October 2006
(A)
(B)
Supporting Online Material
1. VLA observations and data analysis
The southern galaxy cluster Abell 3376 was observed with the Very Large Array (VLA) facility of National Radio Astronomy Observatory (NRAO), a Y-shaped interferometric array of 30 25m-diameter radio telescopes located on the plains of San Agustin Socorro, New Mexico, USA (1, 2). The L-band observations were done on two separate days: on 20th September 2002, in “CnB” configuration (6 hours total) and on 25th January 2003 in “DnC” configuration (6 hours total). The “CnB” and “DnC” are hybrid configurations in which the antennas on the east and west arms are moved in for the shorter configuration (C or D), but those on the north arm remain in extended confuguration (B or C). This results in better mapping of sources located in the extreme southern sky such as Abell 3376, due to a resultant more circular synthesized beam shape. The basic data produced by the array are the visibilities, or measures of the spatial coherence function, formed by correlation of signals from the array’s elements (one visibility sample for each pair of antennas, 351 visibilities during every sampling from all telescope pairs). The two IFs (intermediate frequencies) were centered at 1464.9 MHz (IF1) and 1385.1 MHz (IF2) with bandwidths of 50 MHz in each IF. The data were obtained in radio continuum mode and amplitude (flux density scale) calibration was obtained by boot-strapping to 3C 48 which was assumed to have a flux density of 15.6170 Jy at IF1 and 16.3186 Jy at IF2 respectively. We used VLA calibrator 0616-349 as phase calibrator to track visibility phases. As the angular width of the entire cluster is quite large ( arcmin), therefore each observation contained 3 separate telescope pointings: centered on the cluster center, the east radio relic and west radio relic respectively. At 21cm observing wavelength, the VLA system temperature is 45 K, when pointed at low elevation, required for pointing at o source declination. The individual dish antennas have beam diameter (effective field of view) of 30 arcminutes at 1.4 GHz.
For analysis we used the NRAO ‘AIPS’ package. Bad data points from faulty antennae/baselines and from high amplitudes or corrupted phases were edited out. Radio imaging of very faint, extended sources is always challenging due to the large primary beam area of the antennae, resulting in detection of many strong sources over this area. In addition, the effects of sky-curvature cannot be neglected in mapping and cleaning of fields large in size. In order to mitigate these problems as much as possible, for imaging and deconvolution we used the task ‘IMAGR’ that permits the ‘faceted’ wide-field mapping and cleaning option. We mapped up to 30 small fields (facets) centered on strong sources located a priori within the field of view centered on each of the three pointings, and then simultaneously cleaned the entire set. At the end of the cleaning cycle the clean components from all facets together were restored back onto a single field to obtain a large wide-field image. We point out that due to the use of a separate tangent point for each field, 3-D imaging, and the subtraction of clean components from un-gridded data (thus preventing aliasing of side-lobes), the quality of the final clean image is quite good.
During imaging, in order to emphasize the large-scale features and suppress the oscillations in the side-lobes, the visibility data were tapered by a Gaussian that had weight at the 30 k length of the interferometric spacing and parameter ROBUST = 5 was used, corresponding to ‘natural’ weighting of interferometric visibilities. The cleaned maps were restored with circular Gaussian beams of FWHM width. The calibrated data from two hybrid configurations were combined with the task ‘DBCON’. This has resulted in better sensitivity and excellent mapping of diffuse large-scale features, as well as angular resolution needed to identify the superposed background point sources. We did at least four passes of phase and amplitude self-calibration (3) to correct for the closure phase and amplitude errors. The background noise on the final radio images (Fig. 1 and 2 main paper, Fig. S1 this section) reaches down to Jy/beam of RMS and the S/N ratio for detection of diffuse radio features (shock fronts) ranges from at the faintest contour to at the peaks (after removing a few superposed background point sources). We used the task ‘PBCOR’ to correct for the primary beam attenuation effect of individual telescopes and all flux density measurements were done on these corrected images. The point source corrected flux densities for the east and west radio arc regions are 166 mJy and 136 mJy respectively.
2. XMM-Newton and ROSAT observations and data analysis
The ROSAT (Roentgen Satallite) PSPC-B (PSPC: Position Sensitive Proportional Counter detector) X-ray data were retrieved from the High Energy Astrophysics Science Archive Research Center (HEASARC). The observation was performed on February 28, 1992 with a 11.7 ks exposure time. From the photon list file we have made animage in the [0.14–2.0] keV band with 16 arcsec pixels (the spatial resolution is 25 arcsec). This image is shown in Fig. 1 and Fig. 2 of the main paper.
More recent X-ray imaging and spectroscopy data was obtained with XMM-Newton telescope, providing much higher resolution and sensitivity. These data are shown in Fig. 2 of the main paper. XMM-Newton is the most sensitive X-ray telescope built until now, thanks to its 58 mirrors (Wolter I grazing-incidence mirrors which are nested in a coaxial and cofocal configuration) collecting more X-rays than any other previous X-ray observatory. XMM-Newton’s scientific objective is to perform spectroscopy of cosmic X-ray sources over a range of energies from around 0.15 keV to 15 keV. European Photon Imaging Camera (EPIC) onboard XMM-Newton is the main focal plane instrument providing CCD imaging and spectroscopy at the focus of three XMM-Newton mirror systems. EPIC consists of two MOS (Metal Oxide Semiconductor) CCD cameras, and one PN-type CCD camera. Each MOS camera contains an array of seven MOS CCDs; and the PN-camera contains an array of 12 PN-type CCDs. The three EPIC cameras together offer the possibility to perform extremely sensitive imaging observations over the telescope’s field of view (FOV) of 30 arcmin diameter, and in the energy range from 0.15 to 15 keV with moderate spectral () and angular resolution (point spread function, about 6 arcsec FWHM).
We retrieved from the XMM-Newton archive a 47.2 ks observation performed on April 01, 2003 in standard Full Frame mode (Observation ID: 0151900101, Proposal no.: 15190). The pointing center of the telescope was on the position R.A. , and Dec. (J2000). The basic data processing (the “pipeline” removal of bad pixels, electronic noise and correction for charge transfer losses) was done with the XMM Science Analysis Software (SAS) V6.0. For the spectral analysis, we have used the observations made with the EPIC/MOS1, MOS2 and PN cameras. For the EPIC/MOS cameras, after applying the standard filtering, keeping only events with FLAG and PATTERN 12, we have removed the observation times with flares using the light-curve in the [10–12 keV] band using a 3-sigma clipping technique. The cleaned MOS1 and MOS2 event files have remaining exposure times of 19.3 ks and 19.7 ks, respectively. We used a similar procedure for the PN, applying the standard filtering and keeping only events with FLAG and PATTERN 4. The cleaned PN event file has a useful exposure time of 19.2 s. The redistribution and ancillary files (RMF and ARF) were created with the SAS tasks rmfgen and arfgen for each camera and each region that we analysed.
Spectra were analyzed with xspec 11.3.2. Since the spectra were rebinned, we have used standard minimization. We have applied MEKAL (4,5) plasma models. The metal abundances (or metallicities) are based on the solar values given by (6). We chose to use these abundances for easier comparison with previous work, even though these values may not be accurate - more recent solar abundance determinations, e.g. (7,8), give lower O and Fe abundances than (6). Using the combined XMM-Newton data the only clearly detected line is the Fe XXV K- complex at keV (restframe energy), thus the metallicity is measured based mainly on the iron abundance. The photoelectric absorption – mainly due to neutral hydrogen in our galaxy – was computed using the cross-sections given by (9), available in xspec.
In order to obtain the mean temperature and metallicity of the cluster, we extracted the X-ray spectrum in an ellipse centered on the X-ray peak with a semi-major axis of 440 arcsec and semi-minor axis of 390 arcsec. The spectral fits were done with data in the range [0.3–8.0 keV], simultaneously with MOS1, MOS2, and pn. Spectral fits were done on the background corrected data. We use the standard background obtained at the XMM science center, created by adding sky exposures of intermediate galactic latitude without bright sources (10). Within the region selected for spectral fits, the mean emission-weighted temperature is keV and the mean metallicity is , where denotes solar metal abundance. The bolometric X-ray luminosity in this region is erg s-1.
We have produced the thermal emission, temperature and metallicity maps (Fig. 2) using an adaptively kernel technique described in (11). Briefly, we do a pixel-by-pixel spectral fit, adapting the size of the fitted region based on a minimum number of net counts. Each fitted pixel is then assigned with a temperature or metallicity value. For the emission map, the pixel size is 3.2 arcsec. For the temperature and metal abundance maps, the pixel size is 12.8 arcsec.
References and Notes
1. http://www.vla.nrao.edu
2. Heeschen, D.S., The Very Large Array, in Telescopes for the 1980s, G. Burbidge and A. Hewitt, editors, Annual Reviews Inc., 1981, pp. 1-61
3. T.J. Pearson, A.C.S Readhead, 1984, Ann. Rev. Astron. Astrophys. 22, 97
4. Kaastra J.S. & Mewe R. 1993, Astron. Astrophys. Suppl. 97, 443
5. Liedahl D.A., Osterheld A.L. & Goldstein W.H. 1995, Astrophys. J. 438, L115
6. Anders E., Grevesse N., 1989, Geochimica et Cosmochimica Acta 53, 197
7. Grevesse N., Sauval A.J., 1998, Space Science Reviews 85, 161
8. Wilms J., Allen A., McCray R., 2000, Astrophys. J. 542, 914
9. Balucinska-Church M. & McCammon D. 1992, Astrophys. J. 400, 699
10. Lumb D.H., Warwick R.S., Page M., & De Luca A. 2002, A&A 389, 93
11. Durret F., Lima Neto G.B., Forman W., 2005, A&A 432, 809
![[Uncaptioned image]](/html/astro-ph/0611297/assets/x5.png)
Figure S1(a): Image details near the strong radio source MRC 0600-399 in Abell 3376 cluster, which is positioned near the peak of “cometary” thermal bremsstrahlung X-ray emission (main text). The 1.4 GHz radio emission observed by Very Large Array, at 20 arcsec beam resolution (contours), are shown superposed on the XMM-Newton X-ray map (0.3–8.0 keV band). Contour values are: (0.12, 0.24, 0.48 and 1 mJy/beam). We can see the X-ray emission associated with the radio galaxy core and a pair of radio jets strongly bent towards north north-east, away from the elongated X-ray emission. Also visible is the large scale diffuse radio emission further to the east.
![[Uncaptioned image]](/html/astro-ph/0611297/assets/x6.png)
Figure S1(b): Image showing a superposition of radio emission contours (at 1.4 GHz, observed with Very Large Array, at 12 arcsec beam resolution), and the r-band optical image from the Digitized Sky Survey. The 2nd brightest cluster member galaxy, associated with the bent-jet radio galaxy MRC 0600-399 can be seen close to its radio core. Another radio source, possibly originating from an elliptical galaxy to the north east of MRC 0600-399 can also be seen. The image covers arcmin2 ( kpc2) region. Contour values are : (0.25, 0.5, 1, 2, 4, 8 and 16 mJy/beam)
![[Uncaptioned image]](/html/astro-ph/0611297/assets/x7.png)
Figure S2: Azimuthally averaged, radial profile of the intra-cluster medium metallicity (Z), here given in solar units, obtained from analysis of XMM-Newton data. The center of the profile is located on the X-ray peak position R.A. , and Dec. . The metal abundance is mainly based on detection of Fe XXV K- complex at keV (restframe energy). The neutral hydrogen coloumn density is taken as free parameter for fitting and each bin contains counts. There appears to be no strong metallicity gradient, as is the case of virialized clusters, although a weak trend can be seen. Some dynamically virialized clusters can have metallicity as high as the in the centre, see, e.g., (10). The absence of a clear metallicity gradient is a sign of mixing, possibly caused by a recent merging event of subclusters with their varied individual metal abumdances.
![[Uncaptioned image]](/html/astro-ph/0611297/assets/x8.png)
Figure S3 (a): Results from a hydrodynamical simulation (with gas dynamics and magnetic fields ‘frozen’ into gas) of merger between two clusters of similar masses, and (at redshift ). The collision between two masses is virtually head-on with a relative speed of 2000 km/s. We see the density (upper panels) and temperature (lower panels) distribution on a slice along a plane which contains the both centres of mass of the initial two clusters. The scale bar is comoving length in Mpc. The first snapshot is taken at redshift at , and later snapshots, with snapshot time indicated in Gyr (1 Gyr = yr), follow the center of mass of the cluster. The density is given in proper mass density divided by proton mass, and the gas temperature is in Kelvin degrees. In the temperature maps, we can clearly see a pair of very hot ( K), merger generated shock fronts propagating outwards from the cluster center, reaching 1 Mpc distance at the outskirts of the final collapsed cluster. The structure of these ‘ring-like’ shocks is very similar to giant radio arcs discovered in Abell 3376 cluster. Many other filamentary shock features can also be seen, similar to what we see towards west of the eastern radio structure found in cluster Abell 3376 (Fig. 1, and main text). (Simulation figure: courtsey of, Matthias Hoeft and Marcus Bruggen. For more details see the original paper: M. Hoeft, M. Bruggen and G. Yepes, Mon. Not. R. Astron. Soc. 347, 389 (2004).
![[Uncaptioned image]](/html/astro-ph/0611297/assets/x9.png)
Figure S3 (b): Results from a hydrodynamical simulation of merger shocks and creation of large scale radio relics. This figure shows the radio luminosity probability at a frequency of 100 MHz, per unit mass of radio plasma. Other parameters are the same as in Fig. S3(a). Thus, this figure shows not the actual radio luminosity, but the scaled probability of radio emission in arbitrary units (see the color bar. Black or red color show low probability, while blue and yellow trace regions of higher radio emission). The upper panel is for higher value () of the ratio of magnetic pressure () to gas pressure (). The lower panel is for lower value (0.01) of the same ratio. The most remarkable structure is a prominant ring-like feature with diameter of about 1 Mpc, 1.13 Gyr after the shock fronts were generated from the center due to a merger. This radio structure corresponds to the outgoing shock waves seen in Fig. S3(a). One can clearly see the flaring of a radio plasma due to in situ shock acceleration of electrons and compression of radio plasma, even after 1 Gyr past of merger. Higher magnetic fields (upper panels) result in too fast an ageing of the plasma (due to synchrotron emission losses), such that the shock waves can not ‘revive’ the plasma. Noticeably, the center of cluster is virtually void of any ’radio-halo’ type synchrotron emission. The lack of a ‘radio-halo’ emission from cluster center and the simulated structure of these ‘ring-like’ shocks, both are remarkably similar to the peripheral giant arc-like radio structures we discovered in Abell 3376 cluster (Fig .1, and main text). (Simulation figure: courtsey of, Matthias Hoeft and Marcus Bruggen. For more details see the original paper: M. Hoeft, M. Bruggen and G. Yepes, Mon. Not. R. Astron. Soc. 347, 389 (2004).