VLBI at the highest frequencies – AGN studied with micro-arcsecond resolution
Abstract:
Compact galactic and extragalactic radio sources can be imaged with an unsurpassed angular resolution of a few ten micro-arcseconds, adopting the observing technique of global millimeter VLBI. Here we present the Global Millimeter VLBI Array (GMVA) and discuss its present performance. For individual and partially archetypical radio sources with prominent VLBI jets (e.g. 3C 120, Cygnus A, M 87, 3C 454.3, NRAO150), we show and discuss new results obtained with the GMVA. The variety of observed effects range from jet propagation and bending, partial fore-ground absorption in the nucleus, and jet component ejection after major flares to new and very small ( Schwarzschild radii) upper limits to the jet base of M 87. We also discuss the future development of mm-VLBI at 3 mm and towards shorter wavelengths and make suggestions for possible improvements.
1 Introduction
VLBI studies at centimeter wavelengths have already revealed a wealth of details about the morphology and propagation of the powerful AGN radio jets. The detailed understanding of their physical origin, however, still is limited and it is very unclear, how these jets are launched and accelerated and how the jet base is connected to the ‘central engine’. The recent development in black hole theory and computer simulations suggest that general relativistic magneto-hydrodynamical (GR-MHD) processes, i.e. the interplay of matter accretion, magnetic fields and space-time curvature, eventually modified by black hole rotation (Kerr metric), may play an important role (i.e. [15], [10], [19]). However, not many observational constraints to the physical parameters of these models are yet available. It is also unclear, if GR-MHD driven jet acceleration occurs in all classes of radio-loud AGN, or is present in only some objects. It is hoped that VLBI studies of AGN at short millimeter wavelengths ( mm, mm-VLBI) can contribute in answering these questions. Depending on the physical details of the jet acceleration and collimation processes, the compactness and brightness temperatures of the radio cores must change with distance from the center. Similarly, the morphological, spectral and kinematical properties of the inner-most jet regions will change, depending on the nature of the ‘central accelerator’. VLBI imaging at the highest possible frequencies therefore should be used to determine/measure the variation of observational parameters, like i.e. the brightness temperature, jet-velocity and jet-spectrum along the jet and as close as possible down to the jet origin. Since at cm-wavelengths, the jet base appears self-absorbed and unresolved, the highest possible observing frequencies, and angular resolutions are required to image and study these regions.


2 Present day Global Millimeter VLBI
We now will concentrate on some new results obtained with the Global mm-VLBI Array (GMVA)111web link: http://www.mpifr-bonn.mpg.de/div/vlbi/globalmm. The GMVA is open to the scientific community, offering regular global VLBI observing in the 3 mm band. At present, two observing sessions per year, each of up to 5 days duration are performed. More frequent observations are in principle possible, if the demand for this (via proposal pressure) increases. Proposal deadlines are synchronized with the annual February 1st and October 1st deadlines of the NRAO. The GMVA combines the European antennas (the 100 m Effelsberg (EB), Germany, the 30 m Pico Veleta (PV), Spain, the phased 6x15 m Plateau de Bure Interferometer (PdB), France, the 20 m Onsala (ON), Sweden , and the 14 m Metsähovi (MET), Finland) with the VLBA, of which eight antennas are presently equipped with 3 mm receivers. In Figure 1, we show some typical uv-coverages for the GMVA for sources at 4 different representative declinations. Mainly due to the participation of the two very sensitive IRAM telescopes (PV & PdB) and the 100 m Effelsberg telescope, the array sensitivity is improved by a factor of , when compared to the VLBA alone. In the standard observing mode with Mark 5 recording at 512 Mbit/s, the single baseline –detection threshold on the most sensitive PV–PdB baseline is 30-40 mJy, and from the IRAM antennas to one VLBA antenna it is 50-100 mJy (assuming 100 sec integration and 20 sec coherence time). This has to be compared with a mJy detection level, which is reached between two VLBA antennas. The inner-American sensitivity will improve, when the 100 m Green Bank telescopes (GBT) becomes available for 3 mm VLBI. The quality of present day 3 mm VLBI maps and their rms noise level, is mainly determined by the atmospheric conditions during the observations. In a compromise for good observing conditions at all VLBI stations, annual observations in spring (April, May) and autumn (October) are performed. It is frequently discussed, if mm-VLBI observations during winter time (January, February) might be better suited. However, cold periods of low humidity appear often only locally and are neither well predictable nor are in present European climate long enough. With up to 13 stations participating in a GMVA observation, images with a dynamic range of up to a few hundred are obtained, reaching a rms noise level of mJy/beam for a 12 hr full uv-coverage observation (at 512 Mbit/s, 50 % duty cycle). We note that a relatively large number of participating VLBI stations plays an important role for the imaging, because the short coherence time and the atmospheric opacity variations require the heavy use of closure amplitudes and require amplitude self-calibration down to the time scale of atmospheric fluctuations. In radio interferometry it is well known that self-calibration only leads to reliable images, if the number of participating telescopes is large enough ().
For compact galactic and extragalactic radio sources, the GMVA provides VLBI images with an angular resolution of up to as. For a source at redshift , this corresponds to a linear scale of cm (or 0.07 pc or 85 light days)222Through out this paper we adopt the following cosmological constants: km/s/Mpc, , .. When expressed in terms of Schwarzschild radii of a black hole of mass M (), a linear size of 740 is obtained, comparable to the expected size of an accretion disk. Mainly technically driven VLBI pilot experiments, performed at 2 mm and 1 mm revealed recently first transatlantic fringes at a world record fringe spacing of up to G (as) (for details see [23], [24], [12]). This demonstrates the principal feasibility of global VLBI at wavelengths shorter than mm, and shows that VLBI imaging with as resolution is not an unrealistic dream. Depending on source distance and mass of the central black hole, this corresponds to a few to a few hundred gravitational radii (or Schwarzschild radii) in size. This resolution is so high that future and more sensitive mm-VLBI experiments at mm, should facilitate the observation of direct signatures of General Relativity effects near super massive black holes (SMBH).
2.1 Examples of Radio-Jets studied with 3 mm-VLBI:
In the following section we highlight some new and partly still preliminary results obtained from
recent global 3 mm VLBI observations. The results of a more statistically oriented new 3 mm VLBI detection
survey are presented by Lee et al. (this conference).
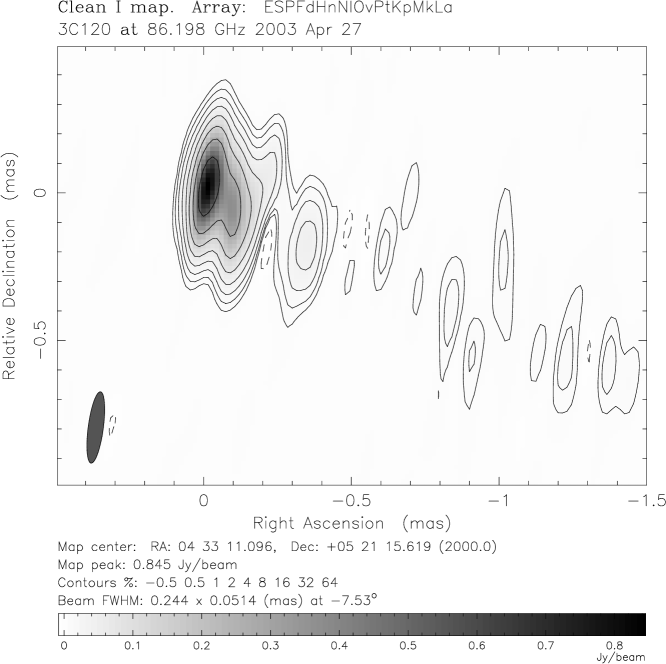
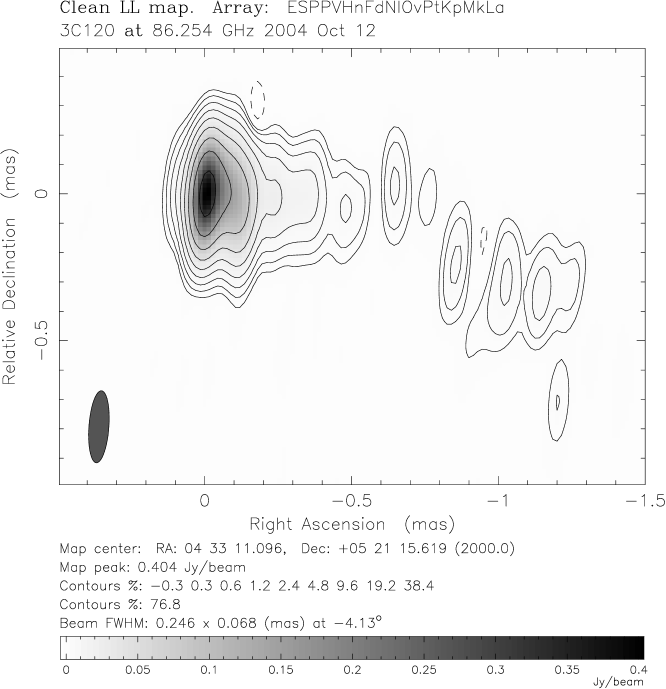
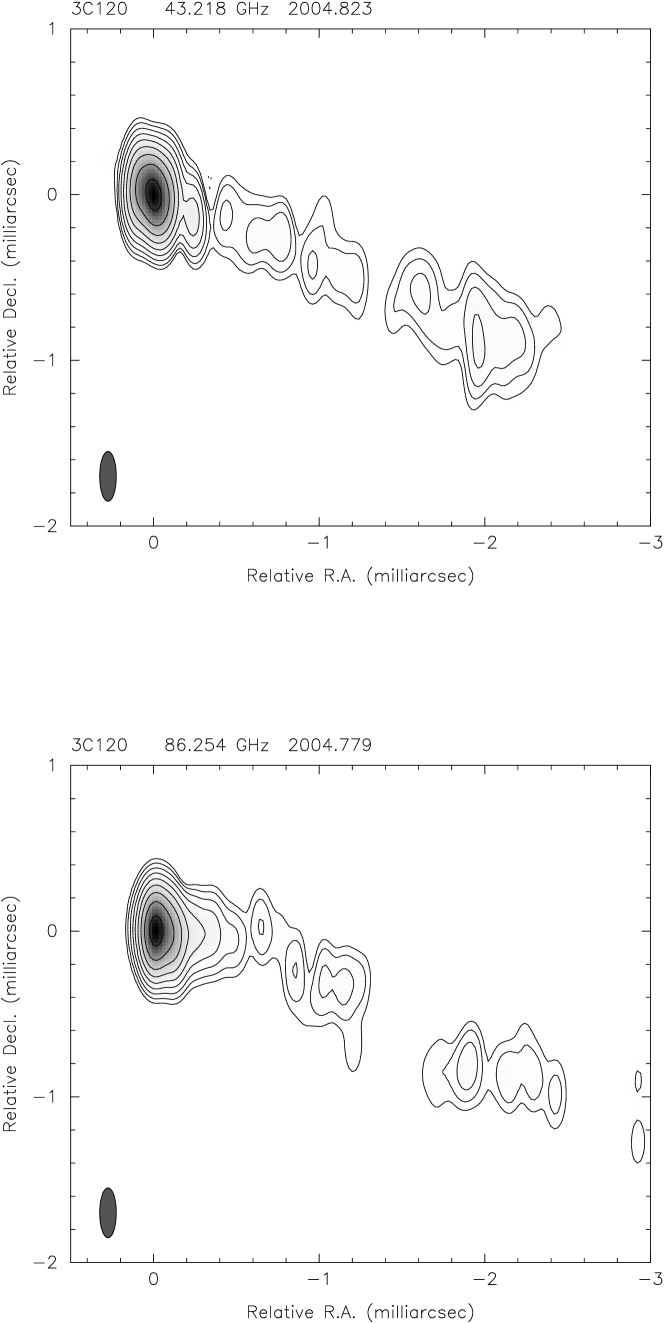
3C 120: In Figure 2 we show two VLBI maps of 3C 120 obtained with the GMVA in April 2003 (10 stations, mode 256-8-2, 11 hrs) and in October 2004 (12 stations, mode 512-8-2, 12 hrs). The dynamic ranges of the two maps are 200:1 and 300:1, respectively. At the redshift of the observing beam size of mas corresponds to a spatial resolution of pc, or in terms of a black hole to a linear scale of for the minor beam axis. At and below the 0.5 mas scale, structural differences and a misalignment of the orientation of the inner jet between both epochs are visible. Much denser time sampled observations will be necessary to follow the expected motion of mas/yr ([17]). Slightly super-resolving the map of April 2003, reveals an ’S-shaped’ structure on the mas scale. This and the change of the position angle of the sub-mas jet on a 1.5 yr time scale supports the idea of helical Kelvin-Helmholtz instabilities, which may be excited by some sort of ‘rotation’ at the jet base ([9], [18]).
Beyond the 0.5 mas scale, the 3 mm VLBI jet fades and breaks into filamentary sub-components. A demonstration
of the reality of this weak and extended jet emission is obtained from the inspection of the right panel of
Figure 2. Here, we show uv-tapered VLBI images observed within a 16 day interval at 43 GHz (VLBA) and 86 GHz (GMVA).
Both maps are convolved with the same CLEAN-beam of mas in size, and show weak
jet emission at corresponding locations on the mas-scale. A future and more detailed analysis will be necessary to find out,
if the partial misalignment of the jet ridge-line in mas region can be interpreted by transverse
opacity effects and jet stratification.
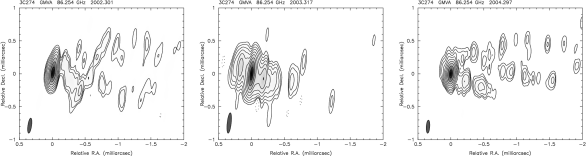
M 87: The nearby radio galaxy M 87 (Virgo A, 3C 274) is one of the closest radio galaxies with a prominent radio jet (z=0.00436, D=16.75 Mpc). It is the ideal object for high spatial resolution VLBI studies, which address the question how the powerful and relativistic jets in AGN are made. For the assumed black hole, the Schwarzschild radius is cm, which translates for a GMVA observing beam of as into an exceptionally high spatial resolution corresponding to only Schwarzschild radii for this source.
We note that a similar spatial resolution in terms of Schwarzschild radii is obtained for the black hole in the center of our Galaxy (Sgr A*) at the shorter wavelength of 1.3 mm (for details see [22], [25] and references therein). The low declination of Sgr A* and the lack of sensitive millimeter antennas in the Southern Hemisphere, however, will most likely not permit to image Sgr A* at 1 mm with sufficiently high dynamic range (and a not too elongated observing beam) for the next years. In this context, the mm-VLBI observations of M 87 are more promising for the search of GR-effects in the vicinity of a SMBH.
Since the mid 1990’s, several attempts were made to obtain a reliable image of M 87 with global 3mm VLBI. With a correlated flux density of only mJy at the longest uv-spacings ( G), the nucleus of M 87 is relatively weak and fringe detection requires a high sensitivity, which is now provided by the GMVA. The preliminary maps presented in Figure 3 show the structure of the inner jet at three epochs: April 2002, 2003 and 2004, respectively. The observations in 2002 and 2003 were made at 256 Mbit/s, while in 2004 the recording rate was increased to 512 Mbit/s. The amount of visibility data with the three most sensitive telescopes (EB, PV, PdB) largely determines the quality of the maps.
In April 2002, the source was observed with 12 VLBI stations (8 x VLBA, EB, ON, PV, HSTK). Unfortunately bad weather at EB and PV limits the dynamic range of the resulting map (Fig. 3, left). Tapering this image with a larger beam (not shown here), however, shows an edge brightened transversely resolved and conical jet with similar opening angle as seen in the 43 GHz images of the VLBA ([20], [26]) and also in the later 3 mm map of April 2004 (Figure 3, right).
In April 2003, the source was observed with participation of the phased IRAM interferometer on Plateau de Bure. The combination of this sensitive telescope with the other VLBI stations (EB, PV, ON, 8 x VLBA), resulted in a better map (see Fig. 3, center). The source exhibits a core-jet structure and embedded, several distinct emission features, which are aligned at a position angle of , which coincides with the orientation of the southern border of the jet cone (cf. Fig. 3, right). The two times higher brightness of the VLBI core in this epoch (peak flux densities of 0.52 Jy/beam in 2002, 0.73 Jy/beam in 2003, and 0.35 Jy/beam in 2004) and the dynamic range limitations may explain the lack of faint jet emission, seen at larger core separations in the 2002 and 2004 image. In 2002 and 2004, the jet appears one-sided with all of the extended jet emission located west of the brightest component. In 2003, however, a partially resolved component located mas east to the times brighter central and more compact component is seen. At present it is unclear, if this eastern component should be identified with the jet base (which then must vary considerably in compactness), or if it is part of a counter-jet. Independent evidence for a counter-jet comes from a new 43 GHz VLBA map obtained by Ly et al., [26], but is not seen at cm-wavelengths ([11]).
In April 2004, M 87 was observed with 10 stations (EB, ON, PV, 7x VLBA). Due to the failure of its H-maser, the PdB interferometer was not available (a new H-maser is now delivered). Because of the now increased recording rate of 512 Mbit/s, the imaging sensitivity was improved and the source could be reliably imaged. The map of Figure 3 (right) shows again the known Y-shaped (conical) jet expansion, most of which happens on the mas scale. Thus, the linear size of this region of jet collimation is Schwarzschild radii. The transverse width of the jet at mas is of order of mas, corresponding to Schwarzschild radii, showing clear signs of edge-brightening and a ‘hollow’ or at least faint central jet body. If this central jet region would contain a fast electron population (fast spine), the jet inclination relative to the observer could lead to Doppler de-boosting, which would reduce its observable brightness. In 2004 (and in 2002) the jet base appears unresolved, with an upper limit to its size determined by the actual observing beam. If we assume that the minor axis of the observing beam is a measure of the underlying size of the foot-point of the jet, we obtain an upper limit of as, which corresponds to a spatial scale of only . A lower limit of the brightness temperature of the core component then is K. No strong statement can yet be made with regard to the distance of the jet base relative to the central super massive black hole. The back-extrapolation of the jet cone to its vertex, however, indicates that this distance is small and of order of mas, or .
We find it very remarkable that the size of the VLBI core, which should be identified with the region of the
jet, where it first becomes radiative, is so small. The existence of a fully developed jet
on such small spatial scales will give important new constraints for the theory of jet formation.
Jet models which are based on the magnetic sling shot mechanism (Blandford & Payne, [7],
[8]) assume efficient
particle acceleration along the S-shaped magnetic field lines up to Lorentz factors of .
The field lines are anchored in the inner part of the rotating accretion disk and
probably form helical magnetic flux tubes, which may explain the observed bent and sometimes edge-brightened jet
morphology (core-sheath structure). In these models, the diameter of the jet base
is defined by the transverse width of the jet after initial acceleration, which is
of order , where is the bulk Lorentz factor and
is the radius of the light cylinder ([8], [33]).
The light cylinder should have a radius of typically ([8],[13]).
If we assume for the Lorentz factor (as derived from the motion seen
on pc scales), one would expect a size of the jet base of ,
which is at least 3 times larger than the measured size. One way out of the problem is to assume
that the central BH is rotating (Kerr BH). This would reduce the radius of the light cylinder
and the width of the jet base by up to a factor of 3 (e.g. [30]). In this case,
the observed small size of the VLBI core would point more towards jet models, in which the jet
gains energy directly from BH-rotation ([6], [29], [19]).

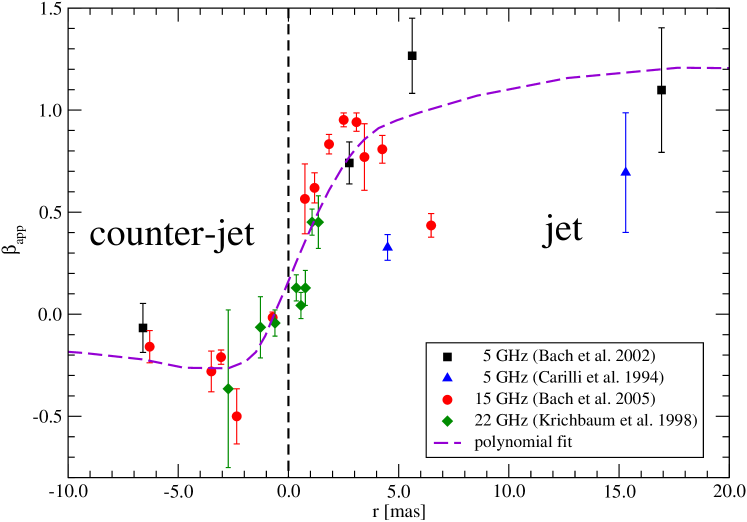
Cygnus A: Another argument for the relevance of magnetic acceleration in radio jets comes
from multi-frequency studies of the kinematics in the jet and counter-jet of Cygnus A. In Figure
4 (left) we show some VLBI maps of the source at GHz (data: Bach et al., see [4], [5]).
At 86 GHz a one sided core-jet structure is visible, consisting of an unresolved core of as size
(linear size light-days) and two secondary jet components. Some station failure and a recording rate
of only 256 Mbit/s limit the sensitivity and dynamic range of the map, and inhibit the detection of fainter
jet and counter-jet emission. We note that the strong frequency dependence of the jet-to-counter-jet
ratio suggests the existence of a fore-ground absorber, which attenuates the radiation from the
counter-jet ([21]). Clearly more sensitive mm-VLBI observations are required, to detect
the counter-jet at a frequency, where the absorber becomes optically thin and the counter-jet becomes brighter. Future high
angular resolution images of double-sided jets, like in Cygnus A, are very important, as they may lead to
the detection of a gap between the two foot-points of jet and counter-jet. The size and position of
the gap would nicely constrain the position of the central BH, and tell us more about the
jet acceleration processes, which link the BH with the jet base. That magnetic acceleration is not just
speculation is demonstrated in Figure 4 (right), which shows the measured apparent jet speed as
a function of core separation. For an almost perfectly straight jet like in Cygnus A, jet bending and geometrically
caused acceleration (due to differential Doppler boosting)
can be neglected. Thus, the observed acceleration must be related to an intrinsic variation
of the bulk Lorentz factor. The observed large and systematic variation in apparent jet speed
by almost one order of magnitude ( c
within pc, cannot be easily explained with purely hydrodynamical jet models. Most interestingly
is the observed shape of the acceleration curve (dashed line in Figure 4 (right)),
very nicely reproduced by the model of
Vlahakis & Königl ([35], and Fig. 1e therein), which use magnetic acceleration in Poynting-dominated jets.
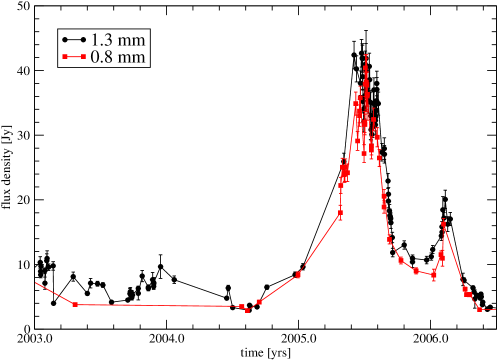
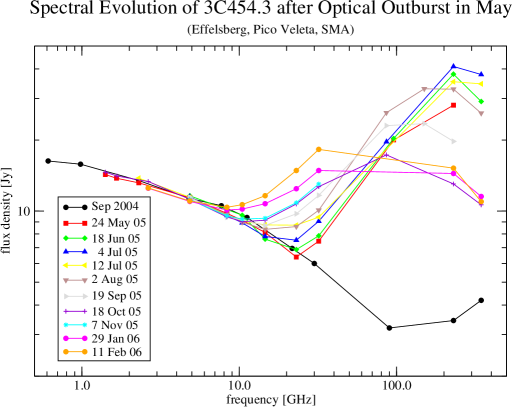
3C 454.3: In AGN, flux density outbursts usually are more pronounced at higher radio frequencies. Quite often, they lead to the ejection/creation of new jet components, which subsequently propagate down the jet. One particular advantage of mm-VLBI is its ability to detect these new jet components in their earliest evolutionary phases and near their origin. In early May 2005, the quasar 3C 454.3 (z=0.859), showed a large flux density outburst, which was first observed in optical/X-ray bands ([14],[16] and references therein) and within one month later evolved into a huge millimeter flare of peak flux of Jy at 3 mm and 1 mm wavelength (Fig. 5, top left). Already during the onset of the radio flare, we started to observe the source with a broad frequency coverage and the aim to monitor the evolution of the radio spectrum. At the 100 m MPIfR radio telescope we performed a regular flux density monitoring, rapidly switching between all available receivers (1.4 - 32 GHz) on each observing date. These data are complemented by quasi-simultaneous measurements with the 30 m IRAM telescope on Pico Veleta ( GHz, data: H. Ungerechts et al.) and the Sub-millimeter Array (SMA) on Mauna Kea ( GHz, data: M. Gurwell et al.). In Fig. 5 (bottom, left) we show some examples of the resulting broad-band radio spectra, covering a time range from May 2005 to February 2006. For comparison, also a quiescent pre-flare spectrum from RATAN-600 is added (Sep. 2004, black line, data: Trushkin et al., [34]). The figure clearly shows a spectral ‘bump’, initially peaking near GHz, and then fading and propagating towards longer wavelengths. This behavior appears largely consistent with a moving and expanding relativistic shock, undergoing synchrotron and adiabatic cooling (e.g. [27]). We note that this flare appears very pronounced at short millimeter wavelengths, but at longer wavelengths (below GHz) so far did not cause very dramatic variations. Therefore it is expected that most of the flaring and related possible structural variability should occur in the – at cm-wavelength self-absorbed – core region.
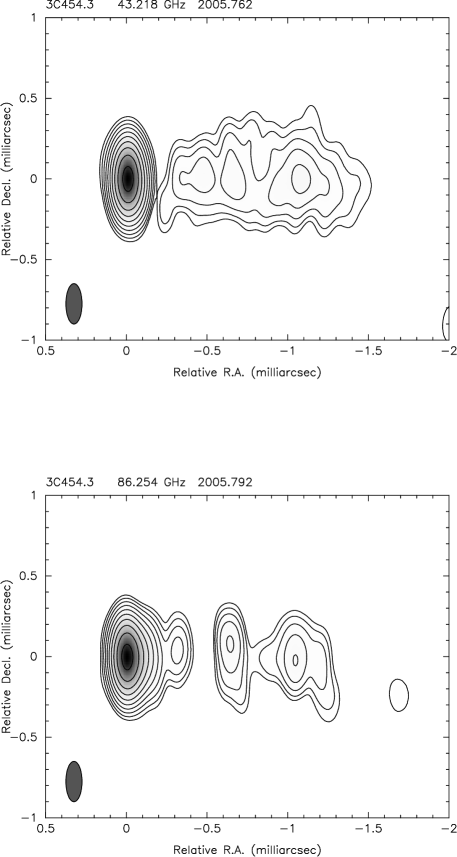
3C 454.3 is also monitored with the VLBA and the GMVA by several groups. Unfortunately, no 3 mm VLBI image is yet available at a time near the flare maximum (2005.5). In Figure 5 (right, bottom), we show a 3 mm GMVA image obtained months afterwards (Oct. 17, 2005). The position of a new jet component seen at mas, is consistent with an assumed ejection between 2005.3 and 2005.5 and an apparent speed in the range of c.
For comparison, a 43 GHz VLBA image (data: A. Marscher, priv. comm.) observed 11 days earlier is
shown on top of the 3 mm map. Both maps show the one sided inner jet,
extending to mas length, with at least 3 embedded more compact emission components.
For the compact, and at 3 mm slightly elongated core, we find a spectral index of
().
While the 86 GHz map shows two secondary jet components on the pc scale near the core
(at mas), the 43 GHz image does not show similar emission. This could indicate either
unlikely fast motion within 11 days (of several mas/yr), or the presence of internal absorption.
By integrating the flux in this region, we estimate a highly inverted spectral index in the range of
. At larger core separation, however, the spectrum of the jet is steep again.
At present, it is unclear, if this spectral inversion is due to a
fore-ground absorber partially covering the inner jet. Future polarization and Faraday rotation measurements
could help in answering this question.

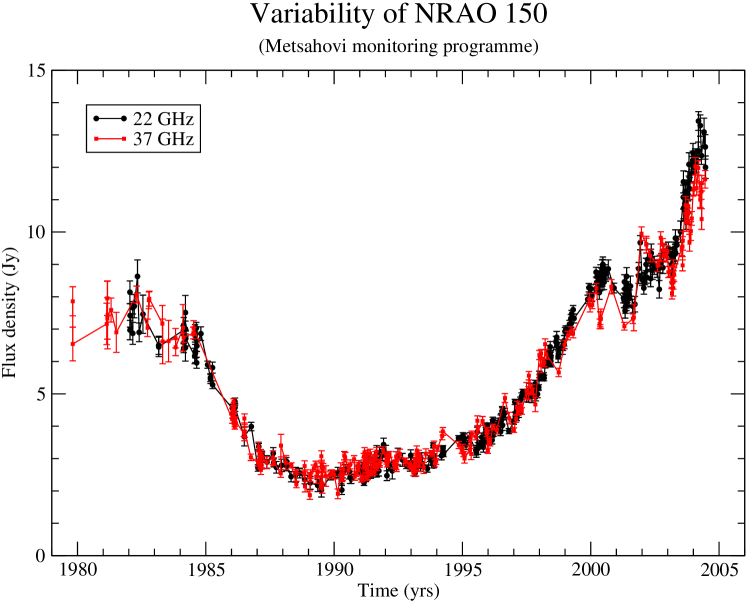
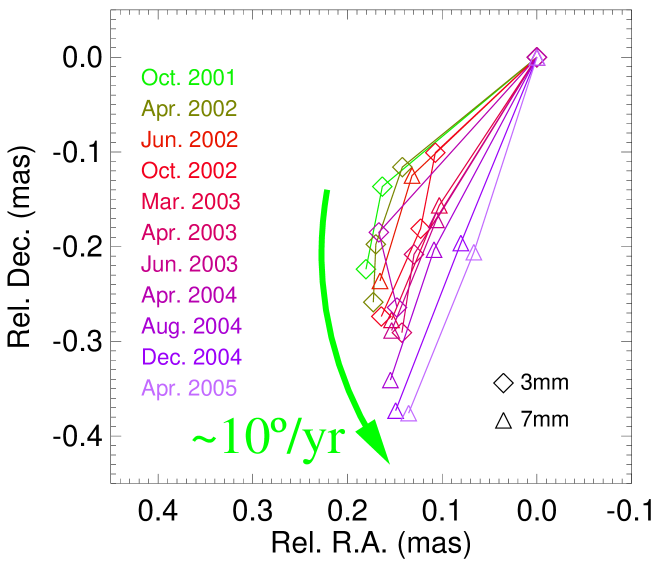
NRAO 150: The last important aspect, which we like to address in this paper, is the possibility to study with mm-VLBI the nature of jet bending and trace strongly curved jets down to their physical origin. In almost all sources so far imaged by mm-VLBI, this jet curvature increases with decreasing core separation. An exciting example for a curved and possibly ‘rotating’ jet nozzle is seen in the strong radio source NRAO 150 (, [1]). It shows a ‘sinusoidally’ appearing long-term light curve (Michigan and Metsähovi flux monitoring programs), and a remarkable flux density increase from Jy to Jy at 37 GHz during the last 15 yrs ([32], see also Fig. 7, left). Motivated by the possibility of a geometrical origin of this variation and a possible periodicity, we started to observe the source with global 3 mm VLBI in the late 1990’s (for details see [2]). In Figure 6 we show three VLBI maps obtained at 8, 43, and 86 GHz in spring 2002. At cm-wavelengths, a one-sided core jet structure with a jet extending to at least mas and oriented along is seen. At higher angular resolutions, the mm-VLBI images reveal a very different jet orientation of , showing very pronounced jet bending of within only 0.5 mas (4.3 pc) core separation. Such strong curvature can be explained by geometrical projection effects, if the inner jet is aligned at a small viewing angle. 43 GHz VLBA and 86 GHz GMVA monitoring observations performed during 1999 and 2005 allow to follow the motion of the inner-most jet components () and measure the orientation of the axis of the inner jet. In Figure 7 we show a preliminary plot of the positions of the inner jet components as function of time and aligned with respect to the stationary assumed VLBI core. Colored lines connect corresponding components at a given epoch and outline the orientation of the mean jet axis. A systematic clock-wise rotation of the mean jet position angle in the plane of the sky towards the south, at a rate of /yr is obvious. It is tempting to relate this rotation to the long term flux density variability, which suggests a timescale of yrs. We note that similar, although less pronounced jet position angle variations are seen in the pc-scale jets of an increasingly large number of sources (i.e. 3C 84, 3C 120, 0716+714, OJ 287, 3C 273, 3C 345, BL Lac, …). This suggests a common physical origin and a fundamental process in AGN radio jets. We stress that the non-ballistic motion of the jet components excludes simple geometrical precession, as is observed in micro-quasars like e.g. SS 433. Whether such ‘wobbling’ of the jet foot-point is caused by gravitational interaction with another super massive body, by instabilities in the accretion disk or at the jet base, or is an inherent property of a BH-accretion disk system (general relativistic effects, e.g. the Lens Thirring rotation), remains at this point an open question and deserves future studies.


3 Summary and Outlook
Global millimeter VLBI provides images of dynamic range of a few hundred and with angular resolution of up to as. Although the sensitivity and uv-coverage is already quite good, there is still room for some improvement. The performance of the VLBA antennas at 86 GHz is still limited by remaining pointing and focusing problems at this high frequency. The lack of a large millimeter antenna in the USA, limits the transatlantic detection threshold to mJy (IRAM-VLBA) and the inner-American baseline sensitivity to mJy. The participation of a large telescope like the GBT in 3 mm VLBI, would improve the overall array sensitivity by at least a factor of 2 from mJy/hr to mJy/hr. A similar argument applies for CARMA, when used as a phased array in 3 mm-VLBI. A substantial gain in sensitivity comes from a larger observing bandwidth. Whereas European antennas can now already observe at data rates as high as 1 Gbit/s (256 MHz bandwidth for 2 bit sampling), the VLBA does not yet support this observing mode. The application of more sophisticated fringe fitting methods, i.e. by the use of phase corrections from water vapor radiometry (see paper by A. Roy et al., this proceeding) and the enhancement of the AIPS fringe fitting tasks through more sophisticated incoherent averaging methods ([31]) could, further improve the sensitivity of mm-VLBI.
The mm-VLBI imaging of nearby sources (such as Sgr A* and M 87) opens a challenging perspective of being able to study the immediate vicinity of super massive black holes with a spatial resolution of only a few to a few ten gravitational radii. The low declination of these particular sources, unfortunately limits the north-south resolution of the existing mm-VLBI networks. For the imaging of general relativistic effects in nearby black holes, the addition of mm-VLBI capable radio telescopes in the southern hemisphere (South America: APEX, LMT, ALMA, … for observations at mm), but also in Southern Europe (Noto, Yebes, Sardinia Radio Telescope, for observations at mm) and in South Africa (no mm-telescope planned) would be extremely important. To demonstrate this, we show in Figure 9 and 9 a simulation of a future 1.3 mm VLBI experiment with 6 sub-millimeter telescopes, with one telescope located in the southern hemisphere (here we used APEX (12 m), but other antennas like the Japanese ASTE (10 m) or the first ALMA antennas may be used, if equipped for VLBI). The simulation shows that a possible intrinsic asymmetry in the brightness distribution of Sgr A* could be detected, if one of the afore mentioned antennas would be equipped for VLBI (H-maser, VLBI terminal). For this simulation we assumed state of the art receiver temperatures and a moderate recording rate of 2 Gbit/s, which reflects the ongoing development of the VLBI data acquisition. Even higher data rates (observing bandwidths) are anticipated in the next few years (e.g. Mark5 B, recording at 4 Gbit/s, [37]). The corresponding sensitivity increase will lead to a much larger number of observable objects and to mm-VLBI at even shorter wavelengths ( mm). With an angular resolution of better than as one can image compact emission regions of a few gravitational radii size. Similar small scales can be reached with future space VLBI missions at longer wavelengths (e.g. VSOP-2, H. Hirabayashi, this conference), and with X-ray interferometers (e.g. MAXIM, [36]). The combination of high resolution radio interferometry and interferometric X-ray spectroscopy would indeed form an extremely powerful tool to study super massive black holes and their environment with unprecedented accuracy.
Acknowledgments.
We thank the staff of the observatories participating in mm-VLBI, and in particular the telescope and correlator operators and VLBI friends. We thank W. Alef and D. Graham for their help in the various stages of data reduction. The VLBI maps presented for 3C 120 are obtained within a collaboration of some of the authors of this paper with J.L. Gómez and A. Marscher. The VLBI results presented for 3C 454.3 are obtained partly within a larger collaboration of some of the authors with Boston University Group (A. Marscher et al.), the Finish group at Tuorla Observatory (T. Savolainen, K. Wiik, et al.), and IRAM (H. Ungerechts, H. Wiesemeyer, C. Thum et al.). We especially would like to thank A. Marscher for providing data prior to publication. For the use of their partly unpublished flux density monitoring data, we thank M. Gurwell (SMA), H. Ungerechts (IRAM) and M. Tornikoski (MRO). I. Agudo acknowledges financial support from the European Commission for Science and Research through the ENIGMA network (contract HPRN-CT-2002-00321).References
- [1] Acosta-Pulido, J.A., et al., 2007, A&A, in preparation.
- [2] Agudo, I., Krichbaum, T.P., Bach, U., et al., 2005, Rev. Mex. AA, in press, (astro-ph/0511268).
- [3] Agudo, I., et al., 2007, in preparation.
- [4] U. Bach, T.P.Krichbaum, E. Middelberg, et al., 2004, in: Proceedings of the 7th EVN Symposium, ed. R. Bachiller et al., OAN, Madrid, p. 155.
- [5] U. Bach, M. Kadler, T.P.Krichbaum, et al., 2005, in: Future Directions in High Resolution Astronomy ASP Conference Proceedings, Vol. 340. Edited by J. Romney and M. Reid. San Francisco: Astronomical Society of the Pacific, p. 30.
- [6] Blandford, R.D., & Znajek, R.L., 1977, MN 179, 433.
- [7] Blandford, R.D., & Payne, D.G., 1982, MN 199, 883.
- [8] Camenzind, M., 1990, RvMA 3, 234.
- [9] Caproni, A., & Abraham, Z., 2004, MN 349, 1218.
- [10] De Villiers, J.P., Hawley, J.F., & Krolik, J.A., 2003, ApJ 599, 1238.
- [11] Dodson, R., Edwards, P.G., & Hirabayashi, H., 2006, PASJ 58, 243.
- [12] Doeleman, S.S., Phillips, R.B., Rogers, A.E.E., et al., 2005, in: Future Directions in High Resolution Astronomy: The 10th Anniversary of the VLBA, ASP Conf. Proc. Vol. 340, ed. J. Romney & M. Reid, p.605
- [13] Fendt, C., & Memola, E., 2001, A&A 365, 631.
- [14] Fuhrmann, L., Cucchiara, A., Marchilli, N., et al., 2006, A&A 445, 1.
- [15] Gammie, C.F., McKinney, J.F., & Toth, G., 2003, ApJ 589, 444.
- [16] Giommi, P., Blustin, A.J., Capalbi, M, et al., 2006, A&A, 456, 911.
- [17] Gómez, J.L., Marscher, A.P., Alberdi, A., Jorstad, S.G., & Agudo, I., 2001, ApJ 561, L161.
- [18] Hardee, P.E, Walker, R.C., & Gómez, J.L., et al., 2005, ApJ 620, 646.
- [19] Hawley, J.F., & Krolik, J.H., ApJ, 641, 103.
- [20] Junor W., Biretta J.A., Livio M., 1999, NAT 401, 891.
- [21] Krichbaum, T.P., Alef, W., Witzel. A., et al., 1998, A&A 329, 873.
- [22] Krichbaum, T.P., Graham, D.A., Witzel, A., et al., 1998, A&A 335, 106.
- [23] Krichbaum, T.P., Graham, D.A., Alef, W., et al., 2002, in: 6th EVN Conf., ed. E. Ros et al., p.125 (astro-ph/0207022).
- [24] Krichbaum, T.P., Graham, D.A., Alef, W., et al., 2004, in: Proceedings of the 7th EVN Symposium, ed. R. Bachiller et al., OAN, Madrid, p.15 (astro-ph/0411487).
- [25] Krichbaum, T.P., Graham, D.A, Bremer, M., et al., in: Galactic Center Workshop 2006 – ”From the Center of the Milky Way to Nearby Low-Luminosity Galactic Nuclei”, ed. R. Schödel, G. Bower, et al., 2007, Journal of Physics: Conference Series by Institute of Physics Publishing, Bad Honnef, in press (astro-ph/0607072).
- [26] Ly, C., Walker, R.C., & Wrobel, J.M., 2004, AJ 127, 119.
- [27] Marscher, A.P., & Gear, W.K., 1985, ApJ 298, 114.
- [28] Marscher, A.P., Jorstad, S.G., Gómez, J.L., McHardy, I.M., Krichbaum, T.P., & Agudo, I., 2007, ApJ, submitted.
- [29] McKinney J.C., 2006, MN 368, 1561.
- [30] Meier D.L., Koide S., & Uchida Y., 2001, Sci 291, 84.
- [31] Rogers, A.E.E., Doeleman, S.S., & Moran, J.M., 1995, AJ 109, 1391.
- [32] Teräsranta, H. Wiren, S, Koivisto, P., et al., 2005, A&A 440, 409.
- [33] Tomimatsu A., & Takahashi M., 2003, ApJ 592, 321.
- [34] Trushkin, S.A., Harinov, M.A., Michailov, A.G., 2005, Astro. Telegram 488, May 12.
- [35] Vlahakis, N., & Königl, A., 2004, ApJ 605, 656.
- [36] White, N., 2000, NAT 407, 146.
- [37] Whitney, A., 2006, The Mark 5B VLBI Data System, in: IVS 2006 General Meeting Proceedings, eds. D. Behrend & K. Baver, in press.