High resolution spectra of bright central stars of bipolar planetary nebulae, and the question of magnetic shaping111Based on observations made with ESO Telescopes at the La Silla Observatories under program ID 70.D-0339
Abstract
We present ESO NTT high resolution echelle spectroscopy of the central stars (CSs) of eight southern bipolar planetary nebulae (PNe) selected for their asymmetry. Our aim was to determine or place limits on the magnetic fields of the CSs of these nebulae, and hence to explore the role played by magnetic fields in nebular morphology and PN shaping. If magnetic fields do play a role, we expect these CSs to have fields in the range G from magnetic flux conservation on the reasonable assumption that they must evolve into the high field magnetic white dwarfs. We were able to place an upper limit of G to the magnetic fields of the central stars of He 2-64 and MyCn 18. The spectrum of He 2-64 also shows a P-Cygni profile in He I 5876 and 6678, corresponding to an expanding photosphere with velocity 100 km s-1. The detection of helium absorption lines in the spectrum of He 2-36 confirms the existence of a hot stellar component. We did not reach the necessary line detection for magnetic field analysis in the remaining objects. Overall, our results indicate that if magnetic fields are responsible for shaping bipolar planetary nebulae, these are not required to be greater than a few tens of kilogauss.
1 Introduction
Planetary Nebulae (PNe) and their central stars (CSs) are the transition phase between asymptotic giant branch (AGB) stars and white dwarfs (WDs) for main-sequence masses between 1 and 8 M⊙. PNe are found in a wide range of morphologies, but the majority of shapes can be classified into three types: round, elliptical, and bipolar (or multipolar) PNe (Schwarz et al., 1993; Manchado et al., 1996). Bipolar and multipolar PNe are characterized by a waist, and show one or more sets of lobes. Several mechanisms have been proposed for shaping the bipolar structures, including common envelope evolution (e.g., Bodenheimer & Taam, 1984), magnetic fields associated with the central stars (e.g., Pascoli, 1992), and stellar rotation (e.g., Ignace et al., 1996).
Magnetic fields have been an attractive hypothesis for shaping PNe into bipolar morphology for single stars. From a theoretical point of view, a toroidal magnetic field embedded in a spherically expanding fast wind is able to reproduce the majority of the PN morphologies (García-Segura et al., 1999). As explored by García-Segura et al. (2005), if the magnetic field is strong enough to drive the AGB winds, magnetic pressure alone can also drive the winds into high speeds as observed in proto-planetary nebulae (Bujarrabal et al., 2001). Other models involved the magneto-centrifugal processes have also been applied to PNe and shown that such processes can efficiently power and collimate the outflows (Blackman et al., 2001).
Interestingly, magnetic fields have been detected in the progenitors and the progeny of PNe, namely, around proto-planetary nebulae (pPNe), and in WDs. The observations of magnetic fields in pPNe are mostly from SiO, OH, and H2O maser emissions (e.g., Miranda et al., 2001; Bains et al., 2004). Recently, Vlemmings et al. (2006) have found direct evidence that the magnetic field is collimating the jet from the AGB star W43A. They measured the polarization of water vapor masers that trace the precessing jet emanating from the star, and concluded that the magnetic field and jet characteristics of W43A support the shaping mechanism of PNe by magnetically collimated jets from evolved stars.
Concerning the progeny of PNe, it has been known that a fraction of WDs have detectable magnetic fields. Since the discovery of the first isolated magnetic WD (Grw +70∘8047 was discovered by Minkowski 1938, though its peculiar spectrum was not recognized to be caused by a strong magnetic field until much later by Angel et al. 1985 and Greenstein et al. 1985), the number of detected magnetic white dwarfs (MWDs) have grown steadily (Wickramasinghe & Ferrario, 2000, and references therein). Recent studies show that least 10% of WDs have magnetic fields at the level of 2 MG and larger, and this fraction increases if low-field objects are included (Liebert et al., 2003). Since PNe and their CSs are the evolutionary link between pPNe and WDs, at least a fraction of them should also contain magnetic fields. However, such observational evidence has been scarce. Very recently, some hints of the existence of magnetic fields in PNe have been given by means of spectropolarimetry (Jordan et al., 2005). Among the four CSs of PNe observed by Jordan et al. (2005), they found possible signature of magnetic fields in two CSs.
Isolated MWDs with fields G show a mean mass of 0.93 M⊙, compared to the main peak of the mass distribution of 0.57 M⊙ for the nonmagnetic white dwarfs (Wickramasinghe & Ferrario, 2000, and references therein). This is interesting, since the statistical studies of PNe have shown that bipolar PNe may have more massive progenitors: Observations from a large sample of Galactic PNe have shown that bipolar PNe are closer to the Galactic plane and have more massive CSs than round and elliptical PNe. Furthermore, bipolar PNe are carbon-poor and nitrogen-rich, consistent with a massive post-AGB stellar population (Stanghellini et al., 1993, 2002; Manchado, 2004). The opposite is true for round and elliptical PNe. Recent studies of PNe in the Large Magellanic Cloud (Stanghellini et al., 2000) have also provided more evidence that aspheric (bipolar, quadrupolar and maybe point-symmetric) PNe belong to a different population than round and elliptical PNe: they are evolved from higher mass progenitors than round PNe.
The high mass distribution of isolated MWDs, together with more massive progenitors of bipolar PNe, seem to indicate that isolated MWDs could be the evolutionary product of magnetic CSs. If this hypothesis is correct, then, under the condition of magnetic flux conservation, we should expect a CS to MWD field ratio of
| (1) |
where B is the magnetic strength and R is the radius of the star. Depending on the mass of the CS and how evolved it is, could have a range of . Therefore with a range of magnetic fields of G found in MWDs, we should expect CS magnetic fields in the range of G. Thus our aim is to search for magnetic fields in CSs of bipolar PNe in this range in order to investigated if CSs of bipolar PNe can be progenitors of MWDs.
For this study, we have obtained high resolution echelle spectroscopy of central stars of southern bipolar nebulae. Our goal is to look for Zeeman splitting of stellar lines, caused by magnetic fields associated with the CSs. Our spectral resolution allows us to observe fields G.
2 Observations
Our target list includes stars at the top of the white dwarf cooling sequence. The PNe hosting the targeted CSs have been previously observed in the major nebular narrow-band filters (Balick, 1987; Schwarz et al., 1992; Manchado et al., 1996), and their morphological types have been classified uniformly following the Manchado et al. (1996) scheme. We selected bipolar PNe and other asymmetric PNe whose central stars are bright, and well separated from the nebulae. We used these criteria so that the targets are easier to place on the slit, have higher S/N, and the stellar spectra have less nebular contribution. We have also checked against the list of symbiotic stars in Corradi (2003) to exclude any symbiotic nebulae in our target list. Our sample comprises 8 CSs which are the only stars bright enough to be searched for magnetic fields in the southern sky with a 4-m class telescope. The properties of the targets are listed in Table High resolution spectra of bright central stars of bipolar planetary nebulae, and the question of magnetic shaping111Based on observations made with ESO Telescopes at the La Silla Observatories under program ID 70.D-0339, with column 1 and 2 giving the common name and the PN G name based on their galactic coordinates (Acker et al., 1992), columns 3 and 4 giving their published B and V CS magnitudes, when available, column 5 listing the references of the magnitudes, columns 6 and 7 giving their Zanstra temperatures derived from He II in the literature (with the exception of energy-balance temperature for He 2-64), and column 8 listing the temperature references.
The observations were done with the ESO Multi-Mode Instrument (EMMI) on the 3.58m New Technology Telescope (NTT) in 2003 February 4 and 5. We have observed our targets both with echelle spectroscopy and wide field imaging. Both nights were in photometric sky conditions and sub-arcsecond seeing. The filters used in wide-field imaging are listed in Table 2 and the observing logs are listed in Table 3. We obtained UBVR images and echelle spectral of 8 PNe.
EMMI has a blue arm and a red arm. The blue arm has one Tektronic CCD camera giving image size of 1024x1024. It was operated in the BIMG mode to obtain U- and B-band images. The pixel size is 24 m which corresponds to 0.37′′ in the sky. The red arm of EMMI has two MIT/LL CCD chips arranged in a mosaic. The two-chip mosaic is read in four output mode via four separate amplifiers, giving slightly different values for the bias level, gain, and read-out noise. Each output has image size of 1048x4096, giving full image size of 4096x4096 with a gap of 47 pixels in the x direction in between two chips. The red arm was operated in the RILD mode to obtain V- and R-band images and in the REMD mode to obtain echelle spectra. The 2x2 binning mode was used in order to avoid oversampling problems, resulting a full image size of 2048x2048 which has a pixel size of 15 m corresponding to 0.33′′ in the sky.
The echelle spectra were observed with the grating #14 and the cross-dispersing grism #5, corresponding to a wavelength range of 4120-6730 Å, with a gap between 5010-5060 Å. The dispersion in the 2x2 binning mode is 0.04 Å per pixel. The grating #14 gives a spectral resolution of R=60,000, corresponding to 0.1 Å in this wavelength range.
The calibration data were taken each night in order to correct several effects of the CCD electronics. The overscan region in the blue CCD was used to measure the electronic pedestal level of the CCD chip. The red CCD is very stable and an overscan region was not required. We acquired several bias frames to derive the column to column variations of the bias structures. A set of 5-10 bias frames were taken for each CCD at the beginning, the end, and during each observation night with the same CCD parameters. The dark current was negligible during the observations thus no dark frames were taken. Finally, dome flats were obtained for each observing configuration. In addition, standard star observations and Thorium-Argon arc spectra were taken for flux and wavelength calibrations.
3 Calibration
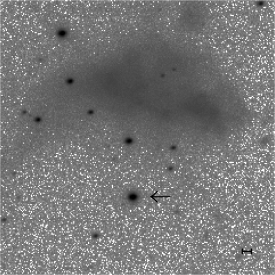
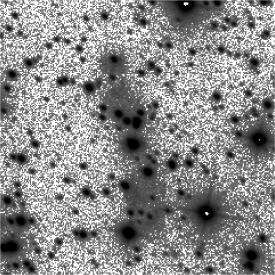
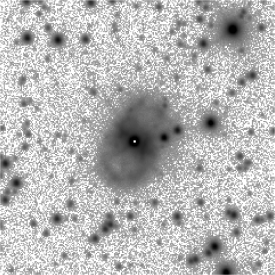
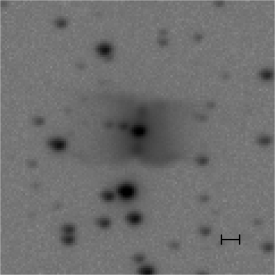
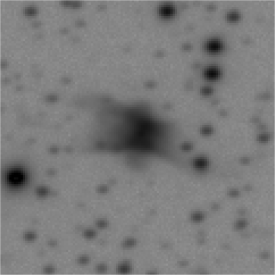
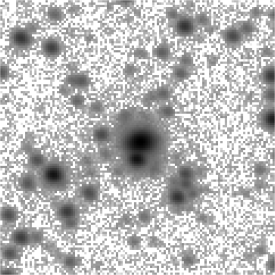
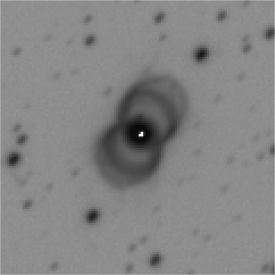
The imaging data were calibrated following the standard techniques using IRAF software (Massey, 1997). The bias frames and flats were combined by averaging them. The images were then bias subtracted, trimmed, and flat-field corrected. We show the R-band images of the targets in Figure 1 and Figure 2.
The echelle spectra were calibrated following the steps outlined in Willmarth & Barnes (1994). The target spectra, standard star spectra, flat fields, and wavelength calibration files were first bias subtracted using an average bias frame, then trimmed to remove useless parts as well as blue orders that are impossible to trace. The average flats are normalized using the task apflatten. The task finds and traces the orders and normalizes the flat by fitting the intensity along the order. The target spectra, standard star spectra, and wavelength calibration files were then divided by the normalized flat to correct for flat fielding.
The task doecslit, within the imred.echelle package, was used for spectral extraction. The extracting orders were first defined and traced with the standard star HR5501 spectra. The extracting aperture size is 8 pixels, which roughly corresponds to the width of the profile of the order at 5% of its maximum around Å. We have also used an extracting aperture size of 4 pixels to extract the spectra in order to minimize the nebular contamination while studying the stellar spectra. However, since the S/N get much lower as we decrease the extraction aperture, we only present the spectra of 8-pixel extraction and perform line measurements, unless otherwise noted. The Thorium-Argon arc spectra were extracted for wavelength calibration. After the wavelength of the entire spectral range has been defined, the observed fluxes of the standard star were compared against tabulated values. For each order a set of bandpasses was defined. The tabulated data were interpolated to the bandpasses specified. The ratio of the observed flux over the bandpass to the tabulated value over the same bandpass is fitted by a smooth curve to relate system sensitivity to wavelength for each order. This allows to derive calibration curves, that are then applied to produce the final flux-calibrated spectra. The procedure also corrects for atmospheric extinction.
The nebular emission line ratios were used to compare to the values in the literature as a test of our calibration. We used the task splot to measure the flux and of each nebular emission line. When applicable, we fit a Gaussian profile of the line to measure the flux. When the line structure is more complex (e.g., with two peaks), we sum up the area to get the total flux of the line. In both cases the continuum is fitted and subtracted by the task. In Table 4, we list the major nebular emission line intensities normalized to F(H)=100 for each object in columns 3 to 7. Column 8 gives the extinction constant (the logarithmic extinction at H) derived from the H to H ratio. The central star of HDW 5 lies outside of the nebular thus the nebula was not included in the observation. A comparison of our line intensities (versus H) and those from the literature is illustrated in Figure 3, which shows that our results generally agree well with previous observations.
4 Results and Analysis
Overall the spectra of seven objects, except HDW 5, show many nebular features. He 2-25, NGC 2818, and He 2-186 also show high expansion velocities in the hydrogen emission lines. In this paper we focus our attention to the stellar spectra, while nebular analysis will be presented in a future paper. We found no evidence of stellar emission or absorption in three objects, He 2-25, He2-186, and NGC 2818. HDW 5 has one stellar absorption line detected, and He 2-123 has two stellar C IV emission line detected. Only in He 2-36, He 2-64, and MyCn 18 we detected several stellar lines. We perform Gaussian fit of all stellar lines, and measure its flux and equivalent width. Table 5 lists all the lines that have been identified and measured. Here we describe each object and its spectrum in detail.
4.1 HDW 5
HDW 5 has a unique sickle-shape nebula (Figure 1, top left). It was discovered by Hartl & Weinberger (1987) during a search for new PNe on Palomar Observatory Sky Survey (POSS). Assuming a sphere with only the nebula visible in the north, Hartl & Weinberger proposed the blue star in the middle as the central star candidate (indicated with an arrow in Figure 1). Ali & Pfleiderer (1999) studied this nebula using its H and [N II] narrow band images and low-dispersion optical spectra and concluded that this nebula is in very low excited class and its low He abundance is consistent with type II PNe as defined by Peimbert & Torres-Peimbert (1983). Because of its peculiar shape, there is also some speculation that HDW 5 is not a PN, pending further analysis (Frew 2006, private communication). Méndez (1991) tentatively classified the central star candidate as hgO(H) – a high gravity star with very broad Balmer absorptions. The spectrum that we obtained shows no hydrogen lines. Only one unidentified absorption line is found at 5758Å as shown in Figure 4. Thus we are not able to assign a spectral class for this CS candidate.
4.2 He 2-25
The nebula has a pair of bipolar lobes with a stellar core (Figure 1, top right). It was discovered by Henize (1967) during an H survey. Corradi (1995) noted that the spectral characteristics of this nebula are common to a subclass of bipolar PNe, which includes the well-studied M 2-9 and has properties such as: (i) highly collimated nebulae; (ii) unusually high core densities, (iii) H profiles with extended wings and self-absorption features; and (iv) rich Fe II and [Fe II] emission in generally low-ionization spectra. Those characteristics closely resemble those of interacting binary systems such as symbiotic stars. However, Corradi (1995) found no direct evidence of a binary system as the central source of He 2-25. We did not detect stellar emission or absorption lines for this object.
4.3 He 2-36
The image of He 2-36 displays a bright central source and an equatorial band (Figure 1, bottom left). A pair of arcs extend from the edges of the equatorial band toward the north and south, making it an S-shape nebula. The observed spectrum shows strong hydrogen absorption lines and many metal lines (e.g., iron and titanium), characteristic of an A-type star. The CS has been previously classified as type A2 III (e.g., Méndez, 1978). It has been shown that the central star is a binary system consisting of a type A2 III star with a hot companion, the hot companion being the source of ionizing flux, as detected in the UV spectrum acquired with the IUE (Feibelman & Kondo, 2001). The optical spectrum of He 2-36 is discussed in more detail in Section 5.
4.4 NGC 2818
This nebula is a member of an open cluster with the same name (Tifft et al., 1972). This provides an accurate distance of the PN (Phillips & Cuesta, 1998, and references therein). Phillips & Cuesta (1998) presented narrow band images of this nebula and confirmed the complexity of its bipolar outflow structure (Figure 1, bottom right) by previous authors (e.g., Dufour, 1984; Banerjee et al., 1990). No stellar emission or absorption lines were detected from the central star. The stellar continuum is very faint. It may be an indication that the central star is not at the center of the nebula, where the observation was pointed.
4.5 He 2-64
The image of He 2-64 (Figure 2, top left) shows a bright central source with a pair of lobes. It is classified as a bipolar PN (e.g., Corradi & Schwarz, 1995). The spectrum of the central star shows a few stellar absorption lines, including He II 4686 and He II 5411 (Figure 5). We classify this star as O(He), according to the scheme outlined by Méndez (1991).
The spectrum of He 2-64 shows P-Cygni profiles of the He I lines, most clearly shown at 5876 and 6678 (Figure 6). The properties of these lines are listed in Table 6. The velocity deduced from the P-Cygni profiles is of the order 100 km s-1. This finding indicates that the star has an extensive expanding atmosphere. The P-cygni profiles are more clearly seen in the 4-pixel extraction, suggesting that they are partly masked by the nebular emission. In the optical regime, P-Cygni profiles are more often seen in the He II lines (e.g., Méndez et al., 1988, 1990). For example, Phillips et al. (2005) reported P-Cygni profiles in the He II 4859 line of A78, with a terminal velocity km s-1.
4.6 He 2-123
He 2-123 (Figure 2, top right) shows an equatorial waist with a pair of bipolar lobes extending to the east and the west. This PN was discovered in Henize’s (1967) H survey. Corradi & Schwarz (1993a) first noticed that its lobes have point symmetrical brightness distribution. We have detected two weak emission lines from the central star: C IV 5801 and 5811 (Figure 7). At the position of He II 4686, there seems to be some stellar emission, but it is too faint to be measured. If this He II emission is real, the spectral type of the central star would be Of(C) or Of-WR(C). The faint C IV emission lines also fit into the category of the weak emission-line (WEL) CSPN as defined by Tylenda et al. (1993).
4.7 He 2-186
The nebula (Figure 2, bottom left) has several bright arcs of emission in the inner region, with a pair of low-ionization knots about 5′′ from the core (see Figure 4 of Corradi et al., 2000). He 2-186 is a small, poorly studied PN. The H emission was first studied by Henize (1967). The narrow band images presented by Schwarz et al. (1992) first revealed the existence of the point-symmetric knots. Corradi et al. (2000) performed a detailed morphological and kinematic study of this nebula and discussed the possibility that these high-velocity knots were the result of precessing outflows from the central star. Corradi et al. (2000) also speculated the existence of binary system as the central star. However, no direct evidence of it was found. The spectrum of the central star shows no stellar emission or absorption lines.
4.8 MyCn 18
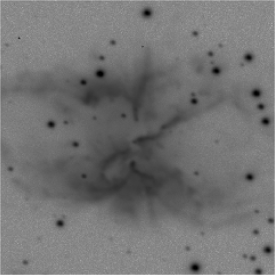
MyCn 18, the ’Engraved Hourglass’ nebula (Figure 2, bottom right), was originally observed by Mayall & Cannon (1940). This PN shows an extreme bipolar morphology, with a narrow pinched waist and an open-ended hourglass structure. Because of its striking shape, the nebula has been studied in a wide range of wavelength and the nature of its central star has been discussed by various authors (Bryce et al., 2004, and references therein). Corradi & Schwarz (1993b) compared this object to the symbiotic bipolar nebulae He 2-104 and BI Crucis, based on their morphological similarity, but noted no direct evidence that MyCn 18 has a central symbiotic system. Bryce et al. (1997) and O’Connor et al. (2000) discussed several possible mechanisms that can produce the bipolar, knotty outflow seen in MyCn 18 and favored a nova-like ejection from a central binary system.
The spectrum of the central star shows four emission lines: N III 4634, C IV 4658, He II 4686, and C IV 5811. It also shows one very faint absorption line (He II 4541), and one absorption line, unidentified, at 5780. All these features are shown in Figure 8. Méndez (1991) classified its spectral type as Of(H) – He II 4686 is a narrow emission (FWHMÅ) with H in absorption. We found that the He II 4686 line has a FWHM of 3.7Å. However, we did not find any Balmer absorption lines for the central star. Therefore, we classify the spectra as Of(C).
5 Search for Zeeman-Split Stellar Lines
If a Zeeman split of magnetic origin is detected in the spectrum, the field strength could be inferred with:
| (2) |
where is the split separation, is the wavelength of the spectral line, is the effective Landé factor and B is the magnetic field strength in Gauss (Leone et al., 2003). Equation (2) can be also used to estimate upper limits to the magnetic field.
Among the 8 CSs observed, only the spectra of He 2-36, He 2-64, and MyCn 18 have high enough S/N to determine whether their stellar lines might be Zeeman split. We closely examined the stellar spectra of these three objects to look for signs of splitting due to the presence of a magnetic field. A possible split was identified visually if a stellar line shows more than one peak in emission or more than one dip in absorption. If the feature shows two apparent components, and (e.g. for emission) the intensity drop between the components is greater than 5 times the 1-sigma noise level of the spectrum, we concluded that the feature is real and performed further analysis on the feature.
No evidence of Zeeman splitting was found in the spectra of He 2-64 and MyCn 18. We could place an upper limit to the magnetic field associated with these two CSs using Equation (2). With an optimal spectral resolution of 0.1 Å, the minimum detection of the wavelength displacement is 0.05 Å. To cause a displacement of 0.05 Å in a simple Zeeman triplet (), the field strength has to be 5000 G. However, due to the nature of our data – faint central stars thus low S/N for stellar continuum ( 10 to 20 for He 2-64 and MyCn 18), we believe that we are unable to detect a split feature with a separation of less than 0.4 Å. This translates to a field strength of 20,000 G. Therefore no magnetic field stronger than 20,000 G was found in the central stars of He 2-64 and MyCn 18.
The spectrum of He 2-36 is more difficult to interpret. We know that this star has two components, the cool companion being an A2 III star, and the hot companion detected to date only in the ultraviolet spectra. The prominent features of our He 2-36 spectrum are those metal lines expected in a A2 III stellar spectrum, such as those of HD 210111 (an A2 III-IV star observed with the VLT, from the UVES Paranal Observatory Project, ESO DDT Program ID 266.D-5655, Bagnulo et al. 2003). We have successfully fitted the Balmer lines in our spectrum by using the models by Kurucz (1992, with the latest modifications from his website222http://kurucz.harvard.edu/) with = 8500 K and . There is no need to invoke a hot component to justify these lines. On the other hand, when comparing He 2-36 with the spectrum of HD 210111, we were also able to identify two absorption lines at 4686 and 5876, where no metal lines typical of an A2 III star are expected. We believe these two lines correspond to He II 4686 and He I 5876. We show these two absorption lines in Figure 11 and 11. The profile of He II is especially compelling. The nebular emission line shows an asymmetric profile in the 8-pixel extraction, indicating the existence of the absorption. In the 4-pixel extraction, the absorption is shown along with some residual nebular emission. The nebular emission is blue-shifted, behaving the same way as the Balmer lines from the nebula in front of the star (Figure 12, see discussion below). We conclude that the features at 4686 and 5876 are helium lines from the hot star, and that we have confirmed the presence of the hot companion of He2-36 in the optical spectrum with the present observations.
We used the Atomic Line List v2.04333http://www.pa.uky.edu/ peter/atomic/ to determine if there are other helium lines that should have been detected in our spectral range of 4120-6730Å. The 5876 absorption line is the strongest He I line expected in this range. Of the other, fainter He I lines, 6678 shows no absorption but with larger uncertainty because this line lies near the edge of an order, and 5016 and 5048 fall in the CCD gap, while 4471, 4388, and 4713 coincide with the cool star absorption lines, thus are not observable. Furthermore, 4686 is the strongest expected He II absorption line in our spectrum, the weaker 6560 is faintly visible in the wings of the H absorption (Figure 12, bottom right).
The spectrum of He 2-36 also shows a feature at 4780. Since the absorption line looks split in the middle, we focused our attention to it, in order to determine its nature. First, we checked against the possibility of nebular emission contamination. We extracted the spectrum using a narrower aperture size of 4 pixels444Our regular extractions were of 8 pixels. in order to exclude most of the nebular emission. In Figure 12 we show the 8- and 4-pixel extractions of our spectrum around the Balmer lines. We see from the Figure that the 8-pixel extraction discloses the broad stellar absorption and the narrow nebular emission, while the spectrum of the 4-pixel extraction shows only the broad stellar absorption. For the nebular emission, H, H, and H (Figure 12, top three left panels) are blue-shifted compared to the central wavelengths of the stellar absorption, indicating the emission is mostly from the foreground nebula. At H, where the S/N is the highest, the nebular emission line shows a split with a blue-shifted and a red-shifted component (Figure 12, bottom left panel), indicating that the observed emission originates both from the nebula in front and behind the central star. The nebular emission line of O III shows the same structure. By comparing the spectra extracted with the two apertures, it is evident that the narrow aperture extraction has excluded most of, if not all, the nebular emission. We compared the 4780 feature as it appears with the two aperture extractions, and found that the split feature appears in both spectra. Therefore we conclude that this feature must be of stellar origin. It is worth noting that to produce the spectra section of Figure 12 (and all other 4-pixel extraction) we did not perform any nebular subtraction, but simply select the data within the pixels closer to the star.
Second, we need to establish whether the cool or the hot companion is responsible for the split feature 4780. If absorbed by the cool component, this feature should be interpreted as Ti II 4779.99. In this case, though, this would be the only split line among the several Ti II absorption observed. If, on the other hand, this transition originates in the hot stellar photosphere, it could be identified as O IV 4779.10. But even this possibility is puzzling, since in the present spectrum we could not detect the other components corresponding to the 2s2p(3P0)3p - 2s2p(3P0)3d transition of O IV. If the feature was indeed O IV, and the observed splitting was produced by the magnetic field, we could use equation (2) to estimate the field strength. This O IV transition has =4/3, thus the observed 0.7 Å split could imply a field strength of the order of 25,000 G if we assume that the line splits into a doublet in the weak field regime. If we use the sequence of spectra of hot sub-dwarfs published by O’Toole et al. (2005), our deduced relative strengths of He II 4686 and He I 5876 would appear to indicate a star with and K. Such a star would evolve into a magnetic white dwarf with a surface dipole field strength of G if we adopt a as being typical of magnetic white dwarfs. This field is comfortably within the range observed for the field distribution of isolated magnetic white dwarfs.
In Table 7 we list the measurements from the 4780 feature in He 2-36. We measured the line as a whole to obtain the central wavelength, and fit the split feature with two line profiles in order to get the wavelength displacements, both in the 8-pixel and the 4-pixel extractions. The displacements of the wavelengths from the central wavelength are the same for short-ward and long-ward directions, with differences within the errors (0.2Å). Their fluxes are equal in the 4-pixel measurement, but not in the 8-pixel measurement. This may be because there is a slight nebular contamination, but the split feature is not severely affected by it. The hot component interpretation of the 4780 feature needs verification in order to recover the other components of the transition multiplet. Nonetheless, the fact that the feature is split into two components of equal strength and displaced by the same amount from the zero field position would be in agreement with a Zeeman split feature in the low field regime.
We realize that our proposal that we are seeing absorption lines from the hot star in He2-36 superposed on the A star spectrum is not without difficulty, since such absorption features would require a comparable contribution by the two stars in the optical. In fact, if we assume that these two stars are associated and therefore at the same distance, and we allow for differences in temperatures and gravities, we would only expect approximately a 2% contribution to the optical spectrum by the hot star. A possible resolution to this dilemma is that the A star is not physically linked to the nebula and the hot component that we have found is indeed the central ionizing star of the PN.
Whether or not we have measured a magnetic field in He2-36 hinges on the identification of the split absorption feature at 4780 which we have tentatively attributed to O IV from the hot star. This remains to be confirmed through the detection of other components of the multiplet with their associated Zeeman splitting. Higher resolution data should also reveal Zeeman splitting in the helium lines.
6 Conclusions
We have investigated the shaping mechanism of bipolar PNe and the progenitors of MWDs using high resolution echelle spectroscopy of central stars of eight southern bipolar PNe. We looked for Zeeman splitting of the stellar lines caused by possible magnetic fields associated with the CSs. Among the eight objects, we did not detect any stellar emission or absorption lines for He 2-25, NGC 2818, and He 2-186. HDW 5 have one absorption and He 2-123 have two faint C IV emission lines detected. The spectra of He 2-36, He 2-64, and MyCn 18 have much higher S/N and various stellar lines in their spectra were detected. For those with stellar features, we have assigned a spectral class mainly following Méndez’s (1991) classification. An expanding atmosphere has also been found for the central star of He 2-64 with a velocity of 100 km s-1 as derived from the P-Cygni profiles of the He I lines.
We have placed upper limits of G for the CSs of He 2-64, and MyCn 18. We could not perform our search for Zeeman splitting in HDW 5, He 2-25, NGC 2818, He 2-123, and He 2-186 due to limited S/N in their spectra, and thus no upper limits to the magnetic fields associated with the nuclei of those PNe could be placed. The low detection rate of stellar features in the central stars indicate that even though we have chosen the brightest objects possible, the S/N from the observations with a 4-m telescope are still too low for our science goals. In order to collect a proper sample for our analysis, it is essential to obtain high sensitivity observations of the central star spectra with larger aperture telescopes.
We found He I and He II absorption lines in the spectrum of the CS of He 2-36, disclosing the hot component of the possibly binary CS. The split feature at 4780 in He 2-36 is intriguing. If the feature is from the hot companion of the system, and the split is really caused by Zeeman splitting, this would be the first direct detection in the flux spectrum of a magnetic field in a CS of a PN. Further observations with larger aperture telescopes and conducted at different epochs will be crucial to rule out the possibility that the split is caused by binarity. In addition, we plan to obtain spectropolarimetry to confirm the presence of a magnetic field in the central star of He 2-36. This is a complicated yet very exciting stellar system and requires more observations to further understand it.
Our limits to the magnetic field in the sample stars indicate that, if required to produce the bipolar shape, magnetic fields do not need to be stronger than a few tens of kilogauss, in broad agreement with the Garcia-Segura models. Our results are supplementary to those of Jordan et al. (2005) where possible fields of a few kilo-Gauss were reported from spectropolarimetric studies of the CSs of 4 asymmetric PNe.
References
- Acker et al. (1989) Acker, A., Jasniewicz, G., Koppen, J., & Stenholm, B. 1989, A&AS, 80, 201
- Acker et al. (1992) Acker, A., Marcout, J., Ochsenbein, F., Stenholm, B., & Tylenda, R. 1992, Strasbourg-ESO Catalogue of Galactic Planetary Nebulae (Strasbourg: Obs. Strasbourg)
- Ali & Pfleiderer (1999) Ali, A., & Pfleiderer, J. 1999, A&A, 351, 1036
- Angel et al. (1985) Angel, J. R. P., Liebert, J., & Stockman, H. S. 1985, ApJ, 292, 260
- Bagnulo et al. (2003) Bagnulo et al., 2003, Messenger, 114, 10
- Bains et al. (2004) Bains, I., Richards, A. M. S., Gledhill, T. M., & Yates, J. A. 2004, MNRAS, 354, 529
- Balick (1987) Balick, B. 1987, AJ, 94, 671
- Banerjee et al. (1990) Banerjee, D. P. K., Anandarao, B. G., Jain, S. K., & Mallik, D. C. V. 1990, A&A, 240, 137
- Blackman et al. (2001) Blackman, E. G., Frank, A., & Welch, C. 2001, ApJ, 546, 288
- Bodenheimer & Taam (1984) Bodenheimer, P., & Taam, R. E. 1984, ApJ, 280, 771
- Bryce et al. (2004) Bryce, M., Bains, I., López, J. A., Redman, M.P. 2004, in ASP Conf. Ser. 313, Asymmetrical Planetary Nebulae III (APN3): Winds, Structure and the Thunderbird, eds. M. Meixner, J. Kanstner, N. Soker, & B. Balick (San Francisco: ASP), 104
- Bryce et al. (1997) Bryce, M., López, J. A., Holloway, A. J., & Meaburn, J. 1997, ApJ, 487, 161
- Bujarrabal et al. (2001) Bujarrabal, V., Castro-Carrizo, A., Alcolea, J., & Sánchez Contreras, C. 2001, A&A, 377, 868
- Corradi (1995) Corradi, R. L. M. 1995, MNRAS, 276, 521
- Corradi (2003) Corradi, R. L. M. 2003, in ASP Conf. Ser. 303, Symbiotic Stars Probing Stellar Evolution, eds. R. L. M. Corradi, R. Mikolajewska, & T. J. Mahoney (San Francisco: ASP), 393
- Corradi et al. (2000) Corradi, R. L. M., Gonçalves, D. R., Villaver, E., Mampaso, A., Perinotto, M., Schwarz, H. E., & Zanin, C. 2000, ApJ, 535, 823
- Corradi & Schwarz (1993b) Corradi, R. L. M., & Schwarz, H. E. 1993b, A&A, 268, 714
- Corradi & Schwarz (1993a) Corradi, R. L. M., & Schwarz, H. E. 1993a, A&A, 278, 247
- Corradi & Schwarz (1995) Corradi, R. L. M., & Schwarz, H. E. 1995, A&A, 293, 871
- Dufour (1984) Dufour, R. J. 1984, ApJ, 287, 341
- Feibelman & Kondo (2001) Feibelman, W. A., & Kondo, Y. 2001, ApJS, 136, 735
- Gathier & Pottasch (1988) Gathier, R., & Pottasch, S. R. 1988, A&A, 197, 266
- García-Segura et al. (1999) García-Segura, G., Langer, N., Różyczka, M., & Franco, J. 1999, ApJ, 517, 767
- García-Segura et al. (2005) García-Segura, G., López, J. A., & Franco, J. 2005, ApJ, 618, 919
- Greenstein et al. (1985) Greenstein, J. L., Henry, R. J. W., & O’Connell, R. F. 1985, ApJ, 289, L25
- Hartl & Weinberger (1987) Hartl, H., & Weinberger, R. 1987, A&AS, 69, 519
- Henize (1967) Henize, K. G. 1967, ApJS, 14, 125
- Ignace et al. (1996) Ignace, R., Cassinelli, J. P., Bjorkman, J. E. 1996, ApJ, 459, 671
- Jordan et al. (2005) Jordan, S., Werner, K., & O’Toole, S. J. 2005, A&A, 432, 273
- Kurucz (1992) Kurucz, R. L. 1992, in IAU Symp. 149, The Stellar Populations of Galaxies, eds. B. Barbuy & A. Renzini (Dordrecht: Kluwer), 225
- Leone et al. (2003) Leone, F., Vacca, W. D., & Stift, M. J. 2003, A&A, 409, 1055
- Liebert et al. (2003) Liebert, J., Bergeron, P., & Holberg, J. B. 2003, AJ, 125, L348
- Manchado (2004) Manchado, A. 2004, in ASP Conf. Ser. 313, Asymmetrical Planetary Nebulae III (APN3): Winds, Structure and the Thunderbird, eds. M. Meixner, J. Kanstner, N. Soker, & B. Balick (San Francisco: ASP), 3.
- Manchado et al. (1996) Manchado, A., Guerrero, M. A., Stanghellini, L., & Serra-Ricart, M. 1996, The IAC morphological catalog of northern Galactic planetary nebulae (La Laguna: Instituto de Astrofísica de Canarias)
- Massey (1997) Massey, P. 1997, A User’s Guide to CCD Reductions with IRAF (Tucson: NOAO)
- Mayall & Cannon (1940) Mayall, M. W., & Cannon, A. J. 1940, Harvard Obs. Bull., No. 913, 7
- Méndez (1978) Méndez, R. H. 1978, MNRAS, 185, 647
- Méndez (1991) Méndez, R. H. 1991, in IAU Symp. 145, Evolution of Stars: the Photospheric Abudance Coonection, eds. G. Michaud & A. V. Tutukov (Dordrecht: Kluwer Academic Publishers), 375
- Méndez et al. (1990) Méndez, R. H., Herrero, A., & Manchado, A. 1990, A&A, 229, 152
- Méndez et al. (1988) Méndez, R. H., Kudritzki, R. P., Herrero, A., Husfeld, D., & Groth, H. G. 1988, A&A, 190, 113
- Minkowski (1938) Minkowski, R. 1938, Ann. Rep. Div. Mt. Wilson Obs., 28
- Miranda et al. (2001) Miranda, L. F., Gómez, Y., Anglada, G., & Torrelles, J. M. 2001, Nature, 414, 284
- O’Connor et al. (2000) O’Connor, J. A., Redman, M. P., Holloway, A. J., Bryce, M., López, J. A., & Meaburn, J. 2000, ApJ, 531, 336
- O’Toole et al. (2005) O’Toole, S. J., Jordan, S., Friedrich, S., & Heber, U. 2005, A&A, 437, 227
- Pascoli (1992) Pascoli, G. 1992, PASP, 104, 350
- Peimbert & Torres-Peimbert (1983) Peimbert, M., Torres-Peimbert, S. 1983, in IAU Symp. 103, Planetary Nebulae, ed. D. R. Flower (London), 233
- Phillips (2003) Phillips, J. P. 2003, MNRAS, 344, 501
- Phillips & Cuesta (1998) Phillips, J. P., & Cuesta, L. 1998, A&AS, 133, 381
- Phillips et al. (2005) Phillips, J. P., Cuesta, L. & Kemp, S. N. 2005, MNRAS, 357, 548
- Preite-Martinez et al. (1989) Preite-Martinez, A., Acker, A., Köppen, J., & Stenholm, B. 1989, A&AS, 81, 309
- Schwarz et al. (1992) Schwarz, H. E., Corradi, R. L. M., & Melnick, J. 1992, A&AS, 96, 23
- Schwarz et al. (1993) Schwarz, H. E., Corradi, R. L. M., & Stanghellini, L. 1993, in IAU Symp. 155, Planetary Nebulae, eds. R. Weinberger & A. Acker (Dordrecht: Kluwer Academic Publishers), 214
- Shaw & Kaler (1989) Shaw, R. A., & Kaler, J. B. 1989, ApJS, 69, 495
- Stanghellini et al. (1993) Stanghellini, L., Corradi, R. L. M., & Schwarz, H. E. 1993, A&A, 279, 52
- Stanghellini et al. (2000) Stanghellini, L., Shaw, R. A., Balick, B., & Blades, J. C. 2000, ApJ, 534, L167
- Stanghellini et al. (2002) Stanghellini, L., Villaver, E., Manchado, A., & Guerrero, M. A. 2002, ApJ, 576, 285
- Tifft et al. (1972) Tifft, W. G., Conolly, L. P., & Webb, D. F. 1972, MNRAS, 158, 47
- Tylenda et al. (1993) Tylenda, R., Acker, A., & Stenholm, B. 1993, A&AS, 102, 595
- Tylenda et al. (1991) Tylenda, R., Acker, A., Stenholm, B., Gleizes, F., & Raytchev, B. 1991, A&AS, 89, 77
- Vassiliadis & Wood (1994) Vassiliadis, E., & Wood, P. R. 1994, ApJS, 92, 125
- Vlemmings et al. (2006) Vlemmings, W. H. T., Diamond, P. J., & Imai, H. 2006, Nature, 440, 58
- Webster (1969) Webster, B. L. 1969, MNRAS, 143, 79
- Wickramasinghe & Ferrario (2000) Wickramasinghe, D. T., & Ferrario, L. 2000, PASP, 112, 873
- Willmarth & Barnes (1994) Willmarth, D., & Barnes, J. 1994, A User’s Guide to Reducing Echelle Spectra With IRAF (Tucson:NOAO)


| Object | PN G | B | V | Mag Ref | Tz(He II) | Tz Ref |
|---|---|---|---|---|---|---|
| K | ||||||
| HDW 5 | PN G218.910.7 | 16.55 | 16.29 | 2 | ||
| He 2-25 | PN G275.203.7 | 17.08 | 16.96 | 1 | 61 | 4 |
| He 2-36 | PN G279.603.1 | 11.96 | 11.37 | 1 | ||
| NGC 2818 | PN G261.9+08.5 | 19.58 | 3 | 215.0 | 4 | |
| He 2-64 | PN G291.7+03.7 | 48.3**Energy-Balance temperature. | 5 | |||
| He 2-123 | PN G323.9+02.4 | 17.55 | 16.84 | 1 | 60 | 4 |
| He 2-186 | PN G336.305.6 | 18.34 | 16.62 | 1 | 95.5 | 4 |
| MyCn 18 | PN G307.504.9 | 14.5 | 2 | 51.6 | 4 |
| Filter Number | Type | Central Wavelength | Bandwidth | Pixel Size |
|---|---|---|---|---|
| (nm) | (nm) | (arcsec) | ||
| 602 | U Bessel | 354.208 | 54.176 | 0.37 |
| 603 | B Bessel | 422.305 | 94.0709 | 0.37 |
| 606 | V Bessel | 542.605 | 104.471 | 0.33 |
| 608 | R Bessel | 640.962 | 154.175 | 0.33 |
| Exposures in seconds | ||||||
|---|---|---|---|---|---|---|
| Object | Observation Date | Echelle | U#602 | B#603 | V#606 | R#608 |
| HDW 5 | Feb 4, 2003 | 4x1800 | 20x2 | 20x2 | 20 | 20 |
| He 2-25 | Feb 4, 2003 | 4x1800 | 20 | 20 | 20 | 20 |
| He 2-36 | Feb 4, 2003 | 2x900 | 20 | 15 | 5 | 5 |
| NGC 2818 | Feb 5, 2003 | 2x1800 | 20 | 20 | 20 | 20 |
| He 2-64 | Feb 5, 2003 | 4x1800 | 20 | 20 | 20 | 20 |
| He 2-123 | Feb 5, 2003 | 1x1200+3x1800 | 20 | 20 | 20 | 20 |
| He 2-186 | Feb 5, 2003 | 2x1800 | 20 | 20 | 20 | 20 |
| MyCn 18 | Feb 4, 2003 | 4x900 | 20 | 20 | 20+5 | 20+5 |
| Object | 4686Å | 4958Å | 5007Å | 6563Å | 6584Å | c | |
|---|---|---|---|---|---|---|---|
| [ergs cm-2 s-1 Å-1] | He II | [O III] | [O III] | H | [N II] | ||
| He 2-25 | 1.90e-13aaIntegrated over the area | 0.04 | 145aaIntegrated over the area | 579aaIntegrated over the area | 2381aaIntegrated over the area | 17aaIntegrated over the area | 2.63 |
| He 2-36 | 1.24e-14aaIntegrated over the area | 196aaIntegrated over the area | 385aaIntegrated over the area | 1502aaIntegrated over the area | 545aaIntegrated over the area | 0.80 | |
| NGC 2818 | 5.34e-15aaIntegrated over the area | 75aaIntegrated over the area | 390aaIntegrated over the area | 1249aaIntegrated over the area | 549aaIntegrated over the area | 584aaIntegrated over the area | 0.81 |
| He 2-64 | 2.63e-14 | Stellar abs. | 17aaIntegrated over the area | 91aaIntegrated over the area | 548 | 264aaIntegrated over the area | 0.81 |
| He 2-123 | 1.05e-13 | 73aaIntegrated over the area | 239aaIntegrated over the area | 1495 | 852aaIntegrated over the area | 2.06 | |
| He 2-186 | 1.97e-13aaIntegrated over the area | 47 | 549 | 1852aaIntegrated over the area | 841aaIntegrated over the area | 516aaIntegrated over the area | 1.34 |
| MyCn 18 | 1.83e-12 | Stellar emi. | 113 | 290 | 590 | 282bbWide wings | 0.90 |
| ID | Flux | W | ||
|---|---|---|---|---|
| [Å] | [Å] | [ergs cm-2 s-1 Å-1] | [Å] | |
| HDW 5 | ||||
| N. I. | 5757.1 | -6.58e-16 | 0.7198 | |
| He2-36 | ||||
| 4101 | H | 4101.7 | -7.9e-14 | 4.0 |
| 4340 | H | 4340.4 | -1.8e-13 | 5.8 |
| 4861 | H | 4861.0 | -2.1e-13 | 4.9 |
| 4686 | He II | 4685.7 | -2.6e-15 | 0.05 |
| N. I. | 5780.1 | -1.9e-14 | 0.3 | |
| 5877 | He I | 5875.4 | -3.7e-15 | 0.05 |
| 6563 | H | 6563.0 | -1.8e-13 | 3.1 |
| He2-64 | ||||
| 4686 | He II | 4684.8 | -7.5e-16 | 0.4 |
| N. I. | 5281.8 | 2.1e-14 | -11.8 | |
| 5411 | He II | 5411.0 | -1.4e-15 | 0.7 |
| N. I. | 5759.0 | -2.0-15 | 1.1 | |
| He 2-123 | ||||
| 5801 | C IV | 5799.6 | 1.1e-15 | -1.7 |
| 5811 | C IV | 5810.7 | 8.3e-16 | -1.3 |
| MyCn 18 | ||||
| 4541 | He II | 4539.7 | -6.5e-15 | 0.8 |
| 4634 | N III | 4632.6 | 5.0e-15 | -0.6 |
| 4658 | C IV | 4656.2 | 9.3e-15 | -1.1 |
| 4686 | He II | 4684.7 | 2.0e-14 | -2.5 |
| N. I. | 5779.7 | -1.5e-15 | 0.2 | |
| 5811 | C IV | 5810.2 | 4.2e-15 | -0.6 |
| ID | Flux | W | ||
|---|---|---|---|---|
| [Å] | [Å] | [ergs cm-2 s-1 Å-1] | [Å] | |
| 4471 | He I | 4471.8 | -4.0e-16 | 0.3 |
| 4471.5 | 5.3e-16 | -0.3 | ||
| 5876 | He I | 5874.6 | -6.5e-16 | 0.4 |
| 5875.7 | 2.9e-15 | -1.9 | ||
| 6678 | He I | 6679.4 | -5.0e-16 | 0.5 |
| 6680.7 | 1.1e-15 | -1.1 |
| Flux | W | |
|---|---|---|
| [Å] | [ergs cm-2 s-1 Å-1] | [Å] |
| Single line measurement | ||
| 4779.9 | -5.2e-15 | 0.1 |
| Deblended lines, 8-pixel aperture | ||
| 4779.5 | -1.5e-15 | 0.03 |
| 4780.2 | -2.5e-15 | 0.05 |
| Deblended lines, 4-pixel aperture | ||
| 4779.6 | -1.7e-15 | 0.03 |
| 4780.2 | -1.8e-15 | 0.04 |