A near-infrared shock wave in the 2006 outburst of recurrent nova RS Ophiuchi
Abstract
Near-infrared spectra are presented for the recent 2006 outburst of the recurrent nova RS Ophiuchi (RS Oph).We report the rare detection of an infrared shock wave as the nova ejecta plows into the pre-existing wind of the secondary in the RS Oph system consisting of a white dwarf (WD) primary and a red giant secondary. The evolution of the shock is traced through a free expansion stage to a decelerative phase. The behavior of the shock velocity with time is found to be broadly consistent with current shock models. The present observations also imply that the WD in the RS Oph system has a high mass indicating that it could be a potential SNIa candidate. We also discuss the results from a recent study showing that the near-IR continuum from the recent RS Oph eruption does not originate in an expanding fireball. However, the present work shows that the IR line emission does have an origin in an expanding shock wave.
1 Introduction
RS Ophiuchi, the well known recurrent nova (RN), underwent its sixth recorded outburst recently on 2006 February 12. The five previous known eruptions of the object occurred in 1898, 1933, 1958, 1967 and 1985. The binary components of the RS Oph system consist of a massive white dwarf and a M8III giant with the orbital period of the system being 460 days (Fekel et al. 2000). While the outburst of a recurrent and a classical nova share a common origin in a thermonuclear runaway on a WD surface which has accreted matter from a companion star, an important post-outburst distinguishing feature between the two is that the high velocity ejecta in a recurrent nova outburst is immediately impeded by the surrounding wind of the red giant companion. This leads to the generation of a shock wave that propagates into the red giant wind. The temporal evolution of the shock and associated physical parameters like the shock velocity have been predicted theoretically but an astrophysical environment where such predictions can be rigorously tested are extremely rare to come by. Recurrent novae provide such an opportunity for testing and therefore have special significance. Another class of objects where similar shock waves are open to study are young supernova remnants but here the evolution of the shock occurs on the timescale of a few hundreds of years (vis-a-vis a few days for an analogous development to occur in a RN) making it difficult to follow the evolution in supernova remnants.
The recent outburst of RS Ophiuchi has been extensively studied at different wavelength regimes viz. in X-rays (Sokoloski et al. 2006; Bode et al. 2006), in the radio (O’Brien et al. 2006) in the infrared (Evans et al. 2006; Monnier et al. 2006) and in the optical (Iijima 2006; Buil 2006; Fujii 2006). The X-ray results clearly detect a X-ray blast wave that expands into the red giant wind. The XRT observations from the Swift satellite (Bode et al. 2006) trace the temporal change in the shock velocity based on a set of 8 observations between 3.16 to 26 days after the outburst. Similarly the Rossi X-ray Timing Explorer (RXTE) observations (Sokoloski et al. 2006) cover the shock wave evolution based on 6 epochs of observations between 3 days to 21 days after the eruption. In context of the above results, the current observations present some new aspects in addition to having the advantage of a more comprehensive temporal coverage. The major new result lies in our detection of an infrared shock wave which manifests itself through the narrowing of emission lines observed in the spectra. The detection of such a shock wave in the infrared has not been made earlier in a RN. The present data, which cover 23 epochs of observation between 1 to 47 days after outburst, also have significantly better sampling, especially in the first 20 days after outburst when fairly fast changes are seen in the shock evolution. Additionally, the data cover a much more extended period. Thus this appears to be the most comprehensive data set available for analysing the shock evolution in RS Oph-like systems and for validating related theoretical models. While we make such an analysis, based on the theoretical shock model of Bode Kahn (1985), some deviations that are seen between model and observations suggest the data set could be invaluable for testing alternative models that may be proposed subsequently or for introducing refinements/modifications in presently available ones. We also use our observations to discuss the recent result of Monnier et al. (2006) which rules out the origin of the near-IR emission to be from hot gas in an expanding shock.
2 Observations
Since its outburst in February 2006, near-IR spectra of RS Oph have been taken extensively from the 1.2m telescope at the Mt. Abu Observatory. An early set of spectra, taken soon after the outburst, is described in Das, Ashok Banerjee (2006). In the present work, we concentrate on the band spectra with the primary aim of establishing the detection of a shock wave in the near-infrared. A more detailed analysis of other aspects of the band data and also the remaining and band data - involving both spectroscopy and photometry results - will be addressed in a future work. The band spectra presented here were obtained at a dispersion of 9.5 Å/pixel using a Near Infrared Imager/Spectrometer with a 256256 HgCdTe NICMOS3 array. Generally, a set of at least two spectra were taken with the object dithered to two different positions along the slit. The spectrum of the comparison star SAO 122754 (spectral type A0V), after removing the hydrogen absorption lines in its spectrum by interpolation, was used to ratio the spectra of RS Oph. The object and the comparison star were always observed at similar air-mass to ensure the ratioing process reliably removes the telluric lines in the RS Oph spectra. Wavelength calibration was done using OH sky lines that register with the spectra and spectral reduction and analysis were done using IRAF tasks. The observational details are presented in Table 1 - the outburst date is assumed to be 12.83 Feb 2006 (Hirosawa 2006)
3 Results
The J band spectra are shown in Figure 1. The prominent lines seen are
HeI (1.0833m) and Paschen (1.0938m) - these two lines are blended in the early spectra, OI lines at 1.1287m and 1.3164m and Paschen at 1.2818m. The presence of a few weaker lines, seen later after the outburst, will be discussed in a future paper. All the
emission lines strikingly show a narrowing with time - a phenomenon also
seen during in the UV during the 1985 outburst (Shore et al. 1996). Such
a behavior implies a reduction
in expansion velocity best explained by associating the
line emitting matter with a decelerating shock wave. The propagation of the shock wave
in RS Oph-like systems, assuming a spherical geometry, has been studied earlier and can be divided into three
phases (Bode Kahn 1985). In Phase 1 - or the ejecta dominated stage - the ejecta expands freely into the red giant wind and produces a shock at constant velocity.
In Phase 2, the shock wave is driven into the wind and the shocked material is
so hot that there is negligible cooling by radiation losses - hence called the
adiabatic phase. During this phase a deceleration is seen in the shock whose velocity vs versus time t is expected to behave as
vs t-1/3 assuming a r-2 dependence for the decrease in density of the
wind. In Phase 3, the shocked material has cooled by radiation and here
the expected dependence of the shock velocity is vs t-1/2.
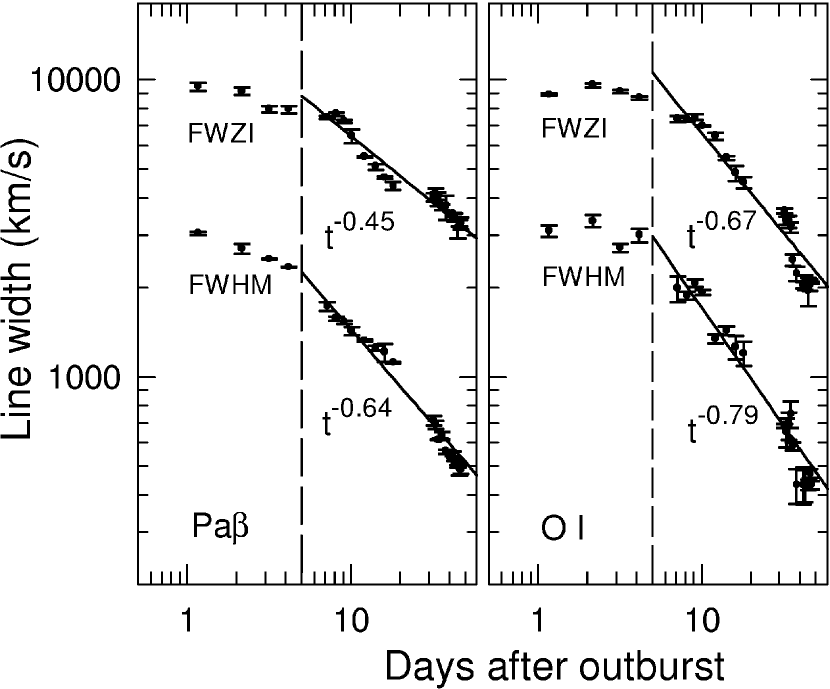
To confirm whether these dependencies are indeed observed, we select the Pa 1.2818m and the OI 1.1287m lines
for detailed analysis. These lines are strong yet unblended
by other lines (unlike the HeI 1.0833m and Pa 1.0938m lines) ensuring a reliable estimate of their widths. We interpret the observed line widths to be due to kinematic broadening i.e. caused by the dispersion of the line-of-sight
velocity component from matter at different parts of an expanding shell (which we assume to be spherical). In this
case, the FWHM and FWZI (full width at half maximum and zero intensity respectively) are good indicators of the expansion velocity (i.e. the
shock velocity). In particular, half the FWZI should be a reasonably good measure of
the expansion velocity since the largest blue-shifted and red-shifted velocities seen
in the FWZI come from those parts of the shell that are directly approaching or
receding from the observer. We present the observed line widths in Table 2. Since
the observed FWHM of the lines at later stages (beyond March 20) is comparable to the
FWHM of the instrument profile (which is well approximated by a Gaussian with FWHM = 450
km/s; FWZI = 1350 km/s) we have deconvolved for the instrument broadening. For this, we
have used the simple, but sufficiently adequate, approximation that the square of the
observed FWHM equals the sum of the squares of the instrument and true FWHM’s (and
similarly so for the FWZI). This assumes a gaussian nature for the observed profiles
which we find to be reasonably valid. The effect of the deconvolution is found to be rather small for the observations prior to 20 March which compose the bulk of the data.
We have also considered whether optical depth effects could have
affected the line profiles and hence their widths. This appears unlikely especially for
the hydrogen recombination lines. The results of Evans et al. (2006) and also our
H band data (to be presented elsewhere) show that the strength of the hydrogen lines
can be approximated by Case B predicted strengths indicating that they are optically
thin. About the OI line we cannot be certain, but its column density is expected
to be several orders lower than that of hydrogen (by virtue of a lower abundance) and
hence it is unlikely to be optically thick when the hydrogen lines are not so. We show
the temporal variation of the deconvolved widths of the selected lines with time in
Figure 2.
Figure 2 first establishes that there is indeed a stage of free expansion - lasting
approximately 4 days - during which the shock velocity remains approximately constant.
This behavior is more evident in the OI data vis-a-vis the Pa data which
suggests there
may be a mild deceleration during this phase. Following Phase 1, a deceleration
is seen and since this slowing down occurs only after the ejecta has swept up mass from
the red
giant wind comparable to the ejecta mass, the onset of deceleration can be used
to estimate the mass of the ejected shell. Following Sokoloski et al. (2006), we
assume the density in the binary to
be 109 cm-3 from constraints on the mass-loss rate of the red
giant (Dobrzycka Kenyon 1994) and adopt a mean initial
expansion velocity in the range 3500-4000 km/s based on our results and optical
reports (Buil 2006; Fujii 2006). Thus by day 4, the swept up mass (or equivalently the
ejected shell mass) is estimated to have a mean value of
3x10⁻⁶⊙.
This value reasonably matches with the Hachisu Kato (2001) model for RS Oph
which estimates that an ejecta mass
of 2x10⁻⁶⊙ needs a mass of 1.35⊙ for the
white dwarf. We therefore independently infer that RS Oph certainly contains a
massive WD with a mass close to 1.35⊙
- a similar conclusion is reached from alternative methods viz. from a lightcurve
analysis (Hachisu Kato 2001) and from X-ray observations (Solokoski et al. 2006).
We find that the decelerative phase, for both the OI and Pa lines is reasonably
well reproduced by power law fits of the form t-α with
varying between 0.45 to 0.79. Using a nonlinear regression
technique, the best fits were determined by maximizing the correlation coefficient with a value of = 1 describing a perfect fit. The plots in Figure 2 have values of 0.977, 0.988, 0.976 and 0.975 for the FWZI and FWZM of the
Pa and OI lines respectively. A mean value of = 0.64 (with
a standard deviation of 0.14 ) can be said to characterize the data which is consistent with the Swift results (Bode
et al. 2006) wherein a value of = 0.6 is obtained. We do note
that the results in Figure 2 do suggest the need of using more than
one power law for different segments. However, our present aim is to obtain a simple
yet reasonable assessment
of the overall behavior of the line-widths and therefore we elect to use a single
power law. We note that there seems to be a lack - or a very short-lived duration of
Phase II (the
Sedov-Taylor phase) in our data. While the reason for this is not clear, it is possible
that the cooling of the ejecta begins very quickly. We find that the mean value of
= 0.64 compares better to
the expected value of 0.5 for Phase III rather than 0.33 expected in Phase II
(Bode Kahn 1985). Thus there are deviations in the observed data from
expected model predictions. It is possible that a part of such variations arise from
the assumption of spherical symmetry that is being invoked. But as the radio imaging
(O’Brien et al. 2006) and interferometric results (Monnier et al. 2006) show, the
ejecta remnant has deviations from spherical symmetry and also jet-like structures.
Such variations in geometry are expected to affect the observed line profiles.
A treatment of these effects is expected to be involved and beyond the scope of the
present work. However, we find that on the whole, our results are broadly consistent
with the shock model wherein
a free expansion stage is expected to be seen followed by a decelerative stage
characterized by a power law decay in the shock velocity. We thus believe that
the observations clearly support the presence of an infrared shock wave
in the recent outburst of RS Oph.
While the near-IR line emission, as seen from the Pa and OI line behavior, is associated with a moving shock, the site of its emission within the shock structure needs to be examined. The structure of the shock is understood to consist of a cool contact surface (i.e. the region of discontinuity) positioned between the hot compressed region consisting of the ejecta material and the hot swept-up red giant wind (e.g. Lamers Cassinelli 1999). The last two regions are the sites where the shocked gas is heated to the extremely high temperature of 108K (as determined for RS Oph; Sokoloski et al. 2006; Bode at al. 2006) and which is the source of the observed X-ray emission. Clearly the IR line emission cannot emanate from these zones because the presence of neutral OI atoms in such a hot region is not possible. Thus we think that the near-IR emission originates from the contact surface, which is considerably cooler and denser, but which still propagates with the same velocity as the shock front (Lamers Cassinelli 1999) thereby leading to similar kinematic behavior for the shock velocity as predicted for the X-rays (Bode Kahn 1985).
4 Discussion
Monnier et al. (2006) measured the near-infrared (H and K band) size of RS Oph during the recent outburst using interferometry to show that the object displays a near-constant size of 3 milli-arcseconds (mas) over the first 60 days of the outburst. At a distance of 1.6 kpc to RS Oph, the near-IR emission is expected to expand at the rate of 1 mas per day if associated with an expanding shock. Since this is not seen, these authors are led to the interesting conclusion that the IR continuum does not arise from an expanding fireball - a scenario favored to explain novae outbursts. In context of this, we note that the net IR emission consists of two parts - the continuum and the line emission. Regarding the line emission, the present results clearly show that it originates from an expanding shock. This does not resolve the extent and site of origin of the near-IR continuum i.e. what part could arise from the expanding shock wave vis-a-vis the fraction that arises from other sites/mechanisms (e.g. the alternative theory of Hachisu Kato 2001). But an aspect of the Monnier et al. (2006) data, which maybe worthwhile to reexamine, is whether they do detect a faint signature associated with the expanding shock front. The reason to expect such a detection is that our H band spectra (also see the Evans et al. 2006 spectra), taken contemporaneously with Monnier et al. (2006), are replete with strong Brackett series lines. The combined flux contribution from these lines is estimated to be 15-20 percent relative to the continuum. It would therefore appear likely that some signature of this line emission, though weaker than the continuum, should be detected and show up in expansion in the interferometric data.
References
- ref (2) Bode, M. F., Kahn, F., 1985, MNRAS, 217, 205
- ref (4) Bode, M.F., et al. 2006, astro-ph/0604618
- ref (5) Buil, C. 2006, CBAT 403
- ref (5) Das, R.K., Ashok, N. M., Banerjee, D. P. K. 2006, IAUC 8673
- ref (5) Dobrzycka, D., Kenyon, S.J. 1994, AJ, 108, 2239
- ref (5) Fujii, M. 2006, IAUC 8869
- ref (5) Evans, A. et al. 2006, MNRAS, in press; astro-ph/0609394
- ref (5) Fekel, F.C., Joyce, R.R., Hinkle, K.H., Skrutsie, M.F. 2000 AJ, 119, 1375
- ref (5) Hachisu, I., Kato, M. 2001, ApJ, 558, 323
- ref (20) Hirosawa, K. 2006, IAUC 8671
- ref (20) Iijima, T. 2006, IAUC 8675
- ref (10) Lamers, H.J.G.L.M., Cassinelli, J.P. 1999, Introduction to Stellar Winds, Cambridge University Press, UK.
- ref (17) Monnier, J.D., et al. 2006 ApJ, 647, L127
- ref (20) O’Brien, T.J., et al. 2006, Nature, 442, 279
- ref (10) Shore, S.N., Kenyon, S.J., Starrfield, S., Sonneborn, G.1996, ApJ, 456, 717
- ref (25) Sokoloski, J.L., Luna, G.J.M., Mukai, K., Kenyon, S.J. 2006, Nature, 442, 276

| Date (UT) | Days after | Int. | Date(UT) | Days after | Int. |
|---|---|---|---|---|---|
| 2006 | outburst | time(s) | 2006 | outburst | time (s) |
| Feb 13.9929 | 1.1629 | 10 | Mar 16.9465 | 32.1165 | 20 |
| Feb 14.9915 | 2.1615 | 10 | Mar 17.8866 | 33.0566 | 30 |
| Feb 15.9898 | 3.1598 | 10 | Mar 18.9372 | 34.1072 | 30 |
| Feb 16.9866 | 4.1566 | 10 | Mar 19.8833 | 35.0533 | 30 |
| Feb 19.9759 | 7.1459 | 10 | Mar 20.8733 | 36.0433 | 45 |
| Feb 20.9721 | 8.1421 | 5 | Mar 22.8682 | 38.0382 | 45 |
| Feb 21.9463 | 9.1163 | 10 | Mar 26.8778 | 42.0478 | 60 |
| Feb 22.9505 | 10.1205 | 10 | Mar 27.8644 | 43.0344 | 60 |
| Feb 24.9705 | 12.1405 | 10 | Mar 29.8462 | 45.0162 | 75 |
| Feb 26.9926 | 14.1626 | 10 | Mar 30.8629 | 46.0329 | 75 |
| Feb 28.9542 | 16.1242 | 15 | Mar 31.8701 | 47.0401 | 90 |
| Mar 2.9465 | 18.1165 | 20 |
| Days | Pa | Pa | OI | OI | Days | Pa | Pa | OI | OI | |
|---|---|---|---|---|---|---|---|---|---|---|
| after | fwhm | fwzi | fwhm | fwzi | after | fwhm | fwzi | fwhm | fwzi | |
| outburst | km/s | km/s | km/s | km/s | outburst | km/s | km/s | km/s | km/s | |
| 1.16 | 3066 | 9561 | 3136 | 9009 | 32.12 | 839 | 4236 | 850 | 3853 | |
| 2.16 | 2738 | 9228 | 3375 | 9647 | 33.06 | 822 | 4330 | 824 | 3614 | |
| 3.16 | 2532 | 8051 | 2764 | 9221 | 34.11 | 758 | 4189 | 850 | 3588 | |
| 4.16 | 2381 | 8063 | 3029 | 8770 | 35.05 | 759 | 4026 | 904 | 3455 | |
| 7.15 | 1782 | 7595 | 2046 | 7494 | 36.04 | 775 | 3955 | 771 | 2817 | |
| 8.14 | 1632 | 7759 | 1940 | 7441 | 38.04 | 715 | 3961 | 664 | 2604 | |
| 9.12 | 1587 | 7361 | 2126 | 7600 | 42.05 | 708 | 3768 | 664 | 2445 | |
| 10.12 | 1489 | 6595 | 1993 | 7122 | 43.03 | 690 | 3698 | 664 | 2471 | |
| 12.14 | 1398 | 5648 | 1435 | 6590 | 45.02 | 669 | 3452 | 664 | 2365 | |
| 14.16 | 1326 | 5266 | 1515 | 5607 | 46.03 | 660 | 3557 | 691 | 2445 | |
| 16.12 | 1287 | 4868 | 1355 | 5023 | 47.04 | 659 | 3557 | 664 | 2471 | |
| 18.12 | 1203 | 4587 | 1302 | 4704 |