NICMOS Imaging of DRGs in the HDF-S: A Relation Between Star-Formation and Size at 11affiliation: Based on observations with the NASA/ESA Hubble Space Telescope, obtained at the Space Telescope Science Institute, which is operated by the Association of Universities for Research in Astronomy, Inc., under NASA contract NAS 5-26555. These observations are associated with program # 9723.
Abstract
We present deep, high angular-resolution HST/NICMOS imaging in the Hubble Deep Field South (HDF-S), focusing on a subset of 14 Distant Red Galaxies (DRGs) at galaxies that have been pre-selected to have . We find a clear trend between the rest-frame optical sizes of these sources and their luminosity-weighted stellar ages as inferred from their broad-band spectral energy distributions (SEDs). Galaxies whose SEDs are consistent with being dusty and actively star forming generally show extended morphologies in the NICMOS images ( kpc), while the 5 sources which are not vigorously forming stars are extremely compact ( kpc). This trend suggests a direct link between the mean ages of the stars and the size and density of the galaxies and supports the conjecture that early events quench star-formation and leave compact remnants. Furthermore, the compact galaxies have stellar surface mass densities which exceed those of local galaxies by more than an order of magnitude. The existence of such massive dense galaxies presents a problem for models of early-type galaxy formation and evolution. Larger samples of DRGs and higher spatial resolution imaging will allow us to determine the universality of the results presented here for a small sample.
Subject headings:
galaxies: high-redshift — galaxies: fundamental parameters — galaxies: evolution — galaxies: formation — infrared: galaxies1. Introduction
In the local universe, the star-formation rate per stellar mass (specific star-formation rate) correlates strongly with galaxy concentration and stellar mass surface density (; Kauffmann et al., 2003; Brinchmann et al., 2004). The high concentration, high early-type galaxies may result from the relationship between surface gas density and star-formation rate (or efficiency) during their formation epoch. In any case, these relations are likely indicative of a fundamental principle of galaxy formation and evolution. By determining whether these, or similar, relations hold during earlier cosmic epochs we may address questions such as: Where are the majority of stars formed? Is the same event which truncates star-formation in early-type galaxies responsible for their morphological transformation, i.e., are there red disk galaxies and/or blue early-types?
A vast majority of the known UV-selected high redshift () galaxies are rapidly forming stars. It is perhaps not surprising then, that most of these galaxies have irregular or spiral morphologies (Giavalisco, Steidel, & Macchetto, 1996; Labbé et al., 2003; Chapman et al., 2003; Conselice et al., 2004; Papovich et al., 2005). This is only half of the story. To test whether a morphology–star-formation relation exists at high redshift one must first identify the more quiescent galaxies at similar redshifts, if they exist. Searches for passive galaxies benefit by moving to the rest-frame optical where the light is not dominated by young stars. At high-redshift this requires observations in the near-infrared or longer wavelengths. Only recently have deep near-infrared (rest-frame optical) studies been undertaken using 8m-class telescopes. The Faint Infrared Extragalactic Survey (FIRES; Franx et al. 2003) using ESO/VLT, for example, has discovered a class of galaxies (Distant Red Galaxies; DRGs) which are not as UV bright as previously optically-selected galaxies at . These sources are selected using the color-cut which corresponds to rest-frame at . Galaxies can have red colors for primarily two reasons: they can have luminous starbursts which are highly dust reddened or they can have a large mass of evolved stars (Cimatti et al., 2002; Franx et al., 2003; van Dokkum et al., 2004; Labbé et al., 2005). The brightest of these DRGs have now been confirmed and studied spectroscopically in the near-infrared (Kriek et al., 2006a; Kriek et al., 2006b).
By combining rest-frame optical sizes and multi-wavelength spectral energy distributions we can begin to discern the evolutionary pathways of galaxies at various redshifts (e.g., Rix et al., 2004; Trujillo et al., 2004; Trujillo et al., 2006a). At redshifts greater than unity, this requires excellent data in the near-infrared for both object selection and morphologies. Previous studies of NIR-selected galaxy sizes have derived general evolutionary trends using ground-based (lower spatial resolution) data and have not addressed the relation between galaxy size and star-formation (e.g., Trujillo et al., 2004; Trujillo et al., 2006a). In this article we present deep, high spatial-resolution near-infrared imaging of 14 of these DRGs using the Near-infrared Camera and Multi-object Spectrograph (NICMOS) on-board the Hubble Space Telescope (HST). These images cover the HDF-S (Williams et al., 2000; Casertano et al., 2000) in the F160W () passband and are of sufficient quality to determine the rest-frame optical sizes of this recently discovered population of galaxies. The availability of broad-band imaging data out to rest-frame -band allows us to relate galaxy size to the SED We use a cosmology with and throughout. At one arcsecond subtends 8.2 physical kpc and one NICMOS Camera 3 resolution element (FWHM ) corresponds to 2.1 kpc. The stellar masses inferred via spectral fitting are derived using a Salpeter initial mass function with mass range .
2. NICMOS Imaging and Sample Selection
The primary dataset used in this paper is NICMOS imaging of the Hubble Deep Field South (HDF-S). Eight pointings of NICMOS Camera 3 were required to cover the full WFPC2 field of the HDF-S. Camera 3 has a field-of-view of approximately 50 on a side at a pixel scale of . Each of these 8 pointings was imaged using a six point, sub-pixel dither pattern to better sample the point-spread function (PSF). The individual exposures were reduced in the usual fashion using the pipeline within IRAF and taking particular care to mask out deviant pixels. The dither offsets were determined using cross-correlation and inter-pointing offsets were measured using the ground-based VLT/ISAAC imaging data as a reference frame. These shifts were used as input to the drizzle task in IRAF which was used to create the full mosaic of the field. The combined data reach a 3 depth of 25.0 AB magnitudes in a radius circular aperture and have an average integration time of 5200 s.
We focus the current study on the 14 Distant Red Galaxies (DRGs) in this field. The results presented here depend on previous work, primarily rest-frame near-infrared imaging from Spitzer/IRAC and the subsequent broad-band spectral energy distribution (SED) fits (Labbé et al., 2005). We follow the object numbering used by Labbé et al. (2005). These broad-band data have been used to determine the photometric redshifts, stellar masses and star-formation properties of these DRGs (Rudnick et al., 2001, 2003; Labbé et al., 2005; Wuyts et al., 2006). We note that we use the Rudnick et al. (2003) photometric redshifts rather than the revised versions used in Rudnick et al. (2006) which are systematically higher. Object 327 is blended with a nearby source in the -band data. We present the NICMOS data and profile fits for 327 but exclude it from any analysis dependent on the longer wavelength data. Objects 66 and 810 had relatively poor SED fits. For 66 this is likely due to emission-line contamination of the broad-band fluxes, a conjecture confirmed by spectroscopy. However we expect that its derived stellar mass is relatively unaffected. For 810 the source of the poor fit is less clear and we therefore qualify its high mass and lack of star-formation as tentative claims.
3. Galaxy Sizes and Morphologies
We have determined galaxy sizes by fitting PSF-convolved, analytic surface-brightness profiles to each of the 14 DRGs in the HDF-S sample. For each galaxy we use individually generated TinyTim (Krist, 1993) model point-spread functions (PSFs). The final PSFs were combined in the same manner as the data itself to account for both the variation of the instrumental response over the detector and the dependence of the reconstructed PSF on the drizzle algorithm. To assess the dependence of our results on the assumed PSF we have also constructed a PSF from a suitably bright and isolated star in our final mosaic. We then fit full two-dimensional convolved models to the data using both an “in-house” code (Franx, 1993; van Dokkum & Franx, 1996) and the publicly-available GALFIT code (Peng et al., 2002) with both the model and stellar PSFs. By fitting both model PSFs and a star to other stars in the field we derived a (conservative) minimum measurable size of approximately or half one pixel. All of the derived galaxy sizes are above this limit. We used the data pixel weights to optimize the fits and the SExtractor object segmentation map to mask neighboring sources.
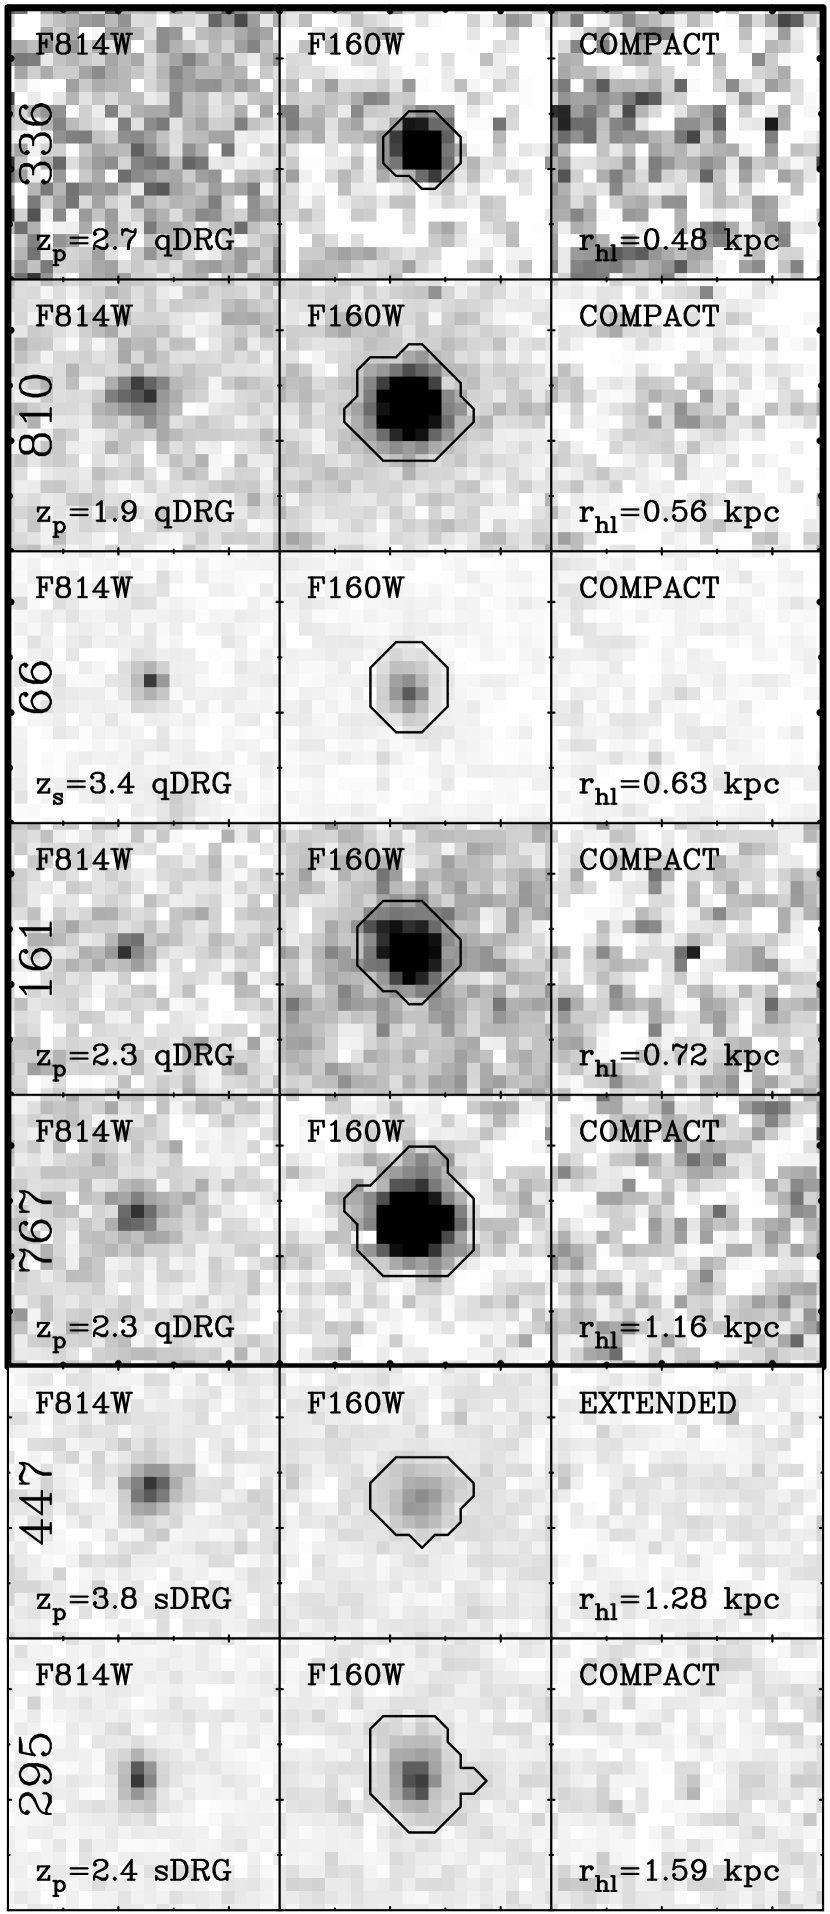
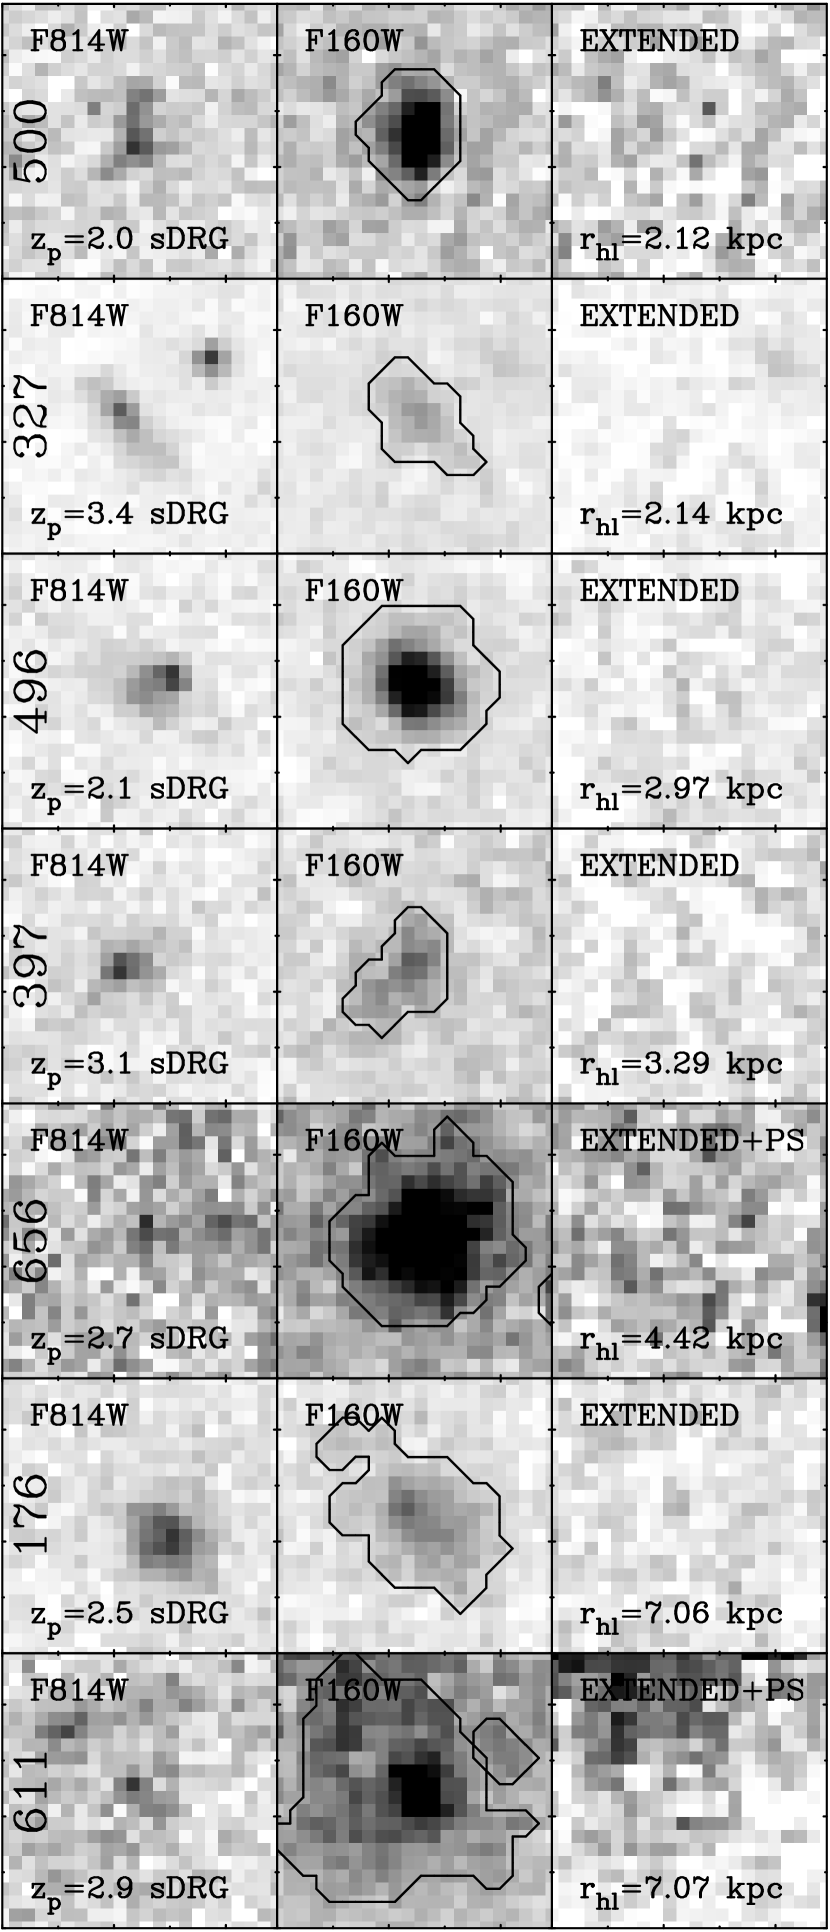
We fit Sersic profiles (Sersic, 1968) to the data, allowing the shape index () to take the values 1 (exponential disk), 2, 3 and 4 (-law). For each fit, we calculated the circularized half-light radius () of the best-fitting model. The optical, NIR and model residual images for each galaxy are shown in Figure 1. We have defined a compact galaxy to be one with an smaller than one pixel or resolved with a best-fit profile.
The results are essentially unchanged whether the model or stellar PSF was used for convolution. The largest difference (but still within the errors) was for the smallest source, 66, whose best-fit size increased by 18% when the stellar PSF was used. For the other galaxies the change was never larger than 15% in either direction and exhibited no systematic change. The results from the two fitting codes also agreed to within 5-10% in every case with no observable systematic trend. Comparison between our galaxy sizes and those found by Trujillo et al (2006) agree within a few percent for the two galaxies which are well-resolved () in their ground-based data. For the compact galaxies the sizes derived using the NICMOS data are systematically smaller by about 10% than the ground-based determinations when using the same Sersic values.
As with any galaxy fitting, our results may be skewed by deviations from the assumed analytic profiles or by limitations of the data themselves. If an unresolved central source (active nucleus or starburst) is present, the true profile will not be well-represented by one of our analytic galaxy profiles. Object 66 contains a spectroscopically confirmed active nucleus, and object 767 shows an excess at observed 8m which may be due to an AGN. However, the strong break in the rest-frame optical and the high quality-of-fit for these quiescent SEDs (see §4) argues against AGN significantly biasing our size measurements based on the NICMOS data. Furthermore, none of the DRGs are detected in the radio imaging in the HDF-S (Huynh et al., 2005). Object 767 is detected in the Spitzer/MIPS m imaging perhaps due to an AGN. Our galaxy size measurements could be biased to smaller values if as little as 10% of the light is coming from the nucleus (e.g., Daddi et al., 2005). However, even for extremely powerful radio galaxies at essentially zero rest-frame UV light escapes the central region (Zirm, Dickinson, & Dey, 2003). Daddi et al. (2005) find several small, quiescent galaxies at , two of which are very obscured X-ray sources . It is unclear how heavy obscuration at X-ray wavelengths would not correspond to complete nuclear extinction at rest-frame UV wavelengths. Unfortunately, there is no suitable X-ray data for this field. We cannot rule out that some of these DRGs contain powerful AGN but consider it unlikely that AGN are responsible for every small derived galaxy size in this sample.
The surface-brightness (SB) limit for our imaging is AB magnitudes arcsec-2. Lower SB features such as extended disks may be undetected in our data and hence will be missing from our fits. To search for low SB emission around the compact DRGs we stacked the images of the compact galaxies to form a composite image. This deeper summed image shows no discernible evidence for an extended component. Comparison of ground-based -band and NICMOS total galaxy magnitudes shows good agreement and no systematic offset indicating missed light in the space-based imaging. Furthermore, there is no obvious visual indication of extended structures in the WFPC2 (rest-frame UV) data for the compact galaxies. We present the full size distributions in the bottom panel of Figure 2 and discuss their implications in the next section. The sizes are given in Table 1.
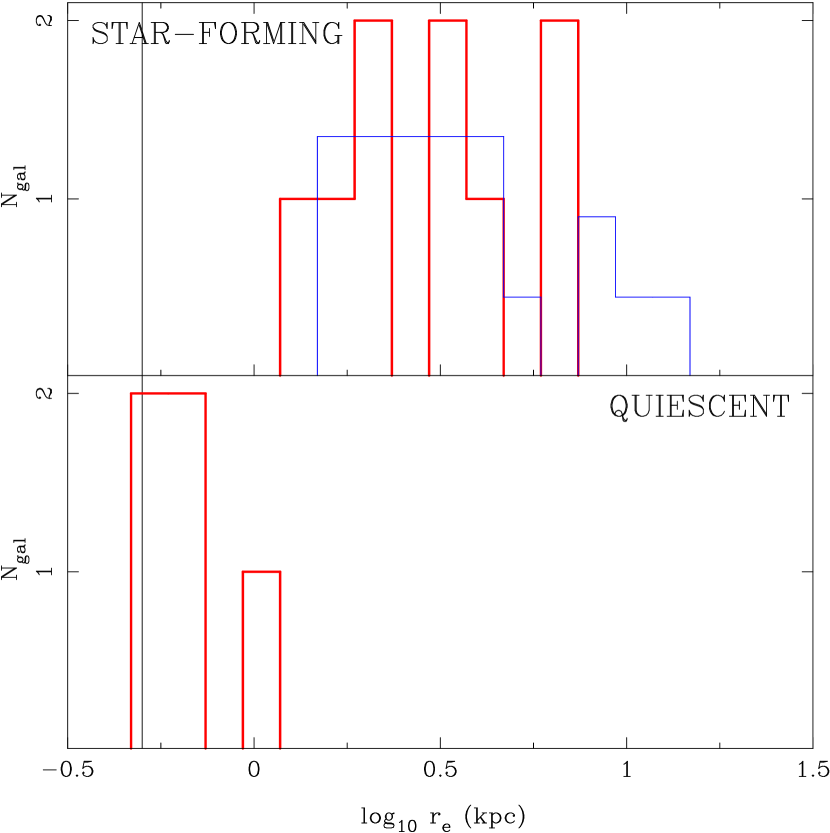
As a comparison sample, we also fit profiles to all the galaxies in the HDF-S which have been selected using the ‘Lyman-break’ technique (LBGs; Madau et al. 1996). These galaxies were selected and their photometric redshifts, masses and sizes derived from the same exact dataset used for the DRGs. They have the same mean redshift as the DRG sample (). The size distribution of the LBGs is also shown in Figure 2.
4. Correlation Between Galaxy Size and Star Formation Rate
In Labbé et al. (2005) and Wuyts et al (2006, in press), we have previously fit model spectral energy distributions (SEDs) to the observed broad-band colors of the DRGs to infer their luminosity-weighted stellar ages and derive stellar masses. The ground-based near-infrared and space-based optical photometry were combined with data from Spitzer/IRAC to construct the galaxies’ SEDs. In order to characterize the star formation properties of the galaxies, we fitted two simple models from Maraston (2005) to each source SED: a single stellar population without dust, and a constant star formation model with dust. We refer to the galaxies best fitted by the dust-free SSP model as “qDRGs”, for “quiescent”, and to the galaxies best fitted by the constant star formation model as “sDRGs”, for “star-forming.” We stress that these models are simplifications, as in reality there is probably a large range in star formation rates and ages. This characterization allows us to compare the properties of the galaxies with the highest and lowest specific star formation rates. These same data have been used to derive stellar masses for the DRGs (see Table 1; Wuyts et al. 2006, in press). As we will discuss further below, we have decided to use Maraston (2005) models to derive conservatively low masses for these galaxies. The lack of spectroscopic redshifts and emission line diagnostics precludes a more detailed analysis (e.g., Kriek et al., 2006b). The dusty star-forming population outnumbers the qDRGs by 9 to 5 in the HDF-S.
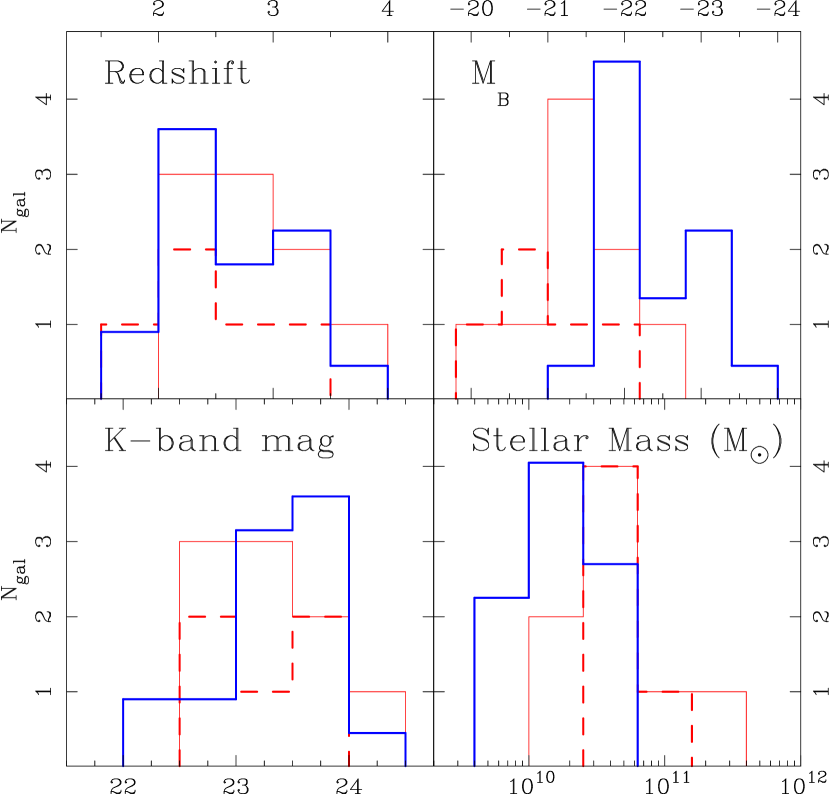
When we combine these results on the ages with the galaxy size determinations from the NICMOS imaging we identify a clear trend for the quiescent galaxies to be smaller than their star-forming cousins at high redshift, with little overlap between the two galaxy types. Figure 2 show the galaxy effective radius distributions for the two populations. It is important to identify whether the correlation involves a third parameter with which both morphology and star-formation rate are individually related, e.g. redshift, luminosity or stellar mass. In Figures 2 and 3 we show the size, redshift, luminosity, mass and apparent magnitude distributions for the two sub-populations and the LBG comparison sample. It is clear that the overlap between the two DRG sub-samples is greater in redshift, mass, luminosity and apparent magnitude than in size. Therefore it appears that there is a direct correlation between galaxy size and stellar age. Additionally, comparison with the sizes of other star-forming galaxies (LBGs) in the same redshift range shows that their size distribution is consistent with that of the star-forming DRGs (see Figure 2).
This trend of older stellar populations to be contained in compact structures is qualitatively consistent with the morphology-color correlation observed in the local universe (Kauffmann et al., 2003; Brinchmann et al., 2004). More generally, the existence of compact galaxies with little or no star-formation supports the suggestion by Faber et al. (2005) and others that the same event is responsible for both the cessation of star-formation and the morphological transformation from late- to early-type. Furthermore, our results show that massive, centrally-concentrated galaxies exist within Gyrs of the Big Bang.
5. qDRG Mass Densities
The quiescent distant red galaxies (qDRGs) are of particular interest because of their small sizes, high inferred stellar masses and implied early formation. Their large mass of stars and lack of vigorous current star-formation suggest that they have had at least one major star-formation episode which has now ceased. In the left panel of Figure 4 we plot the half-light radius versus the observed color. For galaxies, redder colors can either indicate lower specific star formation rates or higher dust content (Labbé et al., 2005). The quiescent DRGs (filled red circles) are clearly separated from the star-forming populations in this plot. The two red circles connected by a line indicates the maximal offset due to convolution with different PSFs for object 66.
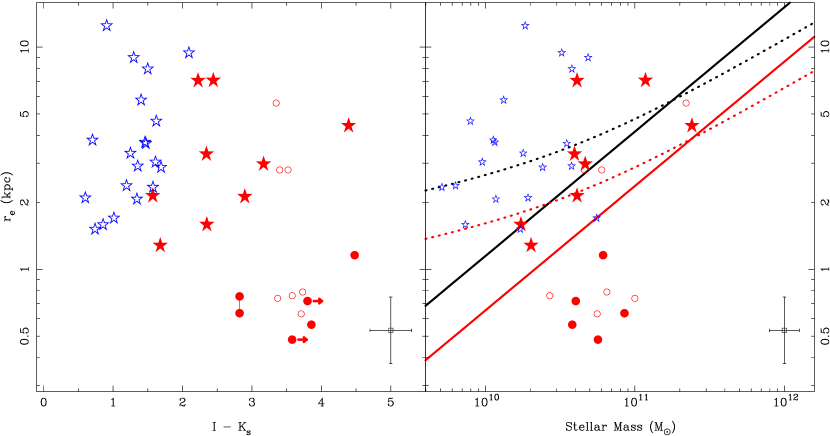
In the right panel of Figure 4 we show half-light radius versus stellar mass for the DRGs and LBGs in the HDF-S. The over-plotted lines show the size-mass relation for local early-type (solid line) and late-type (dotted line) galaxies () from the Sloan Digital Sky Survey (SDSS; Shen et al. 2003). It is clear that the qDRGs are rather different from local early-types. Recent studies of the evolution in the size-mass relation (Trujillo et al., 2004; Trujillo et al., 2006a) find that galaxies with comparable stellar masses to the qDRGs were a factor 1.7 smaller at higher redshifts than locally, qualitatively consistent with the observed trend in our data. However the qDRGs are still much smaller than the evolution would predict. This is likely due to the inclusion of the full galaxy population to derive the evolution and scatter in the evolution prediction. Our results also agree with direct (rest-frame UV) size measurements of quiescent galaxies at (Daddi et al., 2005). However, by the early-type population does not show many galaxies in the size-mass region of the qDRGs (McIntosh et al., 2005).
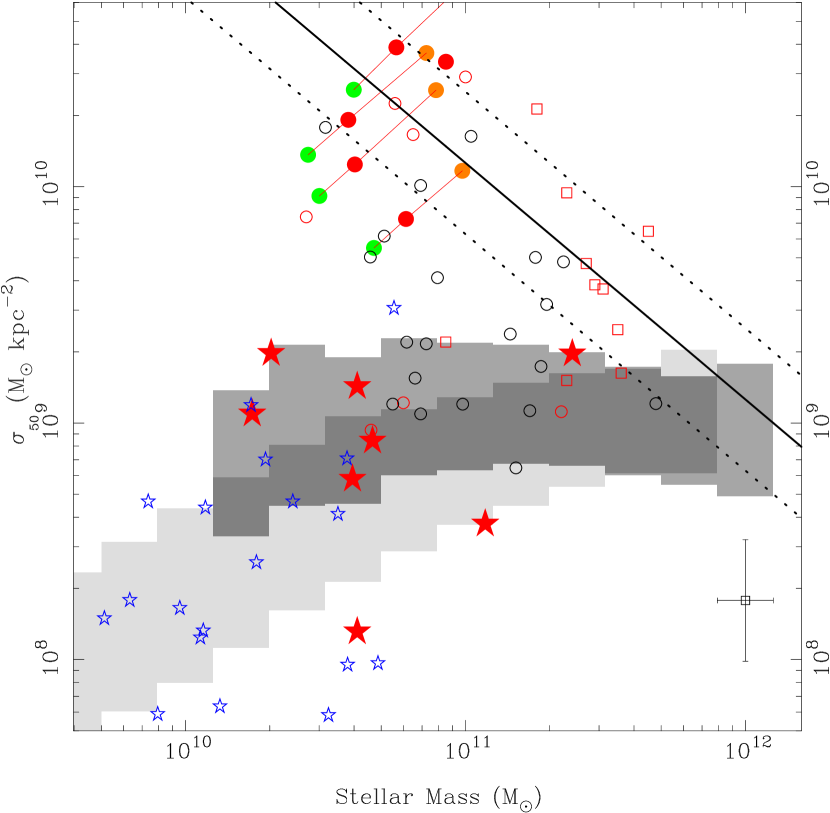
Perhaps most striking is the difference shown in Figure 5 where we plot the average surface stellar mass density within the half-light radius, , versus the stellar mass.
| (1) |
The sDRGs and LBGs overlap the region of the local galaxy samples. The much higher densities of the qDRGs suggest that substantial downward density evolution must take place between and the present-day. However, it is nearly impossible to lower the density of a stellar distribution via secular evolution on this timescale. The relaxation time for these compact DRGs is still much longer than the Hubble time, despite their high densities. Dissipationless, or ‘dry’, merging (e.g., van Dokkum, 2005) would predict a linear decrease in the surface density with accumulated mass (e.g., Nipoti, Londrillo, & Ciotti, 2003). The diagonal lines in Fig. 5 show this power-law trend with a fiducial normalization to the qDRGs. These lines also happen to pass through some of the galaxies which are also “overdense” compared to local early-types. These sources are clearly ellipticals (i.e., they lie on the Fundamental Plane and follow -law profiles) and these are their stellar masses from comparable SED fitting, also using a Salpeter IMF (van der Wel et al., 2005; van der Wel et al., 2006).
Alternatively, the qDRGs may be something of a mixed population; both in the sense that the color and SED selection collects multiple galaxy types and that measurements may lead to misclassification of some sources. Errors in the photometric redshift determination and SED modeling may still allow significant uncertainty in the “compact, evolved stellar population” interpretation (see Table 1 for the photo- errors). Of the five qDRGs only one has a spectroscopic redshift, object 66, and this source harbors an active nucleus. Also plotted in Fig. 5 are the offsets in mass and density due to the photometric redshift errors. The 1 errors from the phot- fits are used to estimate the corresponding errors on the stellar mass and density. The filled green circles are the low redshift estimates and the filled orange circles are the high redshift estimate. These errors do not account for a change in the preferred SED template (and therefore a change in the assumed mass-to-light ratio) due to the change in redshift. Using different stellar population synthesis models to fit the SEDs result in significant differences in the derived properties. In particular, the Maraston (2005) models derive younger ages and consequently smaller, more conservative, stellar masses for the qDRGs on average and we use these in Figures 3, 4 and 5. This offset is reflected by the dotted lines in of Fig. 5. A similar offset would result by allowing for dust in the quiescent SED models. Overestimation of the galaxy masses could also be due to a different stellar IMF. We note, for example, that Baugh et al. (2005) required a top-heavy IMF to model the sub-mm source counts correctly. Regardless of this particular result’s merit, it is certainly clear that a non-constant IMF renders the mass estimates very uncertain. Direct mass estimates are therefore extremely important (but remain very difficult with current facilities). It should also be noted that the optical-NIR colors of the qDRGs exclude the possibility that they are stars (Franx et al., 2003).
6. Discussion and Conclusions
We have presented high spatial-resolution rest-frame optical imaging data for NIR-selected Distant Red Galaxies in the HDF-S. The combination of these data with our modeling of their broad-band optical-infrared SEDs has highlighted the ‘quiescent’ population,the qDRGs, as being particularly dense, massive stellar cores at high-redshift. The evolution of the qDRGs into their counterparts at low redshift is problematic. Their relatively high stellar masses, the strong clustering (Daddi et al., 2003; Quadri et al., 2006) of the DRGs as a population and the small sizes of the qDRGs in particular suggest that qDRGs are destined to become massive concentrated galaxies at lower redshift, i.e., ellipticals. However, their surface stellar mass densities are more than an order of magnitude higher than local ellipticals. Mergers which involve substantial gas dissipation may increase the mass density of the remnant (Robertson et al., 2006), while dissipationless, or ‘dry’, merging increases the size of the galaxies sufficiently to lower their densities (e.g., Nipoti, Londrillo, & Ciotti, 2003; van Dokkum, 2005). If the qDRGs were to evolve via dry merging they would only reach local galaxy densities at very high masses (). It is unlikely that the small HDF-S field would contain five progenitors of such rare, giant galaxies. However, simulations do show that the progenitors of giant local galaxies may be spread over an area comparable to the HDF-S at high redshift (e.g., Gao et al., 2004). If these qDRGs were to evolve along the dry merging line, they would require more than 4 equal mass mergers to match the density of the ellipticals. So while it may seem numerically possible that these qDRGs would merge with each other to produce a single giant galaxy, and the uncertain photometric redshifts in this field cannot definitively exclude this possibility, it would imply that the HDF-S is a rather special (rare) field. They may also merge with the more numerous star-forming galaxies as long as the remnant is less dense than the compact DRG. Interestingly, Robertson et al. (2006) find that the role of dissipation decreases as the mass of the merging galaxies increase. More and more of the gas is dynamically heated into the galactic halo and is unable to cool. It is worth noting that despite the possibility of misclassification of the qDRGs as compact, even a single dense stellar core at high-redshift would require a plausible evolutionary scenario to match local galaxy properties.
We also want to know how a dense galaxy may have formed. From the modeling of their SEDs, the qDRGs have inferred luminosity-weighted stellar ages using the Maraston (Bruzual & Charlot) models between 0.3 (0.5) and 2.0 (2.3) Gyr (Wuyts et al. 2006). Mergers which involve substantial gas dissipation seem to result in high mass density of the remnants (Robertson et al., 2006). Such gas-rich mergers are more likely at higher redshift where relatively little of the gaseous content of galaxies has already been used in star-formation (Khochfar & Silk, 2006a, b; Naab, Khochfar, & Burkert, 2006) and the generic merger rate is much higher. Further data on these and similar galaxies at higher redshift will help distinguish the origin of these dense galactic cores.
Near-infrared spectroscopy can confirm the redshifts and help determine whether the light is indeed dominated by stars rather than AGN (Kriek et al., 2006b) and may eventually enable kinematic mass estimates. Initial results from a NICMOS study of a wider field confirms the trend toward small sizes and high densities for the qDRGs quoted here (Toft et al., in preparation). As samples of qDRGs continue to grow, further high spatial-resolution imaging (either from NICMOS/WFC3 or from adaptive-optics systems on the ground) will be able to discover whether this trend toward small sizes observed in the HDF-S persists over larger volumes and lower galaxy masses and determine the extent to which AGN contribute to the phenomenon.
References
- Baugh et al. (2005) Baugh, C. M., Lacey, C. G., Frenk, C. S., Granato, G. L., Silva, L., Bressan, A., Benson, A. J., & Cole, S. 2005, MNRAS, 356, 1191
- Brinchmann et al. (2004) Brinchmann, J., Charlot, S., White, S. D. M., Tremonti, C., Kauffmann, G., Heckman, T., & Brinkmann, J. 2004, MNRAS, 351, 1151
- Casertano et al. (2000) Casertano, S., et al. 2000, AJ, 120, 2747
- Chapman et al. (2003) Chapman, S. C., Windhorst, R., Odewahn, S., Yan, H., & Conselice, C. 2003, ApJ, 599, 92
- Cimatti et al. (2002) Cimatti, A., et al. 2002, A&A, 381, L68
- Conselice et al. (2004) Conselice, C. J., et al. 2004, ApJ, 600, L139
- Daddi et al. (2005) Daddi, E., et al. 2005, ApJ, 626, 680
- Daddi et al. (2003) Daddi, E., et al. 2003, ApJ, 588, 50
- Franx (1993) Franx, M. 1993, ApJ, 407, 5
- Franx et al. (2003) Franx, M., et al. 2003, ApJ, 587, L79
- Gao et al. (2004) Gao, L., Loeb, A., Peebles, P. J. E., White, S. D. M., & Jenkins, A. 2004, ApJ, 614, 17
- Giavalisco et al. (1996) Giavalisco, M., Steidel, C. C., & Macchetto, F. D. 1996, ApJ, 470, 189
- Huynh et al. (2005) Huynh, M. T., Jackson, C. A., Norris, R. P., & Prandoni, I. 2005, AJ, 130, 1373
- Kauffmann et al. (2003) Kauffmann, G., et al. 2003, MNRAS, 341, 54
- Khochfar & Silk (2006b) Khochfar, S. & Silk, J. 2006b, ApJ, 648, 21
- Khochfar & Silk (2006a) Khochfar, S. & Silk, J. 2006a, MNRAS, 370, 902
- Kriek et al. (2006a) Kriek, M., et al. 2006a, ApJ, 645, 44
- Kriek et al. (2006b) Kriek, M., et al. 2006b, ApJ, 649, L71
- Krist (1993) Krist, J. 1993, in ASP Conf. Ser. 52: Astronomical Data Analysis Software and Systems II 536
- Labbé et al. (2005) Labbé, I., et al. 2005, ApJ, 624, L81
- Labbé et al. (2003) Labbé, I., et al. 2003, ApJ, 591, L95
- Madau et al. (1996) Madau, P., Ferguson, H. C., Dickinson, M. E., Giavalisco, M., Steidel, C. C., & Fruchter, A. 1996, MNRAS, 283, 1388
- Maraston (2005) Maraston, C. 2005, MNRAS, 362, 799
- Maraston et al. (2006) Maraston, C., Daddi, E., Renzini, A., Cimatti, A., Dickinson, M., Papovich, C., Pasquali, A., & Pirzkal, N. 2006, ArXiv Astrophysics e-prints, arXiv:astro-ph/0604530
- McIntosh et al. (2005) McIntosh, D. H., et al. 2005, ApJ, 632, 191
- Naab et al. (2006) Naab, T., Khochfar, S., & Burkert, A. 2006, ApJ, 636, 81
- Nipoti et al. (2003) Nipoti, C., Londrillo, P., & Ciotti, L. 2003, MNRAS, 342, 501
- Papovich et al. (2005) Papovich, C., Dickinson, M., Giavalisco, M., Conselice, C. J., & Ferguson, H. C. 2005, ApJ, 631, 101
- Peng et al. (2002) Peng, C. Y., Ho, L. C., Impey, C. D., & Rix, H.-W. 2002, AJ, 124, 266
- Quadri et al. (2006) Quadri, R., et al.astro-ph/0606330,
- Rix et al. (2004) Rix, H.-W., et al. 2004, ApJS, 152, 163
- Robertson et al. (2006) Robertson, B., Cox, T. J., Hernquist, L., Franx, M., Hopkins, P. F., Martini, P., & Springel, V. 2006, ApJ, 641, 21
- Rudnick et al. (2001) Rudnick, G., et al. 2001, AJ, 122, 2205
- Rudnick et al. (2003) Rudnick, G., et al. 2003, ApJ, 599, 847
- Rudnick et al. (2006) Rudnick, G., et al. 2006, ArXiv Astrophysics e-prints, arXiv:astro-ph/0606536
- Sersic (1968) Sersic, J. L. 1968, Atlas de galaxias australes Cordoba, Argentina: Observatorio Astronomico, 1968
- Shen et al. (2003) Shen, S., Mo, H. J., White, S. D. M., Blanton, M. R., Kauffmann, G., Voges, W., Brinkmann, J., & Csabai, I. 2003, MNRAS, 343, 978
- Trujillo et al. (2004) Trujillo, I., et al. 2004, ApJ, 604, 521
- Trujillo et al. (2006a) Trujillo, I., et al. 2006a, ApJ, 650, 18
- Trujillo et al. (2006b) Trujillo, I., et al. 2006b, MNRAS, L102
- van der Wel et al. (2005) van der Wel, A., Franx, M., van Dokkum, P. G., Rix, H.-W., Illingworth, G. D., & Rosati, P. 2005, ApJ, 631, 145
- van der Wel et al. (2006) van der Wel, A., Franx, M., Wuyts, S., van Dokkum, P. G., Huang, J., Rix, H.-W., & Illingworth, G. D. 2006, ArXiv Astrophysics e-prints, arXiv:astro-ph/0607649
- van Dokkum (2005) van Dokkum, P. G. 2005, AJ, 130, 2647
- van Dokkum & Franx (1996) van Dokkum, P. G. & Franx, M. 1996, MNRAS, 281, 985
- van Dokkum et al. (2004) van Dokkum, P. G., et al. 2004, ApJ, 611, 703
- Williams et al. (2000) Williams, R. E., et al. 2000, AJ, 120, 2735
- Wuyts et al. (2006) Wuyts, S., et al. 2006, ArXiv Astrophysics e-prints, arXiv:astro-ph/0609548
- Zirm et al. (2003) Zirm, A. W., Dickinson, M., & Dey, A. 2003, ApJ, 585, 90
| ID | aaPhotometric redshifts as derived in Rudnick et al. 2001, 2003 | SED TypebbSED Type derived from Maraston (2005) population synthesis models in Wuyts et al. (2006, in press) | Stellar Mass | ccAverage stellar surface mass density within the effective radius | |||
|---|---|---|---|---|---|---|---|
| (AB) | (arcsec) | (kpc) | ( ) | ( kpc-2) | |||
| 336 | quiescent | 3.6 | 0.06 | 0.48 | eeErrors on the masses of the qDRGs due to the errors on the photometric redshifts | 3.88 | |
| 810 | quiescent | 3.9 | 0.07 | 0.56 | eeErrors on the masses of the qDRGs due to the errors on the photometric redshifts | 1.92 | |
| 66 | 3.4ddThis object, 66, has a spectroscopic redshift | quiescent | 2.8 | 0.08 | 0.63 | 0.9 | 3.36 |
| 161 | quiescent | 3.8 | 0.09 | 0.72 | eeErrors on the masses of the qDRGs due to the errors on the photometric redshifts | 1.25 | |
| 767 | quiescent | 4.5 | 0.14 | 1.16 | eeErrors on the masses of the qDRGs due to the errors on the photometric redshifts | 0.73 | |
| 447 | star-forming | 1.7 | 0.18 | 1.28 | 0.2 | 0.20 | |
| 295 | star-forming | 2.4 | 0.19 | 1.59 | 0.2 | 0.11 | |
| 500 | star-forming | 2.9 | 0.25 | 2.12 | 0.3 | 0.09 | |
| 327 | star-forming | 1.6 | 0.28 | 2.14 | ffObject 327 is confused in the -band data and is therefore excluded from the stellar mass analysis | ffObject 327 is confused in the -band data and is therefore excluded from the stellar mass analysis | |
| 496 | star-forming | 3.2 | 0.35 | 2.97 | 0.5 | 0.08 | |
| 397 | star-forming | 2.3 | 0.42 | 3.29 | 0.4 | 0.06 | |
| 656 | star-forming | 4.4 | 0.55 | 4.42 | 2.4 | 0.20 | |
| 176 | star-forming | 2.2 | 0.86 | 7.06 | 0.4 | 0.01 | |
| 611 | star-forming | 2.4 | 0.89 | 7.07 | 1.2 | 0.04 |