G332.5–5.6, a new Galactic supernova remnant
Abstract
We present radio observations of the source G332.5–5.6, a candidate supernova remnant (SNR). Observations have been performed with the Australia Telescope Compact Array (ATCA) at two frequencies, at 1.4 and 2.4 GHz. Our results confirm that G332.5–5.6 is an SNR, with a spectral index for the whole source and an average fractional polarization of at 2.4 GHz. The central component is coincident with extended X-ray emission and the distance to the SNR is estimated to be kpc. Based on its radio and X-ray morphology, this SNR should be classified as a composite, and we suggest that it belongs to a trident-shaped subclass like G291.0–0.1.
keywords:
ISM: supernova remnants — ISM: individual objects: G332.5–5.6 — radio continuum — polarization1 Introduction
Supernova explosions are one of the most important sources which control the physical and chemical state of the interstellar medium (ISM). They inject heavy elements into the ISM, accelerate cosmic rays, heat and compress nearby clouds altering the local chemistry and eventually inducing star formation. At present, 265 supernova remnants (SNRs) are identified in our Galaxy (Green, 2006), including those recently reported by Brogan et al. (2006). Of this sample, there are 15 with , but their distribution is assymetrical: only 4 of them are in the Southern hemisphere, while the rest are north of declination (Green, 2004). Although this asymmetry is thought to be related to Gould’s belt (e.g. Stothers & Frogel, 1974), there is no evidence of the same asymmetry in low Galactic latitude SNRs, which should not be statistically different (Green, 2004).
Duncan et al. (1997) identified several SNR candidates at high Galactic latitude based principally on morphology at 4.85 GHz (Wright et al., 1994) and the absence of 60-m far-infrared emission, which is a strong discriminant against thermal sources. One of the most intriguing candidates found was G332.5–5.6, a region with three patches of filamentary emission and a total size of about , that does not appear at all like a canonical SNR (a filamentary shell or a centrally-peaked source). The unusual appearance of this source meant a more comprehensive study would be needed, with spectral index and polarization measurements, to confirm the identification. The source has also been observed at 843 MHz as part of the the Sydney University Molonglo Sky Survey (SUMSS; Bock, Large & Sadler, 1999).
In this paper we present high resolution observations of G332.5–5.6 carried out with the Australia Telescope Compact Array (ATCA) at two frequencies, 1384 MHz and 2432 MHz, including full Stokes parameters at the higher frequency.
2 Observations and data reduction
We observed G332.5–5.6 in three sessions with the ATCA. The first run was on January 11 2003 over 12 hours, with the array in the 1.5B configuration (baselines varying from 30.6 to 1286 m), using the correlator configuration of two 128 MHz bands (over 32 channels) centered at 1384 MHz and 1704 MHz. Because of the large angular size of the source, observations were made in mosaicing mode with three pointings to completely cover the extended radio emission. To optimize the sampling according to the Nyquist theorem, the pointings were separated by .
The remaining two sessions were conducted on April 12 and 23 2003, for 5 hours each day, with the ATCA in the EW 352 configuration (baselines from 30.6 to 352 m). The two continuum bands were centered this time on 1384 MHz and 2496 MHz in the first session, and 1384 MHz and 2368 MHz in the second session, to avoid likely interference. The largest angular scales sampled by these datasets are and at 20 cm and 13 cm respectively. The primary beam is smaller at 13 cm, so the observed mosaic consisted of 4 pointings separated by from one another. Unfortunately, both these runs were substantially overlapped in hour angle, so the resulting synthesized beam is rather elongated. The source PKS 1657–56 was used to calibrate phase, while PKS 1934–638 was used for flux density and bandpass calibration. The data were processed with the MIRIAD software package (Sault, Teuben & Wright, 1995). To construct the image at 20 cm, all pointings at 1384 MHz and 1704 MHz were merged together in the plane. The image was constructed with a cell size of and uniform weighting which minimizes the sidelobe levels. A gaussian taper was applied to the visibility data by setting the fwhm parameter equal to 24 arcsec in the MIRIAD task INVERT.
To deconvolve a dirty mosaic image, two MIRIAD routines can be used: MOSMEM and MOSSDI. According to the MIRIAD User’s Guide 111http://www.atnf.csiro.au/computing/software/miriad/userhtml.html, the former is generally superior, except for images containing point sources. Therefore, the deconvolution was performed in two steps: firstly, point sources were cleaned using MOSSDI, and then MOSMEM was used for the residual image. The synthesised beam was , with a position angle (measured clockwise from north) of . However, to improve the signal to noise ratio, the image was smoothed to a beam.
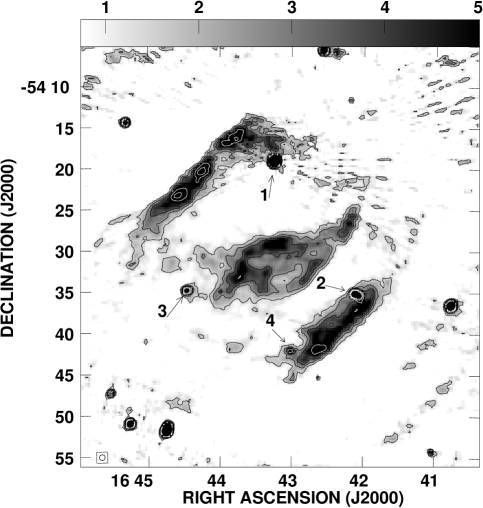
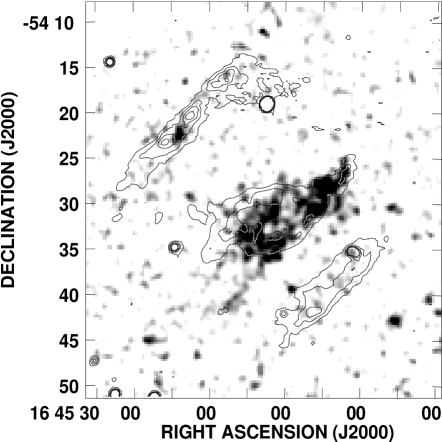
Due to the strong artifacts introduced by the bright compact source PMN J1643–5418, close to the western edge of the N-E filament of G332.5–5.6, a second image was obtained repeating the above process but excluding the 1704 MHz data. Although the artifacts did not vanish completely, the final image was noticeably improved. The rms noise level is mJy beam-1 and this image is shown in Figure 1.
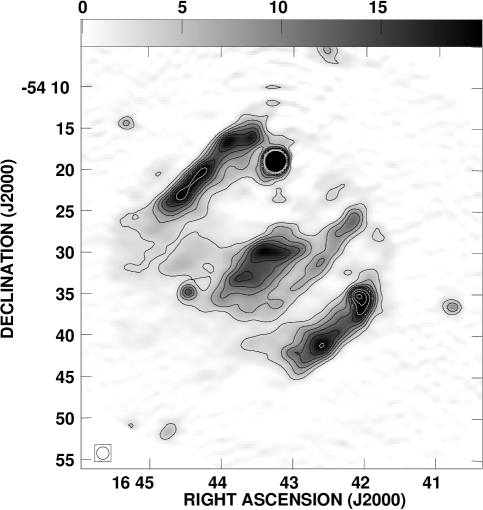
To construct the image at 13 cm, a similar procedure was used. The observations were made with a more compact configuration of the ATCA, so have a lower resolution when compared with the 20 cm images, and a larger cell size () was used. As before, point sources were cleaned first and the extended emission was deconvolved using the residual image. The clean components model was convolved with a beam of . The rms noise of the final image, shown in Figure 2, is 0.5 mJy beam-1.
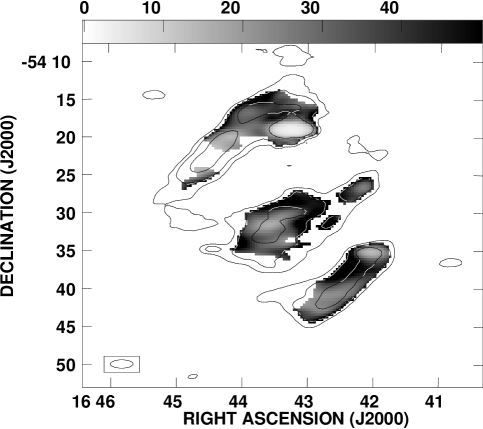
The ATCA provides simultaneous recording of all four Stokes parameters when observing in continuum mode. We made images of the and Stokes parameters at 13 cm following the procedure described above. Natural weighting was used in this case and no tapering was applied to the data. Both images were restored with a beam, and P.A. =. A linear polarization image was formed by combining the and images using . A total intensity image was also constructed with the same beam shape, and the fractional polarization was obtained by dividing by the total intensity image. Finally, the fractional polarized emission was blanked for those pixels where the total intensity fell below 8 mJy beam-1 (equivalent to ) or where was less than 3 mJy beam-1 (). In Figure 3, the fractional polarization is shown in greyscale with total intensity contours overlaid. The signal-to-noise ratio in Fig. 3 varies between 5 and 20.
3 Results
Figures 1 and 2 display the mosaic images of G332.5–5.6 at 20 cm and 13 cm respectively. At 20 cm, G332.5–5.6 shows two outer ridges of emission, very straight and almost parallel, with a more extended central emission region elongated in the same direction as the two ridges. The whole structure has a trapezoidal shape, with the N-E and S-W outer filaments being and long respectively, and the distance between them being . Both external filaments have a width of .
The broader, central component appears to be detached from the outer S-W filament but could be connected with the N-E one. This central component shows internal substructure, with a chain of knots forming an incomplete, elongated ring with a filament extending to the N-W. The filament coincides with an optical filament with characteristics typical of SNRs (Parker, Frew & Stupar, 2004). There are also several compact sources within the area subtended by the SNR that are probably unrelated sources (see section 3.2). These sources are marked with arrows in Fig. 1.
The 13 cm image is very similar to the 20 cm one, although, because of its lower resolution the central ring and Source 4 are rather blurred.
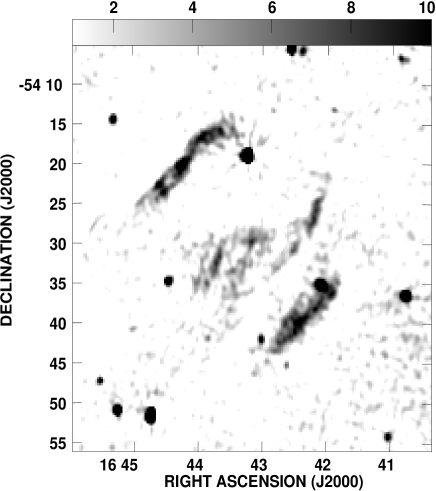
For comparison, in Figure 4 we show an image of G332.5–5.6 obtained from the Sydney University Molonglo Sky Survey (SUMSS; Bock, Large & Sadler, 1999) at 843 MHz. The morphology of the three filaments is very similar to the images at 13 and 20 cm. Most of the small-scale structure observed in the 20 cm image is also found in the SUMSS image, including the central component, although some of the smooth emission has been resolved out. Moreover, at 843 MHz the two outer filaments appear relatively brighter and narrower than the central component.
3.1 Polarization
The average fractional polarization of G332.5–5.6 at 13 cm is %. There is little variation over the face of the SNR. The polarization level is rather high but Dickel, Milne & Strom (2000) also found high percentages of polarization in G326.3–1.8 using the ATCA, and they discuss how the polarization might be artificially increased in aperture synthesis observations. This occurs because the polarized intensity probably has more fine structure than the total intensity and the absence of short spacings resolves out some of the total intensity emission. The compact source PMN J1643–5418 was found to be unpolarized.
3.2 Spectral index study

To obtain the spectral index of G332.5–5.6, we used a standard flux-flux plotting technique (Costain 1960; Turtle et al. 1962). This method compares the point by point flux densities of two images at different frequencies which have been constructed from datasets with the same range. The slope of a linear regression is then used to compute the spectral index, independently of possible differences in the zero level of each image.
The resolution limit of the filtered maps is determined by the 13 cm observations. The visibilities of the two datasets overlap between 0.3 and 1.47 k. Using only data within this range, two images were constructed following the same procedure as described in Section 2. The resulting beam was , with a position angle of .
Flux-flux plots were constructed for the three filaments separately. In all cases, the point sources were excluded except for source number 4 in Table 1, which was not resolved in the filtered maps. However, since this is a faint source, the result is not expected to be markedly different. In fact, the S-W filament shows the best correlation. For the other two components, the correlation was poor (just above 0.8). The flux-flux plots are shown in Figure 5. For correlations very close to one, the slope of the linear fit is independent of which of the two frequencies is taken to be the abscissa. In general, this is not true. Therefore it is necessary to compute two different slopes with each frequency being alternately the abscissa. The spectral indices obtained using the average of both slopes are for the N-E filament, for the central one, and for the S-W filament, where the errors enclose the values obtained for the two different slopes. The poorest correlation is found for the central filament. The departures from a straight line may indicate that regions with different spectral indices, and hence electron populations with different acceleration mechanisms, are coexisting. The regions used in the flux density calculations were varied for a range of cutoff levels, to establish a measure of the uncertainty in the estimates. Higher resolution observations may help to undercover local differences in the spectral index distribution.
| Flux density | ||||
|---|---|---|---|---|
| R.A. (J2000) | Decl. (J2000) | Spectral | at 20 cm | |
| h,m,s | ∘ ′ ′′ | index | (mJy) | |
| 1 | 16 43 14.6 | –54 19 07 | ||
| 2 | 16 42 06.4 | –54 35 15 | ||
| 3 | 16 44 27.7 | –54 34 53 | ||
| 4 | 16 43 01.2 | –54 42 08 |
Note: Numbers correspond to Fig. 1. Source number 1 is catalogued as PMN 1643–5418.
To study the compact sources with a better resolution than that provided by the filtered images at 13 and 20 cm, we applied the flux-flux method combining the MOST survey image at 843 MHz and our original 20 cm image, convolved to the resolution of the Molonglo telescope (). This comparison is only valid for compact sources, since the Molonglo telesope filters out smooth extended structures that may be detected with the ATCA. In Table 1 we show the spectral indices computed using the higher resolution data. From the steep negative indices measured, it is likely that all four sources are extragalactic.
We have also measured the integrated flux density of the three filaments at 13 and 20 cm. The results are listed in columns 2 and 3 of Table 2. To estimate the integrated flux density from the remnant, including those regions where there are unrelated sources superimposed (e.g. in the S-W filament), the integrated flux densities of these sources were computed and subtracted. Spectral indices computed by direct application of the relation using these integrated flux densities are listed in column 4. These indices are in good agreement with those obtained with the flux-flux method (last column in Table 2). The total flux density of G332.5–5.6 is estimated to be Jy at 20 cm, and Jy at 13 cm. Combining these total flux densities, the global spectral index for the source is estimated to be .
3.3 The distance to G332.5–5.6
To analyze the nature of the SNR, it is crucial to know its distance. A very powerful tool to constrain distances to radio sources is to analyze the H i 21 cm line in absorption against the continuum emission. To construct an absorption profile towards G332.5–5.6, we made use of H i observations from the Southern Galactic Plane Survey (SGPS; McClure–Griffiths et al., 2005). The SGPS combines observations from the ATCA and the 64 m Parkes telescope. At the high Galactic latitude of this object, where only Parkes data are available, the observations have a resolution of and a sensitivity of mK.
The radio continuum image at 20 cm was convolved to the same beam as the H i data. This image was used as a template to compute two H i data cubes: one with all pixels blanked except where the continuum emission was above 0.5 Jy beam-1, and the other blanking only the pixels inside the same region. The first cube was used to obtain the on-source profile, while the off-source profile was produced from the average H i emission in the surroundings of the blanked region in the second cube. The absorption profile, shown in Figure 6, is the difference between the two profiles. This assumes that the emission profile is not varying significantly over the region of the SNR.
| Flux density | Flux density | |||
|---|---|---|---|---|
| at 1384 MHz | at 2432 MHz | Spectral | Spectral | |
| Filament | (Jy) | (Jy) | index | index |
| N-E | ||||
| Central | ||||
| S-W |
a
b Flux-flux method.
The optimal procedure with single dish data is to obtain the on-source profile from a pointing towards the peak of the continuum source, while the off-source profile is usually obtained from an average of pointings surrounding the source. Since we are using a published archive, pointings are not expected to be optimal. However, since G332.5–5.6 is about twice as large as the Parkes beam, it is likely that the profiles used are substantially independent. In spite of some drifts in the zero level due to uncertainties in the method, three absorption features can be reliably identified. Two of them, near 0 km s-1, are related to local gas, and the broader one includes a secondary minimum at about km s-1 corresponding to the Sagittarius arm (Georgelin & Georgelin, 1976, with R kpc). The emission excess at 0 km s-1 can be explained as background H i from the far side of the Scutum-Crux arm. The third absorption feature is centred at approximately km s-1, with a FWHM of 7 km s-1, and represents the near side of the Scutum-Crux arm. Adopting a lower limit of km s-1 for the systemic velocity of the SNR (allowing for the width of the –45 km s-1 feature), the Galactic rotation model of Fich, Blitz & Stark (1989) produces distances of 3.4 and 12 kpc. The emission excess at the tangent point, near km s-1, resolves the ambiguity in favor of the closer distance. The remnant would also be extraordinarily large ( pc) and unreasonably high above the Plane ( kpc) at the far distance.

To confirm our absorption result, it would be useful to observe this source with the ATCA in the H i 21 cm line, since interferometers filter extended emission and thus the absorption profile is directly observed. In addition, the high angular resolution that can be achieved with the ATCA will distinguish between absorption from G332.5–5.6 and that produced by the brighter compact source PMN J1643–5418. At present, such a detailed study is not possible.
4 Discussion
4.1 Comparison with X-rays data
We have searched for an X-ray counterpart of G332.5–5.6 in the ROSAT PSPC catalogue. These data have a nominal resolution of . To improve the sensitivity, we have smoothed the image with a Gaussian. In Figure 7 we show the X-ray emission in the direction of the SNR with radio contours at 20 cm overlaid.
There is strong X-ray emission coming from the center of the remnant, while no significant X-ray emission is found at the outer filaments except for a small source in the northern filament, in the center of two radio peaks. This source is catalogued as J164422.2–542221 in the Second ROSAT PSPC Catalog. However, the association between this X-ray source and the SNR is uncertain.
The central component and the X-ray emission are morphologically very similar. There is a weak finger in X-rays extending approximately to the SE beyond the radio outermost contour.
The PSPC image covers the frequency range from 0.1 to 2.4 keV. From the ROSAT All Sky Survey (RASS3) images, it is clear that most of the X-ray emission arises in the frequency range from 0.5 to 2.4 keV, while the emission between 0.1 and 0.5 keV is negligible.
The central component does not have a flat spectral index, compared with the two outer filaments, which would be characteristic of recent energy injection. Hence, our result does not support a model where the central X-ray emission is associated with a nebula driven by the winds of a central pulsar, a “pulsar wind nebula” (PWN), which is characterized by flat spectra (e.g. Giacani et al., 2001)
However, as noted in section 3.2, the poor correlation between the emission at 13 and 20 cm for the central component may imply that different electron populations on smaller scales are coexisting, and thus a PWN cannot be definitely ruled out. To investigate this possibility, we searched the ATNF Pulsar Catalogue (Manchester et al., 2005)222http://www.atnf.csiro.au/research/pulsar/psrcat. No pulsars were found in the vicinity of G332.5–5.6. Hence, we believe that the central X-ray emission is produced by an alternative mechanism, such as cloud evaporation in the hot SNR interior (White & Long, 1991) or by thermal conduction, when the shell becomes radiative and only the hot interior persists in X-ray (e.g. Harrus et al., 1997). An improved ROSAT X-rays image which may help to discriminate between the different scenarios is presented by Stupar et al. (2006). Additionally, since the Parkes Multibeam Pulsar Survey only extends to , a search for a pulsar towards G332.5–5.6 should be pursued.
4.2 The nature of G332.5–5.6
The morphology of G332.5–5.6 and its linear size of pc, estimated for a distance of 3.4 kpc, indicates a more evolved SNR. The source resembles bilateral SNRs, like G350.0–02.0 and VRO 42.05.01. This class of SNRs is characterised by a clear axis of symmetry with two bright limbs and occasionally low levels of emission along the axis (Gaensler, 1998). Several explanations have been proposed to account for such morphology (e.g. Bisnovatyi-Kogan & Silich, 1995). The most plausible appears to be that these remnants are expanding into elongated cavities in the interstellar medium, which may have been created by the ambient magnetic field (Gaensler, 1998).
In general, the symmetry axes of bilateral SNRs are oriented nearly parallel to the Galactic plane. The axis of G332.5–5.6, on the contrary, is almost perpendicular to this direction. The same “anomalous” orientation is seen in the two bilateral SNRs: G296.5+10.0 and G327.6+14.6 (SN 1006). These two remnants are also exceptional in their height above the Galactic plane. Using the distance estimated by Giacani et al. (2000) based on H i observations, G296.5+10.0 lies pc above the Galactic disk, while SN 1006 has a height of pc based on the distance derived by Winkler, Gupta & Long (2003) combining proper motions of optical filaments and radial velocities.
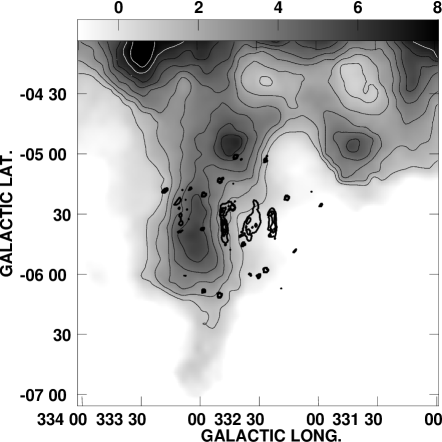
At a distance of 3.4 kpc, G332.5–5.6 would be located at a height of 330 pc above the Plane. Gaensler (1998) explains the orientation in these cases as due to perpendicular structures such as chimneys and “worms”, which occur frequently at high Galactic latitudes (e.g. Heiles, 1984). The H i distribution between about and –50 km s-1, which encompasses the systemic velocity of the remnant, shows a protrusion of enhanced density that extends from the Galactic plane to the halo. The N-E filament of the SNR appears roughly aligned, near this protrusion. Figure 8 shows the average H i emission within 10 km s-1 around km s-1, where the density enhancement is well defined. It is not clear whether the match between the N-E filament and the H i emission is due to absorption effects or to a physical interaction between the SNR shock front and the ISM. There is no evidence of an association between the S-W filament and the H i gas.
In fact, rather than a bilateral SNR, G332.5–5.6 resembles a trident like G291.0–0.1 (Whiteoak & Green, 1996). Both SNRs are composed of three roughly parallel ridges, perpendicular to the Galactic disk, and both have a bright X-ray core coincident with the central radio component. For G291.0–0.1 this central region is a PWN (Harrus et al., 1998) and there is also a circular region of fainter emission. However, for G332.5–5.6, which has a larger angular size, there is no indication of extended underlying emission although a smooth component could have been filtered out because interferometry was used for the observations. Single dish measurements will be needed to address this question. Another difference between these two SNRs is that for G291.0–0.1, the central component is more intense and extended than the outer filaments, while for G332.5–5.6 all three components are roughly equal in size and intensity.
Although the outer filaments may be part of a shell structure, Roger et al. (1986) propose that all the components of G291.0–0.1 are subsidiary peaks of a filled-centre SNR. Nevertheless, we believe despite the differences described, the morphological radio and X-rays coincidences between these remnants are so striking that they may well be members of a new, trident-shaped, subclass of composite SNRs.
5 Conclusions
We have observed the radio source G332.5–5.6 with the ATCA at two radio continuum frequencies, 1384 MHz and 2432 MHz. Our observations confirm that this source is a SNR. On average, the emission from the source is about 35% polarized. Using these two frequencies, the global spectral index for the SNR was found to be . All of the three main components of the SNR have essentially the same spectral characteristics. However, the departures from a linear correlation in the flux-flux plots for the central filament indicate that probably more than one population of electrons is present. Therefore, the existence of a pulsar wind driven nebula cannot be ruled out at this stage. The central component is coincident with extended X-ray emission. A more detailed spectral study of this X-ray component would be helpful in determining the origin of this emission.
We have used H i archival data to analyze the absorption spectrum towards this source. Based on this spectrum, we found that the distance to the SNR is kpc. At this distance, the height above the Galactic disk is 330 pc.
From its peculiar radio and X-ray morphology, G332.5-5.6 should be classified as a composite SNR, and we suggest that it belongs to a trident-shaped subclass with G291.0–0.1. The orientation of the three components is perpendicular to the Galactic plane, similar to that found for the bilateral SNRs G296.5+10.0 and SN 1006, which also lie well above the Galactic plane (heights pc). This orientation could be related to chimneys and “worms” in the halo. We found an H i feature extending towards the halo at a distance of 3.4 kpc (systemic velocity of km s-1) which appears aligned with the SNR, but the evidence for an association is weak.
Acknowledgements
This project was partially financed by grants ANPCyT-14018, PIP-CONICET 6433 and UBACYT A055 (Argentina). During part of this work, EMR was a visiting scholar at the University of Sydney. The ATCA is part of the Australia Telescope, which is funded by the Commonwealth of Australia for operation as a National Facility managed by CSIRO. The Molonglo Observatory is owned and operated by the University of Sydney. We have made use of the ROSAT Data Archive of the Max-Planck-Institut für extraterrestrische Physik (MPE) at Garching, Germany.
References
- Bisnovatyi-Kogan & Silich (1995) Bisnovatyi-Kogan, G. S., Silich, S. A., 1995, RvMP, 67, 661
- Bock, Large & Sadler (1999) Bock, D. C.-J., Large, M. I., Sadler, E. M., 1999, AJ, 117, 1578
- Brogan et al. (2006) Brogan, C. L., Gelfand, J. D., Gaensler, B. M., Kassim, N. E., Lazio, T. J. W., 2006, ApJL, 639, 25
- Costain (1960) Costain C. H., 1960, MNRAS, 120, 248
- Dickel, Milne & Strom (2000) Dickel, J. R., Milne, D. K., Strom, R. G., 2000, ApJ, 543, 840
- Duncan et al. (1997) Duncan A.R., Stewart R.T., Haynes R.F., Jones K.L., 1997, MNRAS, 287, 722
- Fich, Blitz & Stark (1989) Fich M., Blitz L., Stark A. A., 1989, ApJ, 342, 272
- Gaensler (1998) Gaensler, B. M., 1998, ApJ, 493, 781
- Georgelin & Georgelin (1976) Georgelin Y. M., Georgelin Y. P., 1976, A&A, 49, 57
- Giacani et al. (2000) Giacani, E. B., Dubner, G. M., Green, A. J., Goss, W. M., Gaensler, B. M., 2000, AJ, 119, 281
- Giacani et al. (2001) Giacani, E. B., Frail, D. A., Goss, W. M., Vieytes, M., 2001, AJ, 121, 3133
- Green (2004) Green, D. A., 2004, Bull. Astr. Soc. India, 32, 335
- Green (2006) Green, D. A., 2006, “A Catalogue of Galactic Supernova Remnants (2006 April version)”, Astrophysic Group, Cavendish Laboratory, Cambridge, United Kingdom available at “http://www.mrao.cam.ac.uk/surveys/snrs/”
- Harrus et al. (1997) Harrus, I. M., Hughes, J. P., Singh, K. P., Koyama, K., Asaoka, I., 1997, ApJ, 488, 781
- Harrus et al. (1998) Harrus, I. M., Hughes, J. P., Slane, P. O., 1998, ApJ, 499, 273
- Heiles (1984) Heiles, C., 1984, ApJS, 55, 585
- Manchester et al. (2005) Manchester R. N., Hobbs G. B., Teoh A., Hobbs M., 2005, AJ, 129, 1993
- McClure–Griffiths et al. (2005) McClure–Griffiths N. M., Dickey J. M., Gaensler B. M., Green A. J., Haverkorn M., Strasser S., 2005, ApJS, 158, 178
- Parker, Frew & Stupar (2004) Parker Q.A., Frew D.J., Stupar M., 2004, AAO Newsletter, 104, 9
- Roger et al. (1986) Roger, R. S., Milne, D. K., Caswell, J. L., Little, A. G., 1986, MNRAS, 219, 815
- Sault, Teuben & Wright (1995) Sault R. J., Teuben P. J., Wright M. C. H., 1995, in ASP Conf. Ser. 77, Astronomical Data Analysis Software and Systems IV, ed. R. A. Shaw, H. E. Payne, & J. J. E. Hayes (San Francisco: ASP), 433
- Stothers & Frogel (1974) Stothers, R., Frogel, J. A., 1974, AJ, 79, 456
- Stupar et al. (2006) Stupar, M., et al., 2006, in preparation
- Turtle et al. (1962) Turtle A. J., Pugh J. F., Kenderdine S., Pauliny-Toth I. I. K., 1962, MNRAS, 124, 297
- White & Long (1991) White, R. L., Long, K. S., 1991, ApJ, 373, 543
- Whiteoak & Green (1996) Whiteoak, J. B. Z., Green, A. J., A&ASS, 118, 329
- Winkler, Gupta & Long (2003) Winkler, P. F., Gupta, G., Long, K. S., 2003, ApJ, 585, 324
- Wright et al. (1994) Wright, A. E., Griffith, M. R., Burke, B. F., Ekers, R. D., 1994, ApJS, 91, 111