Hard X-ray emission from the core of the Perseus cluster and the thermal content of the radio bubbles
We use a very deep 900 ks Chandra X-ray observation of the core of the Perseus cluster to measure and confirm the hard X-ray emission detected from a previous analysis. By fitting a model made up of multiple temperature components plus a powerlaw or hot thermal component, we map the spatial distribution of the hard flux. We confirm there is a strong hard excess within the central regions. The total luminosity in the 2-10 keV band inside 3 arcmin radius is erg s-1. As a second project we place limits on the thermal gas content of the X-ray cavities in the cluster core. This is done by fitting a model made up of multiple components to spectra from inside and outside of the bubbles, and looking at the the difference in strength of a component at a particular temperature. This approach avoids assumptions about the geometry of the core of the cluster. Only up to 50 per cent of the volume of the cavities can be filled with thermal gas with a temperature of 50 keV.
1 Introduction
We found evidence for an additional hard emission from the core of the Perseus cluster in a 200 ks Chandra observation sandersper04 ; sandersnontherm05 , which we interpreted as nonthermal X-ray emission due to inverse Compton scattering of cosmic microwave background or infrared seed photons. We now verify the detection of the hard flux and characterise it better with a longer 900 ks Chandra observation fabianper06 .
The first Chandra observations of the cluster also showed that the X-ray cavities likely generated by the lobes the central AGN 3C 84 do not appear to contain thermal volume filling gas below 11 keV schmidtper02 . Analysis of the 200 ks data suggested that further limits were difficult to obtain due to the non-spherical nature of the cluster core preventing deprojection analyses sandersper04 . To limit the thermal content further we here examine the deep 900 ks data without geometric assumptions.
2 Hard X-ray emission
In our previous analysis of a 200 ks observation of the cluster we used a simple thermal plus powerlaw model to search for any hard emission in the centre of the cluster sandersnontherm05 . The thermal component accounts for thermal gas, and the powerlaw accounts for hot thermal or nonthermal components. The disadvantage of this approach is that if there are multiphase components or if projected hot gas is significant, this will lead to a false powerlaw signal. In the previous analysis, we simulated the effect of projected emission, to account for its effects. There is, however, an extremely extended H nebulosity around the central galaxy NGC 1275 minkowskiperfil57 ; lyndsperfil70 , associated with M⊙ of cool X-ray emitting gas fabianper06 . It may therefore be important to include contributions from cool X-ray gas in the spectral modelling, otherwise the X-ray emission at low temperatures may be detected by the powerlaw component.
Radio observations sijbringthesis93 indicate that the radio photon index of the central regions is steep (). If inverse Compton is the emission mechanism and the electron distribution continues without a break to , we would predict X-ray powerlaw emission with a similar steep photon index. Hot thermal gas would give flatter photon indices if fitted with a powerlaw model.
2.1 Analysis
We here examine a 900 ks long Chandra dataset fabianper06 of the core of the Perseus cluster. We used the Contour Binning algorithm sanderscontbin06 to select regions containing a signal to noise ratio greater than 500 in the 0.5 to 7 keV band on the ACIS-S3 CCD. The method takes a smoothed map (here we smoothed the input X-ray image with a top hat kernel with a radius to give a signal to noise ratio greater than 60), and creates bins following the surface brightness. A geometric constraint factor of 2 was used to stop the bins becoming too elongated. The regions contain approximately 250,000 foreground counts.
We extracted spectra from the foreground event files for each observation from each of the spatial regions. We also extracted background spectra from blank sky background files, and additional “background” spectra to correct for out-of-time events (these were generated from the foreground event files where the chipy coordinate of each event on the CCD had been randomised). The foreground spectra were added together, their responses averaged, and their backgrounds combined using our previous prescription fabianper06 . We constructed a model made up of photoelectrically absorbed apec smithapec01 thermal components at 0.5, 1, 2, 3, 4 and 8 keV, accounting for the range of thermal gas observed in the cluster, plus a powerlaw component. The thermal components were all fixed in temperature, with free normalisations. The metallicities of the components were tied together and free in the fit. The absorption was allowed to vary from bin to bin. The powerlaw photon index was frozen at a value of 2, with a free normalisation. The model was fitted to the spectra from each region between 0.6 and 8 keV.
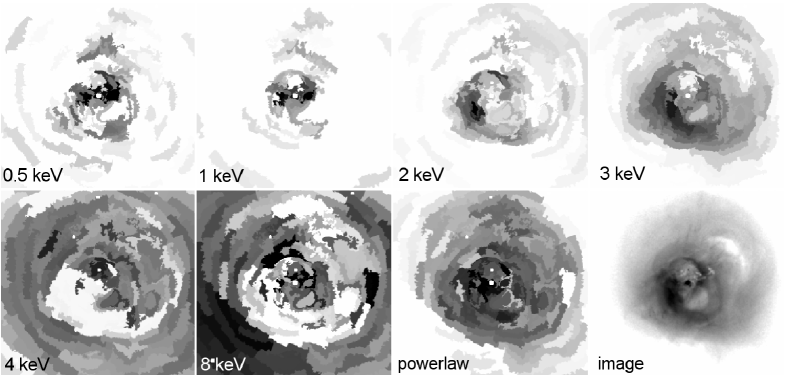
Fig. 1 shows images of the normalisations per unit area in the central region for each of the components. As in our previous analysis sandersnontherm05 , the normalisation of the powerlaw component strongly increases in the central regions, indicating it is not due to a background subtraction problem.
The fits require that the photoelectric absorption in the very centre of the cluster, where the powerlaw is strong, is significantly larger than in the outer regions (an increase of of cm-2). This is because the powerlaw component becomes strong at low X-ray energies releative to the thermal components.
If the powerlaw photon index is allowed to be free, steep powerlaws (if the absorption is free) are preferred over flatter powerlaws. However, we also attempted to fit models with a flatter powerlaw photon index () and using a hot 16 keV plasma to replace the powerlaw component. These fits do not appear to require any excess absorption if it is free in the fit. We show profiles of the flux in the 2-10 keV band for the three different models in Fig. 2. The plot shows that the models give very similar fluxes for the central regions of the cluster, indicating the hard flux measurement is fairly model independent. We also plot a radial profile measured from the earlier 200 ks observation, using the simple thermal plus powerlaw model with variable photon index, but subtracting the modelled contribution from projected gas. The new results match the old results well.
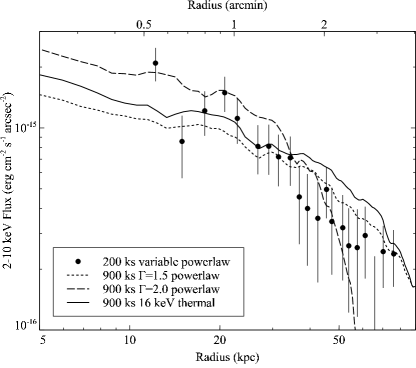
In the 2-10 keV band, we calculate deabsorbed total fluxes in the inner 3 arcmin of erg cm-2 s-1 for the model, and erg cm-2 s-1 for the 16 keV thermal model. These fluxes correspond to a 2-10 keV luminosity of erg s-1 if km s-1 kpc-1. This is larger than the luminosity of the central nucleus in this band churazovper03 .
2.2 Conclusions
We confirm a hard thermal component centred on the core of the Perseus cluster using a multicomponent spectral model. Its 2-10 keV luminosity is of the order of erg s-1. If the hard flux is nonthermal in origin with a steep photon index similar to the radio emission, then additional photoelectric absorption is required in the centre of the cluster. Flatter nonthermal or hot thermal models require no additional absorption. In future work we will explore the different emission mechanisms and their consequences, and examine other data to limit the possible models.
3 Limiting hot thermal bubble contents
To limit the presence of hot thermal gas in the X-ray cavities in the cluster, we fitted a multicomponent model to spectra extracted from regions in the holes and other regions at the same radius. We compared the normalisation of a component of gas a particular temperature between the two regions. This differential method avoids geometric assumptions, only assuming that the cluster is similar at similar radii. The model consisted of fixed apec components at 0.5, 1, 2, 3, 4 and 5 keV, a powerlaw fixed to and free absorption. These components were designed to model the emission from the cluster plus the hard component above. We also included an additional component to represent any hot thermal emission in the bubbles. This component representing the hot gas was stepped in temperature between 6 and 60 keV. We compared the normalisation per unit area (for a particular bubble temperature) with another regions at the same radii, and computed a limit on the difference in normalisation between the two for each temperature.
The normalisation difference can be converted to a limit on the volume filling fraction simply. We assume a geometry for the regions extracted from the bubbles to calculate a volume. The regions on the sky are 0.12 arcmin in radius, and we assume a cylinder depth 0.42 and 0.6 arcmin for the inner SW and ghost NW bubble, respectively. Using the volume and the difference in normalisation we can estimate an upper limit for the density if the thermal gas is volume filling. This is multiplied by the temperature currently examined to calculate a volume filling electron pressure upper limit. We took the ratio of this pressure to the thermal electron pressure of the gas surrounding the X-ray holes from existing deprojected electron pressure maps sandersper04 to calculate the upper limit on the volume filling fraction.
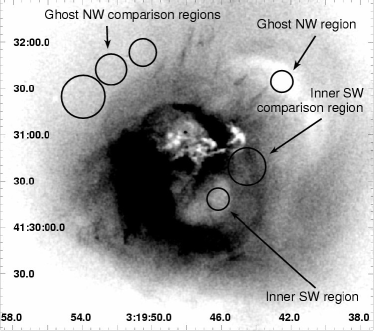
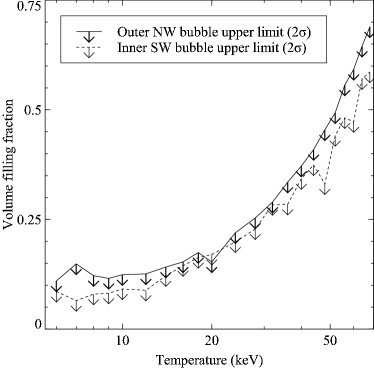
Fig. 3 shows the resulting upper limits as a function of temperature for the inner SW radio bubble and outer NW ghost cavity. Note that the limits are not independent. At most half of the volume of the bubbles is filled with thermal gas with temperatures less than 50 keV.
3.1 Conclusions
We place limits for thermal content of two of the X-ray holes in the core of the Perseus cluster. By fitting multitemperature models to regions within the holes and nearby, and comparing the results, we deduce that at most 50 per cent of the volume of the bubbles is occupied by thermal gas below 50 keV.
References
- (1) J.S. Sanders, A.C. Fabian, S.W. Allen, R.W. Schmidt: MNRAS 349, 952 (2004)
- (2) J.S. Sanders, A.C. Fabian, R.J.H. Dunn: MNRAS 360, 133 (2005)
- (3) A.C. Fabian, J.S. Sanders, G.B. Taylor, S.W. Allen, C.S. Crawford, R.M. Johnstone, K. Iwasawa: MNRAS 366, 417 (2006)
- (4) R.W. Schmidt, A.C. Fabian, J.S. Sanders: MNRAS 337, 71 (2002)
- (5) R. Minkowski: Optical investigations of radio sources. In: Proc. IAU Symp. 4, ed by H.C. Van de Hulst (Cambridge Univ. Press, Cambridge 1957), p. 107
- (6) R. Lynds: ApJ 159, L151 (1970)
- (7) D. Sijbring: A Radio Continuum and HI Line Study of the Perseus Cluster. PhD Thesis, University of Groningen (1993)
- (8) J.S. Sanders: MNRAS 371 829 (2006)
- (9) R.K. Smith, N.S. Brickhouse, D.A. Liedahl, J.C. Raymond: ApJ 556, L91 (2001)
- (10) E. Churazov, W. Forman, C. Jones, H. Böhringer: ApJ 590, 225 (2003)