Solar atmospheric oscillations and the chromospheric magnetic topology
Abstract
Aims. We investigate the oscillatory properties of the quiet solar chromosphere in relation to the underlying photosphere, with particular regard to the effects of the magnetic topology.
Methods. For the first time we perform a Fourier analysis on a sequence of line-of-sight velocities measured simultaneously in a photospheric (Fe I 709.0 nm) and a chromospheric line (Ca II 854.2 nm). The velocities were obtained from full spectroscopic data acquired at high spatial resolution with the Interferometric BIdimensional Spectrometer (IBIS). The field of view encompasses a full supergranular cell, allowing us to discriminate between areas with different magnetic characteristics.
Results. We show that waves with frequencies above the acoustic cut-off propagate from the photosphere to upper layers only in restricted areas of the quiet Sun. A large fraction of the quiet chromosphere is in fact occupied by “magnetic shadows”, surrounding network regions, that we identify as originating from fibril-like structures observed in the core intensity of the Ca II line. We show that a large fraction of the chromospheric acoustic power at frequencies below the acoustic cut-off, residing in the proximity of the magnetic network elements, directly propagates from the underlying photosphere. This supports recent results arguing that network magnetic elements can channel low-frequency photospheric oscillations into the chromosphere, thus providing a way to input mechanical energy in the upper layers.
Conclusions.
Key Words.:
Sun: chromosphere — Sun: magnetic fields — Sun: oscillations1 Introduction
The properties of acoustic waves propagating in a magnetized solar atmosphere have received considerable attention. Recent efforts include the utilization of UV diagnostics, in the form of time-series of both 1-D spectra (SUMER) and 2-D continuum intensities (TRACE), to address the behavior of chromospheric oscillations (see, e.g. Judge 2006, and references therein). Such studies have highlighted the presence of areas called “magnetic shadows” surrounding quiet-Sun magnetic network elements and lacking both brightness and oscillatory power in the minute range (Judge et al. 2001; Krijger et al. 2001). They have been attributed to the interaction of acoustic oscillations with the local magnetic field, in particular to the effects on wave mode propagation or conversion introduced by a highly structured magnetic configuration at chromospheric levels (McIntosh & Judge 2001). Using magnetic and velocity field measurements from MDI, it has further been determined that oscillations are suppressed when the diagnostics employed originate above the layer where the plasma (the ratio of plasma pressure to magnetic pressure) equals unity (McIntosh et al. 2003). This is the layer of the “magnetic canopy” that separates the weakly magnetized photosphere from higher regions, in which magnetic field dominates the dynamics of the plasma. Study of the shadows might help in evaluating the relative contributions of magnetic heating in different areas of the quiet Sun, and in assessing the role of high frequency (above the acoustic cutoff of about 5 mHz) versus lower frequency oscillations (Judge et al. 2001).
Much discussion has also been devoted to the ‘leakage’ of photospheric oscillations and flows into the chromosphere, due to a lowering of the acoustic cut-off frequency within inclined magnetic fields (De Pontieu et al. 2004; Hansteen et al. 2006; McIntosh & Jefferies 2006). While these analyses have mostly been based on observations of plage or active regions, it can be expected that the same kind of effect would be observable in the network fields of the quiet Sun, provided one can reach the necessary spatial and temporal resolution. Indeed, recent results reported in Jefferies et al. (2006) clearly point in this direction, showing that a sizable fraction of the photospheric acoustic power at frequencies below the cut-off might propagate to higher layers within and around the quiet magnetic network elements. The propagating waves could represent a significant source of energy to heat the ambient solar chromosphere (Judge et al. 2004; McIntosh & Jefferies 2006).
In this paper we analyze a time series of chromospheric and photospheric velocities, obtained at high spatial resolution over an extended field of view (FOV). The data were acquired with the Interferometric Bidimensional Spectrometer (IBIS, Cavallini 2006; Cavallini & Reardon 2006), installed at the Dunn Solar Telescope of the US National Solar Observatory. IBIS combines the advantages of a full spectroscopic analysis on atmospheric periodicities, usually performed with single-slit spectrographs, with the high spatial resolution, high temporal cadence and FOV typical of filter instruments. Observations of lines originating in widely spaced layers of the solar atmosphere allow a fairly direct estimation of the propagating character of waves.
2 Observations and data analysis
IBIS is used together with high-order adaptive optics (Rimmele 2004), and provides quasi-monochromatic images in the range 580-860 nm (FWHM = 2 – 4.5 pm). The spectral passband is sequentially stepped through multiple wavelengths in a number of selected lines, providing full spectral information over a circular FOV 80′′ in diameter.
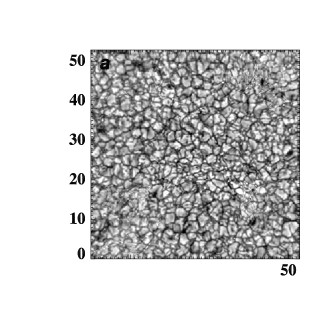
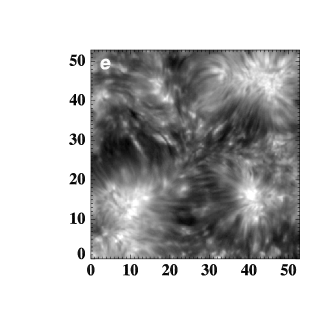
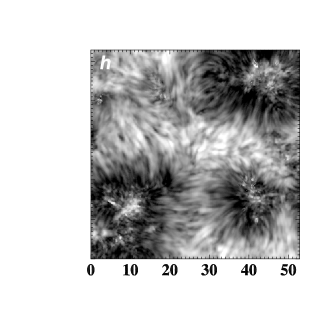
The data utilized here were acquired on June 02, 2004, in a quiet region at disk center (Janssen & Cauzzi 2006). We focus on data acquired in the mid-photospheric Fe I 709.0 nm line and in the low-chromospheric Ca II 854.2 nm line, that were sampled respectively every 4 s and 7 s (16 and 27 spectral positions per line). An approximately one-hour-long series was obtained under good seeing conditions, with a repetition rate of 19 s and a pixel scale of 0.165′′ per pixel. The data were corrected for instrumental effects, tracked in time to remove any drifts in the AO lock point (set on the granular field), and aligned to a common FOV between the two wavelengths. The final analysis was performed on the central portion of the original FOV, shown at different wavelengths in Figs. 1 and 2 (left panels). The spatially and temporally averaged spectral profiles well reproduce the atlas disk-center intensity profiles for both lines. Of particular interest are the fibrils visible in the Ca II line core intensity (Fig. 2e) which fan out around the network into the surrounding internetwork regions. These fibrils exhibit only a gradual evolution with no evidence of rapid variation at our resolution.
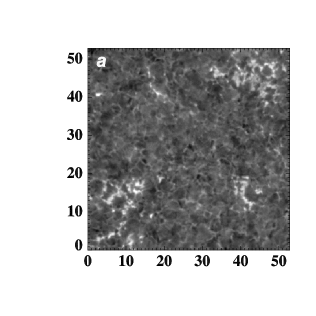
Standard Fourier analysis, including retrieval of phase difference and coherence spectra, was then applied to the temporal series of line-of-sight velocities. The latter were calculated at full spatial resolution in both lines as the position of the minima of the spectral profiles. Other analysis tecniques might be more applicable to the study of the spatio-temporal dynamics, but Fourier analysis provides an initial insight into the chromospheric behavior and indicates areas for further investigation. The spatially averaged velocity power spectra for the two lines are consistent with earlier results obtained using single-slit spectrographic observations of quiet solar regions (e.g. Fleck & Deubner 1989): the photospheric line shows a sharp peak around mHz due to the (evanescent) 5-min oscillations, while the chromospheric line has a broader distribution of power with a significant amount of power distributed near the mHz cut-off.
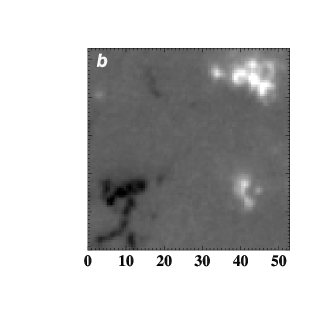
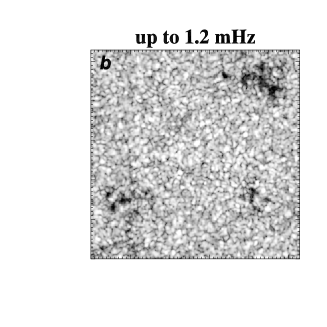
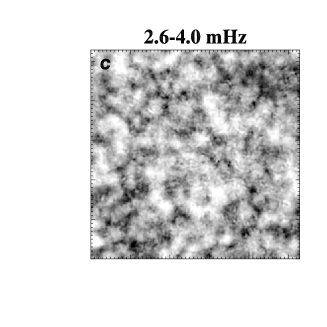
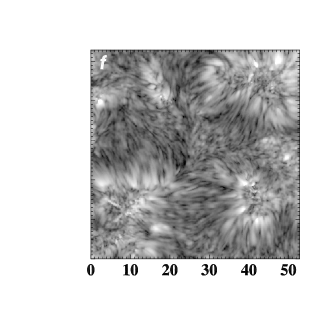
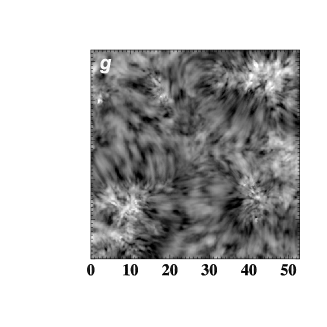
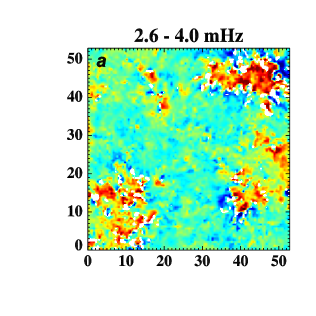
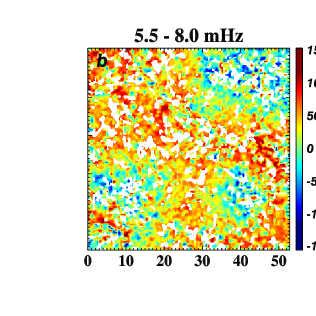
The spatial distribution of the velocity power is displayed in Fig. 2 (panels b–d and f–h), averaging the power spectra over three selected temporal frequency bands: up to 1.2 mHz (the “evolutionary” range); 2.4 – 4.0 mHz (the “evanescent” range); and 5.5 – 8.0 mHz (the “high frequency” range). Unlike earlier analyses (McIntosh & Judge 2001; McIntosh et al. 2003), we have found it illuminating for our high resolution data to differentiate between the last two frequency ranges, as will be shown below. Fig. 3 displays the spatial distribution of the phase difference spectra between the photospheric and chromospheric velocities, calculated over spatial pixels, and averaged over the evanescent and high frequency ranges. Phase difference signals at low frequencies have a salt-and-pepper appearance throughout the FOV without outlining any obvious structure, and are not analyzed in this paper.

3 Results
The photospheric velocity power maps (Fig. 2b, c, d) display well known characteristics such as lack of power in the network elements at all frequencies, especially for the locations with stronger and more spatially coherent magnetic elements (Thomas & Stanchfield 2000; Muglach et al. 2005). This suppression is clearly observable, especially for the higher frequencies, only when the spatial resolution is of the order of 1′′ or higher. In the following we focus on the Ca II power maps (Fig. 2f, g, h), as they provide a strikingly different picture: at all frequencies one can discern filamentary structures, likely outlining the magnetic canopy, that fan out from the network elements, and reach towards the quiet internetwork or (apparently) connect regions of opposite polarity. Their shape, position, and general appearance readily recall the loop structures visible in the core of the CaII 854.2 nm (cf. Fig. 2e), whose presence thus defines different areas of the FOV with very diverse oscillatory character.
Evolutionary range: At low frequencies (Fig. 2f) about 70% of the total velocity power is contained within the inner boundary of fibrilar structures that accounts for only 25% of the pixels. The highest power patches are located nearby, but not coinciding with, the actual photospheric magnetic network points – compare, e.g., the very strong feature at position (38,18). We note however that in data of limited spatial resolution such a distinction might be difficult to appreciate, and this could be the cause of earlier reports of long period (longer than 10 minutes) oscillations within the chromospheric network (e.g. McAteer et al. 2002).
Evanescent regime: At intermediate frequencies (Fig. 2g) significant chromospheric power is found within the “fibril-free” internetwork region. Fig. 3a shows that phase differences in this region have small values, thus confirming the essentially evanescent character of the waves. In this area the coherence is spatially uniform with values greater than 0.9. However, the most interesting feature is the strong concentration of power occurring within and immediately around the magnetic network (Fig. 2g), with about 5% of the pixels making up 20% of the signal. In these areas the phase difference has large positive values, reaching coherences up to 0.9. These results strongly support the findings of Jefferies et al. (2006), who argue that leakage of low-frequency photospheric oscillations into the chromosphere through ‘magneto-acoustic portals’, positioned within the network, might provide a significant source of the energy necessary for heating the quiet chromosphere.
The higher spatial resolution of our data, coupled with a larger separation between lower and upper layers, allows us further insights into this phenomenon (the two spectral lines used by Jefferies et al. 2006, have an average separation of only 250 km). For example, Fig. 2g shows that in several instances the highest chromospheric power is located at the edge of magnetic elements rather than directly within them - compare the elongated structure around position (9,13). This is probably due to a significant inclination of the magnetic fields in some part of the network, so that the chromospheric signal originating in the magnetic footpoints will appear displaced with respect to the source. We note that the same effect will also cause a loss of apparent spatial connection between the photospheric and chromospheric velocities, perhaps justifying the frayed appearance of both phase and coherence maps in these areas, as well as the lower coherence values. We will examine this issue in more detail in a future work.
High frequency range. The power map of Fig. 2h, obtained for frequencies above the acoustic cut-off, provides a clear insight into the ‘magnetic shadows’ described in the Introduction. The region affected by the presence of the Ca II fibrils shows a much reduced oscillatory power (about 25% on average) with respect to the remaining ‘quiet’ FOV. From comparison with the previous figures it is clear that the distinction in oscillatory properties is based not on the photospheric magnetic field but on its 3-D topology: most of the area lying below the canopy displays normal granulation, and lacks any particular signature in MDI magnetic maps.
The phase difference map of Fig. 3b also shows a ‘segregated’ behavior, with consistently positive values only in the regions of hig-power. We take this as indication that acoustic disturbances can propagate to chromospheric layers only when not impeded by the presence of the canopy that can absorb, scatter or transform them by means of a strongly inclined magnetic field (Bogdan et al. 2003; Schunker & Cally 2006).
The spatially averaged coherence is approximately 0.6 in the regions of positive phase difference, and less than 0.4 in the “fibrilar” areas around the network (a fact already noted in Deubner & Fleck 1990). However, while the spatial distribution of the coherence in the canopy region is rather compact, it is very fragmented in the central part of the FOV, with patches of coherence as high as 0.9 lie next to ones with very low values (white patches in Fig. 3b) We believe this is due, at least in part, to the presence of acoustic shocks that start developing at the typical height of formation of the Ca II line (Carlsson & Stein 1997).
4 Discussion and conclusions
Our high resolution velocity power and phase difference maps strongly support the view of McIntosh & Judge (2001) that even the quiet solar atmosphere can be sharply partitioned in regions of different ‘connectivity’ between the lower photosphere and higher layers, depending on the local magnetic topology. Our findings are consistent with earlier results obtained with the analysis of chromospheric UV continua (Judge et al. 2001; McIntosh et al. 2003). Despite the added complexity of line formation in a highly structured environment, it appears that the Doppler shift of the Ca II 854.2 nm line can be employed as a reliable diagnostic of the low-chromosphere dynamics. Even with the restrictions due to terrestrial seeing and sequential spectral acquisition, our data provide both higher spatial resolution and a clearer diagnostic of chromospheric dynamics than other observations, for example by TRACE. In particular, the latter is due to the fact that our signatures form in layers much more widely separated than the UV continua at 160 and 170 nm commonly used.
Our results suggest that the highly dynamic fibril-like structures visible in the core of the CaII 854.2 nm line can safely be taken as proxies of the magnetic canopy that threads the chromosphere. These structures seem to represent an atmospheric component that until now has been mostly overlooked, but that has the potential to fill many gaps in our understanding of the chromosphere or even reconcile (apparently) conflicting results. For example, our data readily explain why comparable quiet Sun chromospheric observations taken with slit spectrographs sometimes provide confusing views (Judge et al. 2001; Pietarila et al. 2006). Most often, a spectrograph’s slit is positioned on the basis of photospheric signatures, such as MDI longitudinal field maps, brightness in the CaII wings, etc. in order to avoid magnetic strutures. However, as clearly shown in Figs. 2h and 3b, the observed chromospheric properties strongly depend on the presence of fibrilar regions, whose location and extension is not immediately predictable from photospheric maps.
Fig. 2h shows that an appreciable amount of chromospheric power in the 3-minute range is restricted to a limited fraction of the field of view. This area is much smaller than what would be defined as “internetwork” on the basis of photospheric signatures – for the data discussed here this fraction is about 50%. Hence the issue of what actually heats the chromosphere becomes even more pressing, as the (non-magnetic) acoustic wave dissipation theory might apply to a less ‘quiet Sun’ than conventionally assumed. A possible solution is provided by the power and phase difference maps of Fig. 2g and Fig. 3a that show how the network magnetic elements can channel photospheric acoustic power into upper layers at frequencies below the cut-off. As noted in Jefferies et al. (2006), the net mechanical energy flux provided by these waves could provide a considerable fraction of the energy needed to balance the radiative chromospheric losses. Given the complexity in the actual atmospheric stratification, we will not calculate this energy. We note instead that our spectrally resolved observation would be suited for a detailed comparison with hydrodynamical simulations of the kind presented in Hansteen et al. (2006). In particular, at the heights sampled by the 854.2 nm line such propagating waves might be already developing into the slow shocks invoked by De Pontieu et al. (2004), thus providing a way to deposit the energy in the quiet chromosphere.
It is possible that the small fraction of the FOV possessing significant 3-minute power is a result of the particular area analyzed in this paper, in which the enhanced, bipolar network elements might alter the local field topology in ways not completely representative of the quiet Sun. While acknowledging that there might be differences with respect to supergranular cells enclosed by weak unipolar network (or, even more so, cells in coronal holes), the active network is normally present across the Sun and the cycle, as a review of MDI data show. Our temporally and spatially averaged data are fully consistent with both atlas intensity profiles and previously published averaged power spectra. Nevertheless, a survey of oscillatory behavior in various quiet-Sun configurations would be very revealing, especially if coupled with simultaneous TRACE observations to confirm the shadow extensions. We plan to perform coordinated observations of this kind in the near future.
Acknowledgements.
We are grateful to P. Cally, B. Fleck, and F. Hill for comments and discussions. F. Wöger kindly provided the speckle reconstruction code. We thank the referee Rob Rutten for the detailed comments. IBIS was built with contributions from INAF/Arcetri Observatory, the University of Florence, the University of Rome Tor Vergata, and MIUR. NSO is operated by the Association of Universities for Research in Astronomy, Inc. (AURA), under cooperative agreement with the National Science Foundation. This research was partially funded through the European Solar Magnetism Network (ESMN, contract HPRN-CT- 2002-00313), PRIN-MIUR 2004 and the Italian Ministry of Foreign Affairs (MAE)References
- Bogdan et al. (2003) Bogdan, T. J., Carlsson, M., Hansteen, V. H., et al. 2003, ApJ, 599, 626
- Carlsson & Stein (1997) Carlsson, M. & Stein, R. F. 1997, ApJ, 481, 500
- Cavallini (2006) Cavallini, F. 2006, Sol. Phys., 236, 415
- Cavallini & Reardon (2006) Cavallini, F. & Reardon, K. 2006, Memorie della Societa Astronomica Italiana Supplement, 9, 55
- De Pontieu et al. (2004) De Pontieu, B., Erdélyi, R., & James, S. P. 2004, Nature, 430, 536
- Deubner & Fleck (1990) Deubner, F.-L. & Fleck, B. 1990, A&A, 228, 506
- Fleck & Deubner (1989) Fleck, B. & Deubner, F.-L. 1989, A&A, 224, 245
- Hansteen et al. (2006) Hansteen, V. H., De Pontieu, B., Rouppe van der Voort, L., van Noort, M., & Carlsson, M. 2006, ApJ, 647, L73
- Janssen & Cauzzi (2006) Janssen, K. & Cauzzi, G. 2006, A&A, 450, 365
- Jefferies et al. (2006) Jefferies, S. M., McIntosh, S. W., Armstrong, J. D., et al. 2006, ApJ, 648, L151
- Judge (2006) Judge, P. G. 2006, in ASP Conf. Ser. 354, ed. H. Uitenbroek, J. Leibacher, & R. Stein, 265
- Judge et al. (2004) Judge, P. G., Saar, S. H., Carlsson, M., & Ayres, T. R. 2004, ApJ, 609, 392
- Judge et al. (2001) Judge, P. G., Tarbell, T. D., & Wilhelm, K. 2001, ApJ, 554, 424
- Krijger et al. (2001) Krijger, J. M., Rutten, R. J., Lites, B. W., et al. 2001, A&A, 379, 1052
- Leenaarts et al. (2006) Leenaarts, J., Rutten, R. J., Carlsson, M., & Uitenbroek, H. 2006, A&A, 452, L15
- McAteer et al. (2002) McAteer, R. T. J., Gallagher, P. T., Williams, D. R., et al. 2002, ApJ, 567, L165
- McIntosh et al. (2003) McIntosh, S. W., Fleck, B., & Judge, P. G. 2003, A&A, 405, 769
- McIntosh & Jefferies (2006) McIntosh, S. W. & Jefferies, S. M. 2006, ApJ, 647, L77
- McIntosh & Judge (2001) McIntosh, S. W. & Judge, P. G. 2001, ApJ, 561, 420
- Muglach et al. (2005) Muglach, K., Hofmann, A., & Staude, J. 2005, A&A, 437, 1055
- Pietarila et al. (2006) Pietarila, A. M., Socas-Navarro, H., & Bogdan, T. J. 2006, AAS/Solar Physics Division Meeting, 37, #19.02
- Rimmele (2004) Rimmele, T. R. 2004, in Advancements in Adaptive Optics. Proceedings of the SPIE, Volume 5490, ed. D. Bonaccini Calia, B. L. Ellerbroek, & R. Ragazzoni, 34–46
- Schunker & Cally (2006) Schunker, H. & Cally, P. S. 2006, MNRAS, 1003
- Thomas & Stanchfield (2000) Thomas, J. H. & Stanchfield, II, D. C. H. 2000, ApJ, 537, 1086