Optical Spectroscopy of the Large Kuiper Belt Objects
136472 (2005 FY9) and 136108 (2003 EL61)
Abstract
We present high signal precision optical reflectance spectra of the large Kuiper belt objects 2005 FY9 and 2003 EL61. The spectrum of 2005 FY9 exhibits strong CH4-ice bands. A comparison between the spectrum and a Hapke model indicates the CH4 bands are shifted 3.25 2.25 Å relative to pure CH4-ice, suggesting the presence of another ice component on the surface of 2005 FY9, possibly N2-ice, CO-ice, or Ar. The spectrum of 2003 EL61 is remarkably featureless. There is a hint of an O2-ice band at 5773 Å; however, this feature needs to be confirmed by future spectroscopic observations of 2003 EL61 with a higher continuum signal precision, sufficient to detect a second weaker O2-ice band at 6275 Å.
1 Introduction
Measuring the surface composition of Kuiper belt objects (KBOs) may provide clues about the composition and environment of the primordial solar nebula as well as the important evolutionary processes occurring in the outer Solar System over the last 4.5 Gyr. Unfortunately, there are only a handful of KBOs that are known to exhibit ice absorption bands in their spectra. H2O-ice bands are seen in spectra of 1996 TO66 (Brown et al., 1999), Varuna (Licandro et al., 2001), Quaoar (Jewitt & Luu, 2004), and Orcus (Fornasier et al., 2004a). CH4-ice bands are seen in spectra of Pluto (Cruikshank et al., 1976; Fink et al., 1980; Grundy & Fink, 1996), Neptune’s satellite Triton, which may be a captured KBO (Cruikshank et al., 1993), Eris (Brown et al., 2005), and 2005 FY9 (Licandro et al., 2006) . There are perhaps a dozen objects that exhibit spectra with no ice absorption bands (Doressoundiram et al., 2003; Fornasier et al., 2004b)
The recent discovery of extraordinarily bright and large KBOs opens up a new opportunity for the physical and chemical studies of KBO surfaces with high signal precision optical reflectance spectroscopy. Bright objects make it possible to either carry out in-depth physical modeling of ice and mineralogical absorption bands or set stringent upper limits on the presence of such bands.
Here we present high signal precision optical reflectance spectra of KBOs 2005 FY9 and 2003 EL61. Both objects are candidates for membership in the newly defined class “dwarf planet.” The diameter of 2005 FY9 is estimated at 1600 km (Brown et al., 2006) while 2003 EL61 appears to be a highly elongated ellipsoid with axes of 1950 2500 km (Rabinowitz et al., 2006). For comparison, Pluto has a diameter of 2350 km. 2005 FY9 and 2003 EL61 are among “scattered-near” objects (i.e. non-resonant, non-planet-crossing objects with Tisserand parameters less than 3, relative to Neptune) in the Deep Ecliptic Survey classification system (Elliot et al., 2005). 2005 FY9 has a perihelion distance, q, of 38.6 AU, an aphelion distance, Q, of 52 AU, a semi-major axis, a, of 45.3 AU, an inclination angle to the ecliptic, i, of 29∘, and an eccentricity of 0.15. 2003 EL61 has q 35.1 AU, Q 51 AU, a 43.1 AU, i 28∘, and e 0.18 For comparison, Pluto has q 29.7 AU, Q 49 AU, a 39.5 AU, i 17∘, and e 0.25. At the time of observation, 2005 FY9 and 2003 EL61 were both near aphelion.
2 Observations
We obtained spectra of 2005 FY9 and 2003 EL61 on 2006 March 5 UT with the 6.5-meter MMT telescope on Mt. Hopkins, AZ, the Red Channel Spectrograph, and a 1200 800 CCD. A 150 g mm-1 grating and a 1 arc sec slit width provided wavelength coverage of 5000 to 9500 Å in first order, a dispersion of 6.38 Å pixel-1, and a fwhm resolution of 20.0 Å. A LP495 blocking filter eliminated contamination from the second order.
There were high, thin cirrus clouds through most of the night and the seeing was 0.8 arc sec. The KBOs were placed at the center of the slit and tracked at KBO rates.
We used the Image Reduction and Analysis Facility (IRAF) and standard procedures (Massey et al., 1992) to calibrate and extract one-dimensional spectra from the two-dimensional spectral images. Specifically, the electronic bias of each image was removed by subtracting its overscan as well as a bias picture. Pixel to pixel sensitivity variations were removed from each image by dividing by a normalized twilight flatfield image. Extraction of one-dimensional spectra from the images was done with the apall task in IRAF. HeNeAr spectra were used to correct for flexure and obtain an accurate wavelength calibration. Our wavelengths are accurate to one-tenth of a pixel or 0.7 Å. We removed telluric bands and Fraunhofer lines from the KBO spectra by observing the solar analog HD 112257 (Hardorp, 1982) at airmasses very close to 2005 FY9 and 2003 EL61, and then then dividing the KBO spectra by the normalized solar analog spectra. Typically, the airmass difference between the KBOs and the solar analog was 0.05. The 2005 FY9 and 2003 EL61 spectra in the analysis below are an average of four 10-minute and five 10-minute exposures, respectively.
3 Results
3.1 2005 FY9
We plot our reflectance spectrum of 2005 FY9 in Figure 1 (bottom). The tick marks correspond to previously reported absorption maxima of CH4-ice (Table 1). The middle and top spectra in Figure 1 are of 2005 FY9 (Licandro et al., 2006) and Pluto (Grundy & Fink, 1996). All spectra are normalized to 1 at 6500 Å. For the purpose of comparison, the Licandro et al. (2006) 2005 FY9 and Pluto spectra are offset by 0.4 and 0.8, respectively. Clearly, 2005 FY9 exhibits much deeper CH4-ice bands than Pluto.
Our spectrum differs from the Licandro et al. (2006) spectrum in two ways. First, our spectrum exhibits additional subtle absorption bands at 5400, 5800, and 6000 Å. These bands have not been seen before in astronomical or laboratory spectra of CH4-ice. Because the bands are close to the wavelengths of gas phase CH4 bands and because there are strong CH4-ice bands at longer wavelengths in the spectrum of 2005 FY9, we think the new bands are due to CH4-ice. In addition, it appears the band at 6200 Å is CH4-ice as well. It is in the Licandro et al. (2006) spectrum, but they do not identify it as CH4-ice. Second, we find a continuum slope between 5500 and 6500 Å of 10%/1000Å while Licandro et al. (2006) find a slope of 13%/1000Å, with both spectra normalized to 1 at 6500 Å. We used HD 112257, a G2V star, for our solar analog star whereas Licandro et al. (2006) used BS 4486, a G0V star, for their solar analog star. An examination of the VR colors for G0V and G2V stars suggests the slope difference is due to the use of different solar analog stars.
In order to place constraints on the CH4 grain size as well as the presence of any additional ice components on the surface of 2005 FY9, we calculated model CH4-ice spectra. Our models use laboratory optical constants for pure CH4-ice at 30 K (Grundy et al., 2002) and arbitrary optical constants that absorb more at blue than red wavelengths, and thereby reproduce the observed reddish slope for the 2005 FY9 continuum. The ice and reddening agent were mixed in the model at the molecular level (i.e. by means of a weighted average of the ice and reddening agent optical constants). We used Hapke theory (Hapke, 1981, 1993) to transform the optical constants into reflectance spectra. We used Hapke parameters h 0.1, Bo 0.8, 30∘, and P(g) a two component Henyey-Greenstein function with 80% in the forward scattering lobe and 20 % in the back scattering lobe and both lobes having asymmetry parameter 0.63. These values are comparable to numbers used previously to model the surface of Pluto (Grundy & Buie, 2001).
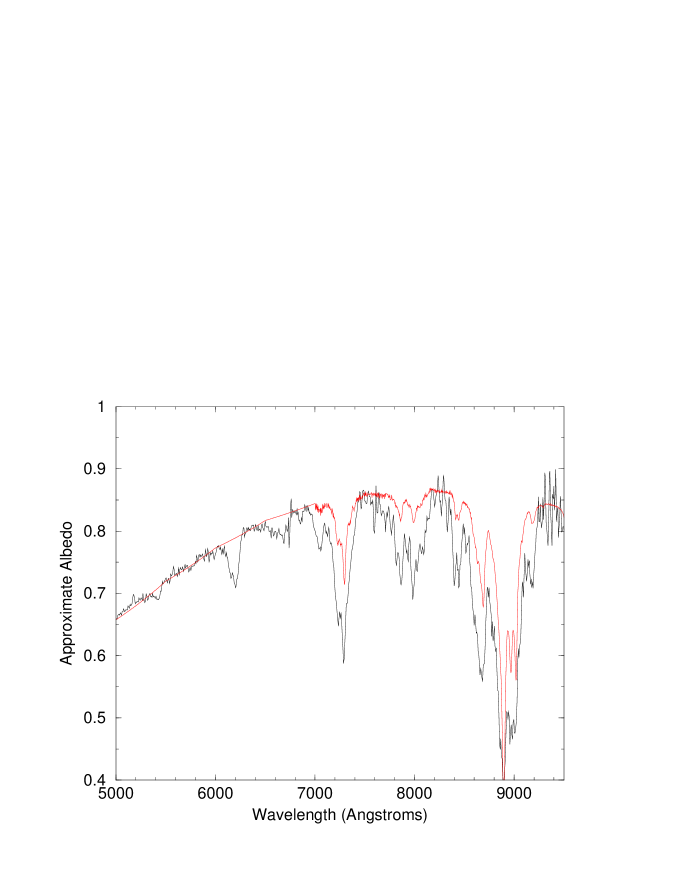
Figure 2 compares the spectrum of 2005 FY9 (black line) and a Hapke model with a grain size of 0.55 cm (red line). Although the model fits the core of the 8897 Å band, it has too little absorption at all the other bands. Next, we fit the core of the weaker 7296 Å band with a 1.8 cm grain size. Then, we fit the core of the even weaker 8000 Å complex with a 2.5 cm grain size. These models illustrate a trend, weaker bands (which see deeper into the surface) aways seem to need bigger grain sizes, or equivalently, greater optical path lengths in CH4-ice.
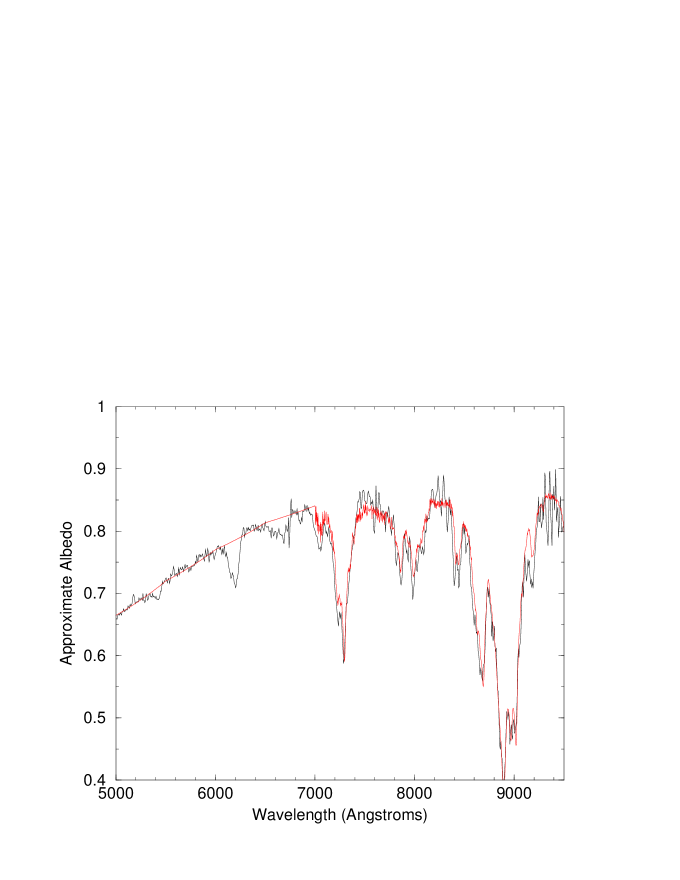
From the above discussion, it is clear a single grain size will not fit the observations. In Figure 3, we present a Hapke model that uses two grain sizes, 6 cm (97 % by volume) and 0.1 cm (0.03 % by volume), in an intimate mixture. The inability of the two-grain size model to fit the CH4-ice band at wavelengths less than 7000 Å in Figure 3 is due to the lack of laboratory optical constants. We note that our two-grain size model is not a unique solution. Although this model fits the data, other models (such as courser grains underneath a coating of finer grains) would probably fit the data just as well. In addition, it is important to realize that grain sizes larger than 1 cm are probably a measure of the spacing of fractures or voids in the solid surface rather than indicating a surface covered by golf-ball sized particles.
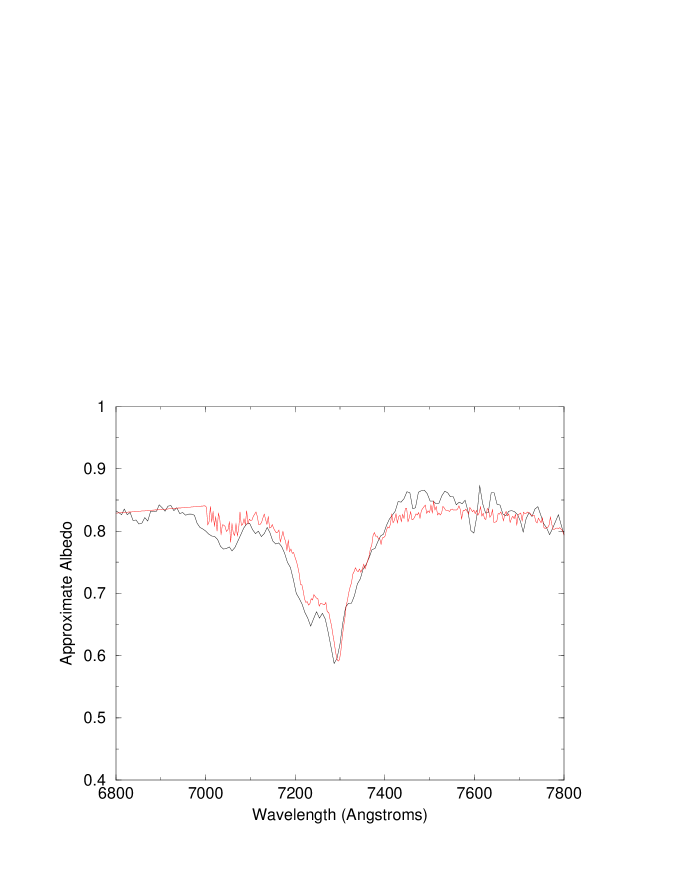
Although we can fit the shape and depth of the absorptions, there is a small but significant difference between our models and the telescope data. Specifically, the maxima of the CH4 absorption bands in the spectrum of 2005 FY9 reside blueward of the maxima in the pure CH4 Hapke models. In Figure 4, we present a small portion of Figure 3 centered on the 7296 Å band to illustrate the shift. Such a shift is important because laboratory experiments show that the 8897, 8968, and 9019 Å bands in spectra of pure CH4-ice are shifted blueward by 27 Å in a CH4/N2 0.8 % mixture (Quirico & Schmitt, 1997). Another experiment finds the 8897 Å band shifts 17 Å in a CH4/N2 20 % ice mixture (Grundy & Fink, 1993).
A cross correlation experiment provides a way to quantify the apparent shift in Figure 3. Specifically, we wrote a Fortran program to shift the model spectrum from 25 to 25 Å in 1 Å steps. For each shift, the program finds the difference between the data and model, i.e. it calculates where and represent the ordinate values of the data and the model spectra at wavelength i. Then, the program sums the squares of the difference over all N wavelength points between 7000 and 9300 Å. In other words, we calculate
| (1) |
In Figure 5, we present a plot of the sums of the squares of the differences, i.e. , as function of shift. We find a well defined minimum at 3.25 Å.
What is the uncertainty in the 3.25 Å measurement? We note that HeNeAr spectra enable us to calibrate the wavelengths in the 2005 FY9 spectrum to an uncertainty of 1/10 of a pixel or 0.7 Å. Specifically, we find the average difference between the centroids of airglow lines in our data and the corresponding laboratory values is 0.7 Å. A larger source of uncertainty comes from the noise in the spectra and the broadness of the cross correlation minimum in Figure 5. Propagation of the noise in the data and model spectra for the 3 Å shift through equation (1) gives an ordinate error bar for the minimum point (3.25, 2.218) in Figure 5 of 0.042. As a result, the uncertainty in our shift measurement is defined by 2.218 0.042 2.260 (i.e. the section of the curve below the dashed line in Figure 5), corresponding to shifts between 1 and 5.5 Å. In short, we find the CH4-ice bands in the spectrum of 2005 FY9 are blueshifted relative to the model Hapke spectrum by 3.25 2.25 Å.
Licandro et al. (2006) gave blueshifts of 2 - 6 Å for CH4 bands in their Table 1, but they questioned the reality of the shifts because they are so small. Our independent measurement of shifts with similar magnitude bolsters the case for the reality of the small shifts. In fact, when we take the Licandro et al. (2006) data and do a cross correlation experiment between our spectrum and their spectrum, we find no measurable shift between the spectra; but when we perform a cross correlation experiment between their spectrum and the Hapke model, we find their CH4-ice bands are blue shifted 2 Å relative to the model. Our spectrum and the Licandro et al. (2006) spectrum are consistent.
3.2 2003 EL61
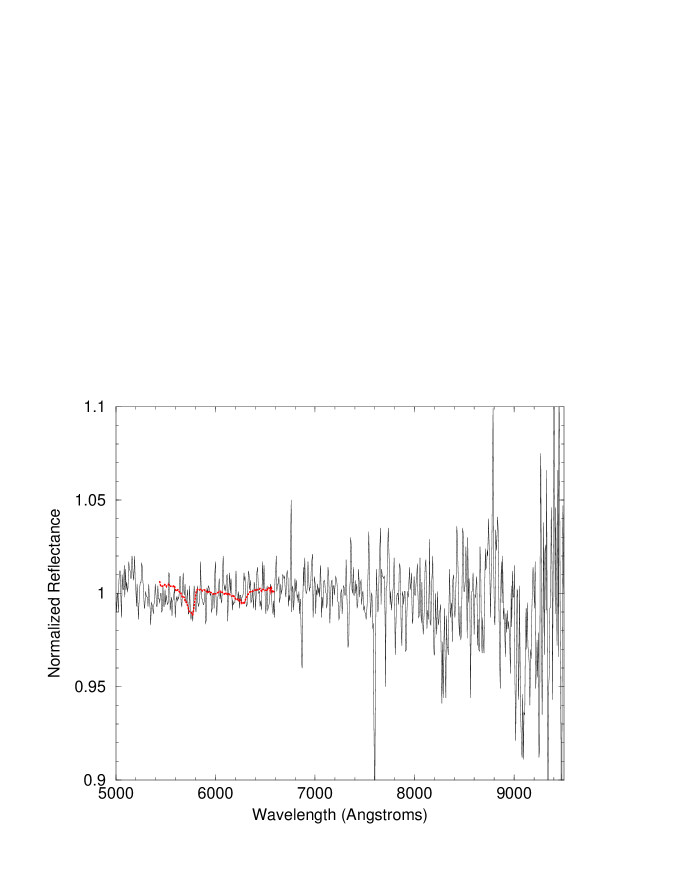
We plot our reflectance spectrum of 2003 EL61 in Figure 6. The continuum has a slope of essentially zero, consistent with BV 0.63 0.03 and VR 0.34 0.02 (Rabinowitz et al., 2006). Evidently, tholins are not present on the surface of 2003 EL61 at an abundance seen on 2005 FY9. (Recall that both objects were observed on the same night and compared against the same solar analog spectrum.) We find no evidence of CH4-ice bands, but we can set an upper limit on the thickness of a global glaze of CH4-ice by applying Beer’s Law,
| (2) |
to the continuum near the 8897 Å band. In the above equation, t is the thickness of the glaze, aλ are the Lambert absorption coefficients for CH4-ice (Grundy et al., 2002), the factor of two comes about because light passes through the glaze once on the way in and once on the way back out, (I/Io)λ is the ratio of light leaving the glaze to the light incident on the glaze. For (I/Io)λ=8897 0.97, we find t 0.3 mm.
H2O-ice bands are seen in near-infrared spectra of 2003 EL61 (Barkume et al., 2006). Therefore, it is reasonable to look for evidence of solid-state photolytic or radiolytic chemistry (Johnson, 1990; Johnson & Quickenden, 1997; Delitsky & Lane, 1997) by seeing if O2-ice is present on the surface of 2003 EL61. In Figure 6, we superimpose the 5773 and 6275 Å O2-ice bands in spectra of Ganymede (Calvin & Spencer, 1997) on top of our 2003 EL61 spectrum. There is a tantalizing dip at 5773 Å in the spectrum of 2003 EL61, but no dip at the weaker 6275 Å band. The continuum signal precision at the position of these bands is about 150 and so if the 5773 Å band is real, it would take a continuum signal precision of about 300 to detect the 6275 Å band.
We estimate an upper limit to the thickness of a global glaze of O2-ice by assuming the possible feature at 5773 Å is real and then applying Beer’s Law as we did for CH4-ice. For (I/Io)λ=5573 0.99 and aλ=5773 5.5 cm-1, we find t 0.01 mm. Our value for aλ=5773 comes from an integrated absorption coefficient of 1.1 103 cm-2 and a band fwhm of 200 cm-1 (Landau et al., 1962).
4 Conclusions
Our spectrum of 2005 FY9 exhibits strong CH4-ice bands in agreement with the spectrum of Licandro et al. (2006). From a comparison of our spectrum and a Hapke model, we find the 2005 FY9 CH4-ice bands are shifted 3.25 2.25 Å blueward relative to the positions of pure CH4-ice bands. The shift could be due to the presence of another ice-component, possibly N2-ice, CO-ice, or Ar. Future higher resolution spectra of the individual CH4 bands should determine if the weaker bands which penetrate deeper into the surface exhibit different shifts than the stronger bands which do not penetrate as deep into the surface. Such observations could provide a technique to measure the CH4 concentration relative to the other ice component as a function of depth below the surface of 2005 FY9. In addition, it is highly desirable to obtain a measure of the shift as a function of rotational longitude on 2005 FY9 for a particular CH4-ice band. Such a technique could provide a measure of inhomogeneity on the surface of 2005 FY9. Grundy & Fink (1996) made such measurements for the 8897 Å band on Pluto and found that the blueshift varied from 0 to 10 Å over the surface.
On Pluto, it appears N2 is sufficiently mobile to form textures that allow incoming photons to travel several centimeters through the very transparent, polycrystalline N2-ice before the photons are scattered off inclusions or grain boundaries. The long pathlengths make it possible for a small amount of CH4 relative to N2 to give deep CH4 absorption bands. The mobility of CO is only a little less than N2, and the mobility of Ar is only a little less than CO. Therefore, it is possible that CO-ice or Ar-ice could provide the host matrix for long optical pathlengths. It is also possible the host matrix is a combination of N2, CO, and Ar. A suite of laboratory experiments that measure the shifts of CH4 absorption maxima for different concentrations of CH4 relative to N2, CO, and Ar would be highly valuable for the future interpretation of observational data.
Our spectrum of 2003 EL61 is remarkably featureless. There is a hint of a band at 5773 Å possibly due to O2-ice. Future work will attempt to double the signal precision of the continuum to at least 300, which is the level that appears to be required for any possible detection of the weaker O2-ice band at 6275 Å. The detection of O2-ice in significant quantities on KBOs could be of considerable interest in the distant future as a source of spacecraft fuel.
Acknowledgments
SCT, WR, and KM gratefully acknowledge support from NASA Planetary Astronomy grant NNG06G138G to Northern Arizona University and the University of Oklahoma. WMG gratefully acknowledges support from NASA Planetary Geology and Geophysics grant NNG04 G172G to Lowell Observatory. GJC gratefully acknowledges support from Fordham University. We thank Steward Observatory for the allocation of telescope time on the MMT. We thank Dr. J. Licandro for providing us with his spectrum of 2005 FY9. We thank an anonymous referee for a careful review of our manuscript.
References
- Barkume et al. (2006) Barkume, K. M., Brown, M. E., and Schaller, E. L. 2006, ApJ, 640, L87.
- Brown et al. (2006) Brown, M. E., Barkume, K. M., Blake, G. A., Schaller, E. L., Rabinowitz, D. L., Roe, H. G., & Trujillo, C. A. 2006, AJ, submitted.
- Brown et al. (2005) Brown, M. E., Trujillo, C. A., & Rabinowitz, D. L. 2005, ApJ, 635, L97
- Brown et al. (1999) Brown, R. H., Cruikshank, D. P., & Pendleton, Y. 1999, ApJ, 519, L101
- Calvin & Spencer (1997) Calvin, W. M., & Spencer, J. R. 1997, Icarus, 130, 505.
- Cruikshank et al. (1976) Cruikshank, D. P., Pilcher, C. B., & Morrison, D. 1976, Science, 194, 835
- Cruikshank et al. (1993) Cruikshank, D. P., Roush, T. L., Owen, T. C., Geballe, T. R., de Bergh, C., Schmitt, B., Brown, R. H. and Bartholomew, M. J. 1993, Science, 261, 742
- Delitsky & Lane (1997) Delitsky, M. L., & Lane, A. L. 1997, J. Geophys. Res., 102, 16385
- Doressoundiram et al. (2003) Doressoundiram, A., Tozzi, G. P., Barucci, M. A., Boehnhardt, H., Fornasier, S. & Romon J. 2003, AJ, 125, 2721
- Elliot et al. (2005) Elliot, J. L., Kern, S. D., Clancy, K. B., Gulbis, A. A. S., Millis, R. L., Buie, M. W., Wasserman, L. H., Chiang, E. I., Jordan, A. B., Trilling, D. E., and Meech, K. J. 2005, AJ, 129, 1117
- Fink et al. (1980) Fink, U., Smith, B. A., Johnson, J. R., Reitsema, H. J., Benner, D. C., & Westphal, J. A. 1980, Icarus, 44, 62
- Fornasier et al. (2004a) Fornasier, S., Dotto, E., Barucci, M. A., & Barbieri, C. 2004a, A&A, 422, 43
- Fornasier et al. (2004b) Fornasier, S., Doressoundiram, A., Tozzi, G. P., Barucci, M. A., Boehnhardt, H., de Bergh, C., Delsanti, A., Davies, J., & Dotto, E. 2004b, A&A, 421, 353
- Grundy & Buie (2001) Grundy, W. M., & Buie, M. W. 2001, Icarus, 153, 248
- Grundy & Fink (1993) Grundy, W. M., & Fink, U. 1993, Pluto & Charon Conference, Flagstaff, AZ, July 6-9, 1993
- Grundy & Fink (1996) Grundy, W. M. & Fink, U. 1996, Icarus, 124, 329.
- Grundy et al. (2002) Grundy, W. M., Schmitt, B., and Quirico, E. 2002, Icarus, 155, 486.
- Hapke (1981) Hapke, B. 1981, J. Geophys. Res., 86, 4571.
- Hapke (1993) Hapke, B. 1993, Combined Theory of Reflectance and Emittance Spectroscopy (New York: Cambridge Univ. Press)
- Hardorp (1982) Hardorp, J. 1982, A&A, 105, 120
- Jewitt & Luu (2004) Jewitt, D. C., & Luu, J. 2004, Nature, 432, 731
- Johnson (1990) Johnson, R. E. 1990, Energetic Charged-Particle Interactions With Atmospheres and Surfaces. (New York: Springer-Verlag)
- Johnson & Quickenden (1997) Johnson, R. E., & Quickenden, T. I. 1997, J. Geophys. Res., 102, 10985
- Landau et al. (1962) Landau, A., Allin, E. J., & Welsh, H. L. 1962, Spectrochimica Acta, 18, 1.
- Licandro et al. (2001) Licandro, J., Oliva, E., & Di Martino, M. 2001, A&A, 373, L29
- Licandro et al. (2006) Licandro, J., Pinilla-Alonso, N., Pedani, M., Oliva, E., Tozzi, G. P., and Grundy, W. M. 2006, A&A, 445, L35.
- Luu & Jewitt (1996) Luu, J. & Jewitt, D. 1996, AJ, 112, 2310
- Massey et al. (1992) Massey, P., Valdes, F., & Barnes, J. 1992, in A User’s Guide to Reducing Slit Spectra With IRAF
- Quirico & Schmitt (1997) Quirico, E., & Schmitt, B. 1997, Icarus, 127, 354
- Rabinowitz et al. (2006) Rabinowitz, D. L., Barkume, K., Brown, M. E., Roe, H., Schwartz, M., Tourtellotte, S., and Trujillo, C. 2006, ApJ, 639, 1238.


| Transition | Wavelength (Å) | Wavenumber (cm-1) |
|---|---|---|
| 3 4 | 7296 | 13706 |
| 3 3 | 7862 | 12719 |
| 3 3 | 7993 | 12511 |
| 4 | 8415 | 11884 |
| 3 | 8442 | 11846 |
| 3 2 | 8691 | 11506 |
| 2 2 | 8897 | 11240 |
| 3 2 | 8968 | 11151 |
| 2 4 | 9019 | 11088 |