A Post-AGB Star in the Small Magellanic Cloud Observed with the SPITZER Infrared Spectrograph
Abstract
We have observed an evolved star with a rare combination of spectral features, MSX SMC 029, in the Small Magellanic Cloud (SMC) using the low-resolution modules of the Infrared Spectrograph on the Spitzer Space Telescope. A cool dust continuum dominates the spectrum of MSX SMC 029. The spectrum also shows both emission from polycyclic aromatic hydrocarbons (PAHs) and absorption at 13.7 µm from C2H2, a juxtaposition seen in only two other sources, AFGL 2688 and IRAS 134166243, both post-asymptotic giant branch (AGB) objects. As in these sources, the PAH spectrum has the unusual trait that the peak emission in the 7–9 µm complex lies beyond 8.0 µm. In addition, the 8.6 µm feature has an intensity as strong as the C–C modes which normally peak between 7.7 and 7.9 µm. The relative flux of the feature at 11.3 µm to that at 8 µm suggests that the PAHs in MSX SMC 029 either have a low ionization fraction or are largely unprocessed. The 13–16 µm wavelength region shows strong absorption features similar to those observed in the post-AGB objects AFGL 618 and SMP LMC 11. This broad absorption may arise from the same molecules which have been identified in those sources: C2H2, C4H2, HC3N, and C6H6. The similarities between MSX SMC 029, AFGL 2688, and AFGL 618 lead us to conclude that MSX SMC 029 has evolved off the AGB in only the past few hundred years, making it the third post-AGB object identified in the SMC.
1 Introduction
As a star ascends the asymptotic giant branch (AGB), its outer atmosphere expands and pulsates, pushing gas away from the star where it can cool and condense into dust grains. The resulting circumstellar dust shell hides the star in the optical and emits strongly in the infrared (IR). Eventually this mass-loss process will eject enough mass to expose the high-temperature core of the star, ionizing the gas inside the dust shell and forcing the transition from an AGB star to a planetary nebula. Objects making this transition are in their “post-AGB” phase (sometimes referred to as the “proto planetary nebula” phase). Dust and gas characteristics change rapidly in this very short evolutionary stage, and the sources identified as post-AGB objects display a wide variety of properties. Van Winckel (2003) provides a good review of Galactic post-AGB objects and their general (albeit often disparate) properties. One of the challenges in understanding this phase of stellar evolution is identifying post-AGB candidates. Distinguishing post-AGB objects from other types of sources with circumstellar dust often depends on the derived luminosity for which a reliable distance is needed. While distances for field star candidates can be problematic, those for objects in the Large and Small Magellanic Clouds (LMC, SMC) are well constrained. Wood & Cohen (2001) identified 25 post-AGB candidates in the LMC using 8 µm data from the Midcourse Space Experiment and near-IR observations. To date though, only two post-AGB objects have been identified in the SMC, IRAS 003507436 (Whitelock et al., 1989) and [KVS2000] MIR 1 (Kucinskas et al., 2000). Stellar evolution is also dependent on metallicity, but many of the details are not well understood. Thus, identification and observation of additional post-AGB objects in the LMC and SMC are therefore necessary for characterizing this phase of stellar evolution.
2 Observations and Data Reduction
We observed MSX SMC 029111We follow the nomenclature of Egan, van Dyk, & Price (2001). In the MSX Point Source Catalog V2.3 (Egan et al., 2003), MSX SMC 029 = G304.364943.5610. with the Infrared Spectrograph (IRS; Houck et al., 2004) on the Spitzer Space Telescope (Werner et al., 2004) on 2004 October 25 as part of a project to study circumstellar dust shells in the SMC. The observations used the Short-Low (SL) and Long-Low (LL) modules, which have a wavelength range of 5–36 µm and an average spectral resolution of 100. We extracted the spectra from the Spitzer Science Center S13.2 (SL) and S14.0 (LL) pipeline data. Near-IR observations were made from 2004 November 25 to 2005 September 19 at the Siding Spring Observatory (SSO) using the near-IR imaging system CASPIR. MSX SMC 029 was detected only at H and K bands (2MASS also detected it, J003646317331351, at H and K but not at J). The IRS and near-IR data reduction followed the standard procedures described in detail by Sloan et al. (2006). Table 1 gives the near-IR photometry from both the SSO and 2MASS. Figure 1 shows the IRS spectrum: MSX SMC 029 has a unique mid-IR spectrum, unlike any known Galactic or extragalactic object.
3 Results and Discussion
3.1 Evolutionary Status
MSX SMC 029 shows the unusual combination of both C2H2 absorption at 13.7 µm and polycyclic aromatic hydrocarbon (PAH) emission features. In its spectral energy distribution (SED), Fν peaks at 17 µm which corresponds to K, although the SED is quite broad so warmer and colder components are also present. We estimated the IR luminosity L(1–100 µm) by integrating the IRS spectrum and extrapolating longward of the IRS range with a 265 K graybody and shortward with a 530 K graybody, both scaled to match the IRS data. In order to determine its likely evolutionary state, we examined Galactic spectra (Kraemer et al., 2002; Sloan et al., 2003) from the Short Wavelength Spectrometer (SWS, de Graauw et al., 1996) on the Infrared Space Observatory (Kessler et al., 1996) and from IRS observations of LMC objects (Buchanan et al., 2006). As noted above, no other object has this combination of mid-IR SED and spectral features: warm dust, PAH emission, and C2H2 absorption. We therefore discuss the possible evolutionary phases that MSX SMC 029 could represent.
Pre-Main Sequence?
Strong PAH emission is commonly observed in H II regions and young stellar objects (YSOs), but C2H2 is not, particularly not at the strength observed in MSX SMC 029. Of the handful of YSOs in which weak C2H2 has been detected (e.g. Lahuis & van Dishoeck, 2000, and references therein), only one has (very weak) PAH emission in its SWS spectrum. All have much colder SEDs than MSX SMC 029, peaking longward of the 45 µm SWS band edge, and have strong absorption from oxygen-rich silicates at 10 µm and often CO2 at 15.5 µm. The luminosity of MSX SMC 029 also much lower than the lowest luminosity H II region identified in the LMC sample of Buchanan et al. (2006), which have L(1–100 µm) . Most of the H II regions in the LMC sample show evidence of being extended, such as flux jumps 50% at 14 µm (between the SL and LL modules) or extended emission in the IR or visible images. MSX SMC 029 shows neither of these effects. It is unlikely, therefore, that MSX SMC 029 is either a YSO or an H II region.
Planetary Nebula?
PAHs have also been observed in Galactic planetary nebulae, but again C2H2 absorption has not. Young PNe typically have dust temperatures of 150 K. MSX SMC 029 does not have any emission from the highly ionized lines often observed in PNe. While the lack of ionized lines and warm dust do not strictly eliminate the PN possibility, the presence of C2H2 does.
AGB Star?
Another possibility is that MSX SMC 029 is an evolved star but is still on the AGB. Carbon-rich AGB stars typically have C2H2 absorption at 13.7 µm, but they do not have PAH emission because they do not produce sufficiently hard radiation fields to excite PAHs. Further, AGB stars with similar near-IR colors () in the LMC have -band amplitudes of 1.5 mag (e.g. Wood, 1998), much greater than the = 0.43 mag observed in MSX SMC 029 (Table 1). The OGLE database (Szymański, 2005) contains a star 22 from the 2MASS position with magnitude 19.2 but no variability above the noise. The presence of PAHs, together with the lack of strong -band variability, implies that MSX SMC 029 cannot be an AGB star.
Post-AGB Object?
Only two spectra in the SWS database show both PAH emission and C2H2 absorption at 13.7 µm, IRAS 134166243 and AFGL 2688 (the Cygnus Egg), both post-AGB sources. We examined all of the spectra from carbon-rich sources (Groups 3, 4, and 5, subgroups CR, CT, CN, PU, U, and UE defined by Kraemer et al., 2002). On this basis alone, MSX SMC 029 looks to be a post-AGB object. No other possibility fits. In addition, as we show below, the PAH spectrum from MSX SMC 029 shows deviations from the standard PAH spectrum consistent with those seen in other post-AGB objects. AFGL 2688 is thought to be only a few hundred years past the AGB stage (Herpin et al., 2002). The dust around MSX SMC 029 is similar, significantly cooler than typically seen around AGB stars, so it is probably of a similar age. Because the dust around MSX SMC 029 is warmer than that around AFGL 2688, it may be even closer to the transition.
3.2 Solid State Features
To extract the PAH features for analysis, we fit a 6th-order polynomial to the spectrum between 5 and 13 µm (smooth line in Fig. 1). Figure 2 shows the ‘continuum’-subtracted result, and Table 2 contains the central wavelengths and fluxes of the detected features. Following Sloan et al. (2005), we extracted the PAH strengths by trapezoidal integration of the emission above a line fit to the continuum to either side using the wavelength ranges given in Table 2. The central wavelength is the wavelength at which half the integrated flux lies to the red and half to the blue. Table 2 also includes fluxes for the two components of the 7–9 µm feature complex. The flux at 12.7 µm is an upper limit; higher-sensitivity data are needed to confirm this possible feature. Confident detection of a PAH feature at 17 µm is precluded by the molecular absorption in the region (see §3.3).
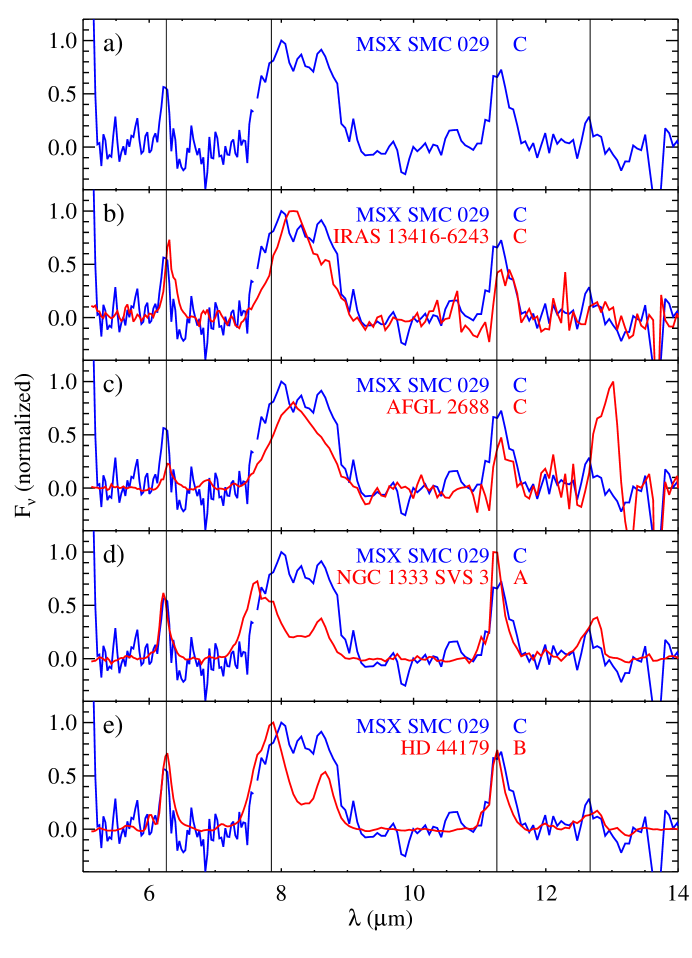
The most striking characteristic of the PAH features is their wavelength shift compared to more typical PAH spectra, as shown in Figure 3. Adopting the classification introduced by Peeters et al. (2002), the PAHs in MSX SMC 029 are class C, a category with only two sources from the SWS database, IRAS 13416 and AFGL 2688, and more recently, HD 233517, an O-rich AGB star with PAH emission from a circumstellar disk observed by the IRS (Jura et al., 2006). In those spectra, the 6.2 µm feature is shifted to 6.3 µm, and the peak of the 7–9 µm PAH complex, which usually occurs at 7.65 or 7.85 µm, is shifted to the red of 8.0 µm. In MSX SMC 029, these features are centered at 6.26 and 8.23 µm, respectively. Excluding the 8.6 µm C–H in-plane bending mode by fitting a line under it shifts the center from 8.23 to 8.12 µm. Alternatively, fitting Gaussians to the two components produces centers at 8.03 and 8.65 µm. However one measures it, the C–C modes usually seen at 7.65 and 7.85 µm here appear redward of 8.0 µm.
The positions and relative strengths of the PAH features have been attributed to the relative dominance of the ionization fraction of the PAHs, their composition, their isotopic ratios, their size, and the degree of UV processing they have undergone, to name a few. Vermeij et al. (2002), for example, examined the role of several of these factors in a small sample of LMC HII region spectra and suggested the molecular structure, which influences which CC and CH modes are present, may control the strengths in the LMC sources. Bregman & Temi (2005) found that the relative strengths of the 7.65 and 7.85 µm features in extended reflection nebulae vary, with the dominant emission shifting from 7.65 to 7.85 µm as the UV field grows weaker. Sloan et al. (2005) interpreted their PAH spectra from Herbig AeBe (HAeBe) stars similarly. These spectra are excited by weak UV fields, and the peak component in this region has shifted further to the red, to 7.9–8.0 µm. The spectrum of MSX SMC 029 follows this trend, with the centroid of the CC modes at 8.1–8.2 µm.
Other characteristics of the PAH spectrum from MSX SMC 029 are consistent with this shift in the CC modes. The entire 7–9 µm PAH complex is only 4 times stronger than the out-of-plane CH bending mode at 11.3 µm, compared to 8–30 times stronger in the HAeBe stars (Sloan et al., 2005), indicating that the ionization fraction of the PAHs is lower in MSX SMC 029. Hony et al. (2001) studied the PAH features in the 11–13 µm region in 16 SWS spectra and found that the relative strengths of the solo and trio CH out-of-plane bending modes at 11.3 and 12.7 µm varied with ionization fraction, with more ionized PAHs having a stronger trio mode at 12.7 µm. They interpreted this result as an indication of PAH processing, with more unprocessed PAHs having long, regular edges and thus more emission in the solo mode. In MSX SMC 029, the ratio of the 12.7 µm trio mode to the 11.3 µm solo mode is at most 0.25 (using the upper limit at 12.7 µm), as low as any in the sample examined by Hony et al. (2001). They also show that this ratio decreases as the ionization fraction decreases. The PAH spectrum of MSX SMC 029 follows this trend, indicating both a low ionization fraction (low 7–9 µm/11.3 µm ratio) and relatively unprocessed PAHs (low 12.7 µm/11.3 µm ratio).
3.3 Molecular Absorption Features
Cernicharo et al. (2001) recently made the first detections of the polyacetylenic molecules C4H2 (diacetylene) and C6H2 outside the Solar System in the very young post-AGB objects AFGL 618 and AFGL 2688, as well as detecting the more familiar bands of C2H2 (acetylene) at 13.7 µm and HCN at 14 µm. In MSX SMC 029, the C2H2 band is the most prominent and easily identified molecular absorption feature. The limited signal-to-noise ratio and trouble determining a continuum level make extracting other features challenging. Fortunately, Bernard-Salas et al. (2006) recently observed the post-AGB object SMP LMC 11 with both the high- and low-resolution modules of IRS. They identified several hydrocarbons in the high-resolution spectrum whose fingerprints are also clearly discernible in the low-resolution spectrum. In addition to C2H2, their spectrum shows absorption from C6H6 and HC3N (benzene and cyanoacetylene) at 15 µm and C4H2 at 16 µm. Figure 4 compares MSX SMC 029 to SMP LMC 11. The similarity of the spectra leads us to suggest that the same molecules may be shaping the MSX SMC 029 spectrum. The absorption near 16 µm in MSX SMC 029 has an additional red component which could be from C6H2 as was seen in AFGL 618 (Cernicharo et al., 2001). Absorption from the P and R branches of the C2H2 feature may affect the appearance of the spectra as well. The strong mid-IR absorption and non-detection at band, combined with a preliminary model that suggests high visual opacity, imply the presence of very dense material. This could a residual circumstellar envelope from the AGB phase, which would be consistent with the youth of the post-AGB object, although such a nebula may require more extreme youth than is likely, or the material could be in the form of a dense disk.
4 Summary
We obtained a 5–35 µm low-resolution spectrum from MSX SMC 029 with the Spitzer IRS. It has an unusual spectral energy distribution and combination of mid-IR spectral features. MSX SMC 029, like the post-AGB objects AFGL 2688 and IRAS 134166243, shows both C2H2 absorption at 13.7 µm and PAH emission features. The PAHs in MSX SMC 029 are in the rare C class of Peeters et al. (2002). The shape of the 7–9 µm PAH complex and the relative flux of the 11.3 µm feature to that of the 12.7 µm feature suggest that MSX SMC 029 has a low ionization fraction or unprocessed PAHs. The 13–16 µm wavelength region is similar to that of SMP LMC 11 and may be shaped by the same absorption features that have been resolved in the LMC source and in AFGL 618: C2H2, C4H2, HC3N, C6H6, and possibly C6H2. We suggest that MSX SMC 029 is a very young post-AGB object, only the third known in the SMC.
References
- Bernard-Salas et al. (2006) Bernard-Salas, J., Peeters, E., Sloan, G. C., Cami, J., & Houck, J. R. 2006, ApJ, submitted
- Bregman & Temi (2005) Bregman, J., & Temi, P. 2005, ApJ, 621, 831
- Buchanan et al. (2006) Buchanan, C. L., Kastner, J. H., Forrest, W. J., Hrivnak, B. J., Sahai, R., Egan, M., Frank, A., & Barnbaum, C. 2006, AJ, in press
- Cernicharo et al. (2001) Cernicharo, J., Heras, A. M., Tielens, A. G. G. M., Pardo, J. R., Herpin, F., Guélin, M., & Waters, L. B. F. M. 2001, ApJ, 546, L123
- de Graauw et al. (1996) de Graauw, Th. 1996, A&A, 315, L41
- Egan et al. (2003) Egan, M. P., et al. 2003, Air Force Research Laboratory Technical Report AFRL-VS-TR-2003-1589
- Egan, van Dyk, & Price (2001) Egan, M. P., van Dyk, S. D., & Price, S. D. 2001, AJ, 122, 1844
- Herpin et al. (2002) Herpin, F., Goicoechea, J. R., Pardo, J. R., & Cernicharo, J. 2002, ApJ, 577, 961
- Hony et al. (2001) Hony, S., Van Kerckhoven, C., Peeters, E., Tielens, A. G. G. M., Hudgins, D. M., & Allamandola, L. J. 2001, A&A, 370, 1030
- Houck et al. (2004) Houck, J., et al. 2004, ApJS, 154, 18
- Jura et al. (2006) Jura, M., et al. 2006, ApJ, 637, L45
- Kessler et al. (1996) Kessler, M. F., et al. 1996, A&A, 315, L27
- Kraemer et al. (2002) Kraemer, K. E., Sloan, G. C., Price, S. D., & Walker, H. J. 2002, ApJS, 140, 389
- Kucinskas et al. (2000) Kucinskas, A, Vansevicius, V, Sauvage, M, & Tanabé, T. 2000, A&A, 353, L21
- Lahuis & van Dishoeck (2000) Lahuis, F., & van Dishoeck, E. F. 2000, A&A, 355, 699
- Peeters et al. (2002) Peeters, E., Hony, S., Van Kerckhoven, C., Tielens, A. G. G. M., Allamandola, T. L., Hudgins, D. M., & Bauschlicher, C. W. 2002, A&A, 390, 1089
- Sloan et al. (2005) Sloan, G. C., et al. 2005, ApJ, 632, 956
- Sloan et al. (2003) Sloan, G. C., Kraemer, K. E., Price, S. D., & Shipman, R. F. 2003, ApJS, 147, 379
- Sloan et al. (2006) Sloan, G. C., Kraemer, K. E., Matsuura, M., Wood, P. R., Price, S. D., & Egan, M. P. 2006, ApJ, 645, 1118
- Szymański (2005) Szymański, M. 2005, Acta Astron. 55, 43
- Van Winckel (2003) Van Winckel, H. 2003, ARA&A, 41, 391
- Vermeij et al. (2002) Vermeij, R., Peeters, E., Tielens, A. G.G.M., & van der Hulst, J. M. 2002, A&A, 382, 1042
- Werner et al. (2004) Werner, M., et al. 2004, ApJS, 154, 1
- Whitelock et al. (1989) Whitelock, P. A., Feast, M. W., Menzies, J. W., & Catchpole, R. M. 1989, MNRAS, 238, 769
- Wood (1998) Wood, P. R. 1998, A&A, 338, 592
- Wood & Cohen (2001) Wood, P. R., & Cohen, M. 2001, in “Post-AGB Objects as a Phase of Stellar Evolution” ed. R. Szczerba & S. K. Górny (Dordrecht: Kluwer), 71
| Date | H | K | Source |
|---|---|---|---|
| 980808 | 15.750.18 | 13.500.04 | 2MASS |
| 041125 | 15.790.07 | 13.750.17 | SSO |
| 050126 | 13.670.06 | SSO | |
| 050312 | 13.920.08 | SSO | |
| 050724 | 13.740.03 | SSO | |
| 050919 | 13.740.05 | SSO |
Note. — Dates are in the form YYMMDD. K-band wavelengths are Ks=2.17 µm for 2MASS and K=2.22 µm for SSO
| Flux | |||
|---|---|---|---|
| (µm) | ( W m-2) | (µm) | (µm) |
| 6.260.03 | 5.80–5.95 | 6.65–6.80 | |
| 8.230.06 | 7.30–7.60 | 9.00–9.30 | |
| 11.320.05 | 10.80–11.05 | 11.85–11.95 | |
| 12.69 | 12.35–12.60 | 13.25–13.40 | |
| 8.03 | 2.50 | ||
| 8.65 | 1.41 |
Note. — and are the ranges over which the line segments were fit for the flux integration. Approximate fluxes for the components of the 7–9 µm complex are from integrating the Gaussian fits. Thus, the sum of the fluxes does not equal the total given for 8.25 µm.