Modeling Chandra X-ray observations of Galaxy Clusters using Cosmological Simulations
1 Abstract
X-ray observations of galaxy clusters potentially provide powerful cosmological probes if systematics due to our incomplete knowledge of the intracluster medium (ICM) physics are understood and controlled. In this paper, we study the effects of galaxy formation on the properties of the ICM and X-ray observable-mass relations using high-resolution self-consistent cosmological simulations of galaxy clusters and comparing their results with recent Chandra X-ray observations. We show that despite complexities of their formation and uncertainties in their modeling, clusters of galaxies both in observations and numerical simulations are remarkably regular outside of their cores, which holds great promise for their use as cosmological probes.
2 Testing X-Ray Measurements of Galaxy Clusters
X-ray observations with Chandra and XMM-Newton enable us to study properties of the ICM with unprecedented detail and accuracy and provide important handles on the ICM modeling and associated systematics. Their superb spatial resolution and sensitivity enable accurate X-ray brightness and temperature measurements at a large fraction of the cluster virial radius and also make it simple to detect most of the small-scale X-ray clumps. Despite this recent observational progress, the biases in the determination of the key cluster properties remain relatively uncertain.
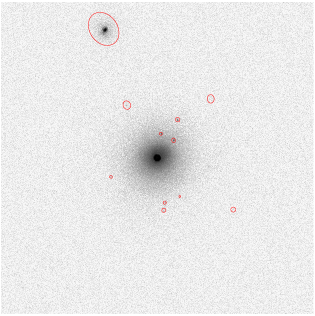
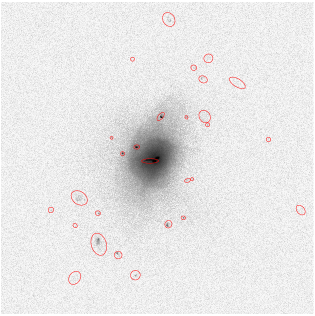
We therefore assess the accuracy of the X-ray measurements of galaxy cluster properties using mock Chandra analyses of cosmological cluster simulations and analyzing them using a model and procedure essentially identical to that used in real data analysis vikhlinin_etal05c ; vikhlinin_etal06 . The comparison of the true and derived cluster properties provides an assessment of biases introduced by the X-ray analysis. We examine the bias in mass measurements separately for dynamically relaxed and non-relaxed clusters, identified based on the overall structural morphology of their Chandra images, which mimics the procedure used by observers. The typical examples of systems classified as relaxed or unrelaxed are shown in Figure 1. To check for any redshift dependence in such biases, we also analyze the simulation outputs at and . The simulations and analysis procedures are fully described in nagai_etal06 .
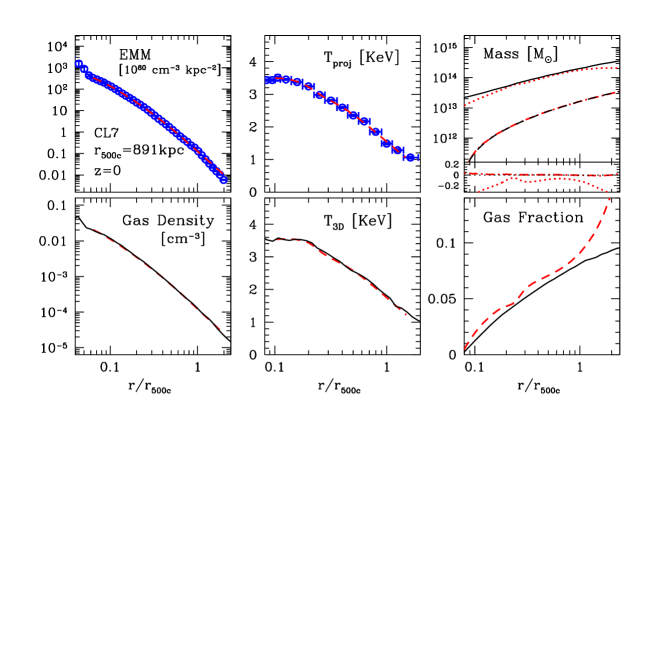
Figure 2 illustrates that the X-ray analysis provides accurate reconstruction of the 3D properties of the ICM for the nearby, relaxed clusters. The strongest biases we find are those in the hydrostatic mass estimates, which is biased at a level of about at even in the relaxed clusters. We find that the biases are primarily due to additional pressure support provided by subsonic bulk motions in the ICM, ubiquitous in our simulations even in relaxed systems faltenbacher_etal05 ; rasia_etal06 ; lau_etal06 . These biases are related to physics explicitly missing from the hydrostatic method (e.g., turbulence), and not to deficiencies of the X-ray analysis. Gas fraction determinations are therefore biased high. The bias increases toward cluster outskirts and depends sensitively on its dynamical state, but we do not observe significant trends of the bias with cluster mass or redshift. We also compute a X-ray spectral temperature (), a value derived from a single-temperature fit to the integrated cluster spectrum excluding the core () and detectable small-scale clumps mazzotta_etal04 ; vikhlinin_etal06b .
3 Effects of Galaxy Formation on the ICM Profiles
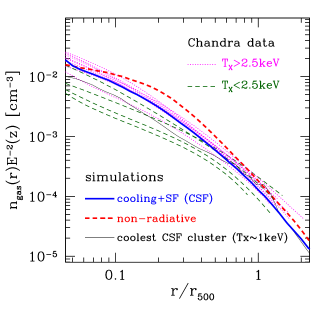
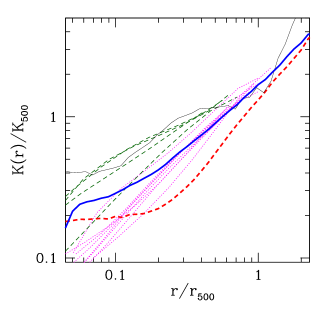
Next, we investigate the effects of galaxy formation on the ICM properties and compare the results of simulations with recent Chandra X-ray observations of nearby relaxed clusters. The impact of galaxy formation on the properties of ICM are investigated by comparing simulations performed with and without the processes of galaxy formation (e.g., gas cooling, star formation, stellar feedback and metal enrichment), which we refer to as the cooling+SF (CSF) and non-radiative runs, respectively. Fig. 3 shows that gas cooling and star formation modify both the normalization and the shapes of the ICM profiles. What happens is that the removal of low-entropy gas in the inner region raises the level of entropy and lowers the gas density voit_etal01 . The effects are strongly radial dependent and increase toward the inner regions down to about , inside which the observed properties are not well reproduced in the simulations. On the other hand, the ICM properties outside the cores in the cooling CSF simulations and observations agree quite well. At , both the ICM density and entropy profiles of different mass systems converge, indicating that the clusters are self-similar in the outskirts. Note that the non-radiative simulations predict overall shape of the density and entropy profiles inconsistent with observations.
4 X-ray observable-mass relations
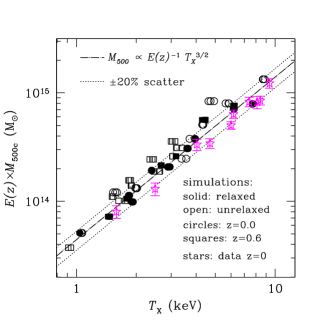
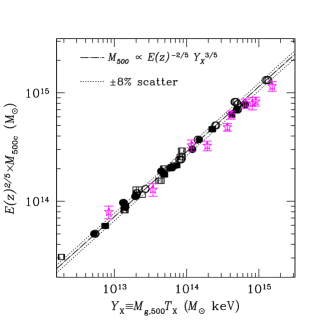
For cosmological application, it is important to understand the relations between X-ray observables and cluster mass. In Fig. 4, we present recent comparisons of two X-ray proxies for the cluster mass — the spectral temperature, , and the new proxy, , defined as a simple product of and kravtsov_etal06 . Analogously to the integrated Sunyaev-Zel’dovich flux, is related to the total thermal energy of the ICM.
The relation has a scatter in around the mean relation, most of which is due to unrelaxed clusters. The unrelaxed clusters also have temperatures biased low for a given mass. This is likely because during mergers, the mass of the system has already increased but only a fraction of the kinetic energy of merging systems is converted into the thermal energy of gas, due to incomplete relaxation mathiesen_evrard01 . The slope and evolution of the relation are also quite close to the self-similar model.
The relation shows the scatter of only . Note that this value of scatter includes clusters at both low and high-redshifts and both relaxed and unrelaxed systems. In fact, the scatter in for relaxed and unrelaxed systems is indistinguishable within the errors. is therefore a robust mass indicator with remarkably low scatter in for fixed , regardless of whether the clusters are relaxed or not. The redshift evolution of the relation is also close to the simple self-similar prediction, which makes this indicator a very attractive observable for studies of cluster mass function with X-ray selected samples, because it indicates that the redshift evolution can be parameterized using a simple, well-motivated function.
Finally, the results of the simulations are compared to the observational results. In both relations, the observed clusters show a tight correlation with a slope close to the self-similar value. The normalization for our simulated sample agrees with the Chandra measurements to . This is a considerable improvement given that significant disagreement existed just several years ago finoguenov_etal01 ; pierpaoli_etal03 . The residual systematic difference in the normalization is likely caused by non-thermal pressure support from bulk gas motions, which is unaccounted for in X-ray hydrostatic mass estimates. The much improved agreement of simulations and observations in these relations gives us confidence that the clusters formed in modern simulations are sufficiently realistic and thus can be meaningfully used for interpretation of observations. The existence of tight relations of X-ray observables, such as , and total cluster mass and the simple redshift evolution of these relations hold promise for the use of clusters as cosmological probes.
References
- (1) Vikhlinin, A., Markevitch, M., Murray, S. S., Jones, C., Forman, W., & Van Speybroeck, L. 2005, ApJ, 628, 655
- (2) Vikhlinin, A., Kravtsov, A., Forman, W., Jones, C., Markevitch, M., Murray, S., & Van Speybroeck, L. 2006, ApJ, 640, 691
- (3) Nagai, D., Kravtsov, A.V., & Vikhlinin, A., 2006, ApJ, in press (astro-ph/0609247)
- (4) Faltenbacher, A., Kravtsov, A. V., Nagai, D., & Gottlöber, S. 2005, MNRAS, 358, 139
- (5) Rasia, E., Ettori, S., Moscardini, L., Mazzotta, P., Borgani, S., Dolag, K., Tormen, G., Cheng, L. M., & Diaferio, A. 2006, MNRAS, 369, 2013
- (6) Lau, E., Kravtsov, A. V., & Nagai, D. 2006, in preparation
- (7) Mazzotta, P., Rasia, E., Moscardini, L., & Tormen, G. 2004, MNRAS, 354, 10
- (8) Vikhlinin, A. 2006, ApJ, 640, 710
- (9) Voit, G. M., Bryan, G. L. 2001, Nature, 2001, 414, 425
- (10) Kravtsov, A. V., Vikhlinin, A. A., & Nagai, D. 2006, ApJ, 650, 128
- (11) Mathiesen, B. F. & Evrard, A. E. 2001, ApJ, 546, 100
- (12) Finoguenov, A., Reiprich, T. H., & Böhringer, H. 2001, A&A, 368, 749
- (13) Pierpaoli, E., Borgani, S., Scott, D., & White, M. 2003, MNRAS, 342, 163